Solana records 6-week inflow streak, but THIS level is key for SOL

ambcryptoPublished on 2026-03-17Last updated on 2026-03-17

Abstract

Solana (SOL) has recorded six consecutive weeks of institutional inflows, with $9.1 million in net inflows last week, bringing year-to-date totals to $181 million—second only to Bitcoin. This reflects sustained institutional interest and growing market confidence. Spot market data confirms strong buyer dominance, supporting recent price action. Technically, SOL broke out of a wedge consolidation pattern and is currently retesting the breakout level near $93.74. If this level holds, the next key target is the $100 liquidity zone, where a significant cluster of leveraged positions exists. Overall, the combination of continued institutional inflows and robust spot demand suggests a constructive outlook, though maintaining the breakout is crucial for sustaining bullish momentum toward $100.

Solana [SOL] saw rising institutional demand, with digital asset investment products recording $9.1 million in net inflows last week.

That marked the 6th straight week of inflows, pushing year-to-date totals to $181 million. Only Bitcoin [BTC] recorded higher inflows.

That trend pointed to sustained institutional interest, often linked with improving market confidence.

In fact, capital appeared to rotate beyond Bitcoin as investors diversified into Solana-linked products.

Consistent inflows typically supported price stability and could reinforce short-term bullish momentum.

However, flows alone rarely sustained rallies without confirmation from spot demand.

Spot market confirms buyer dominance

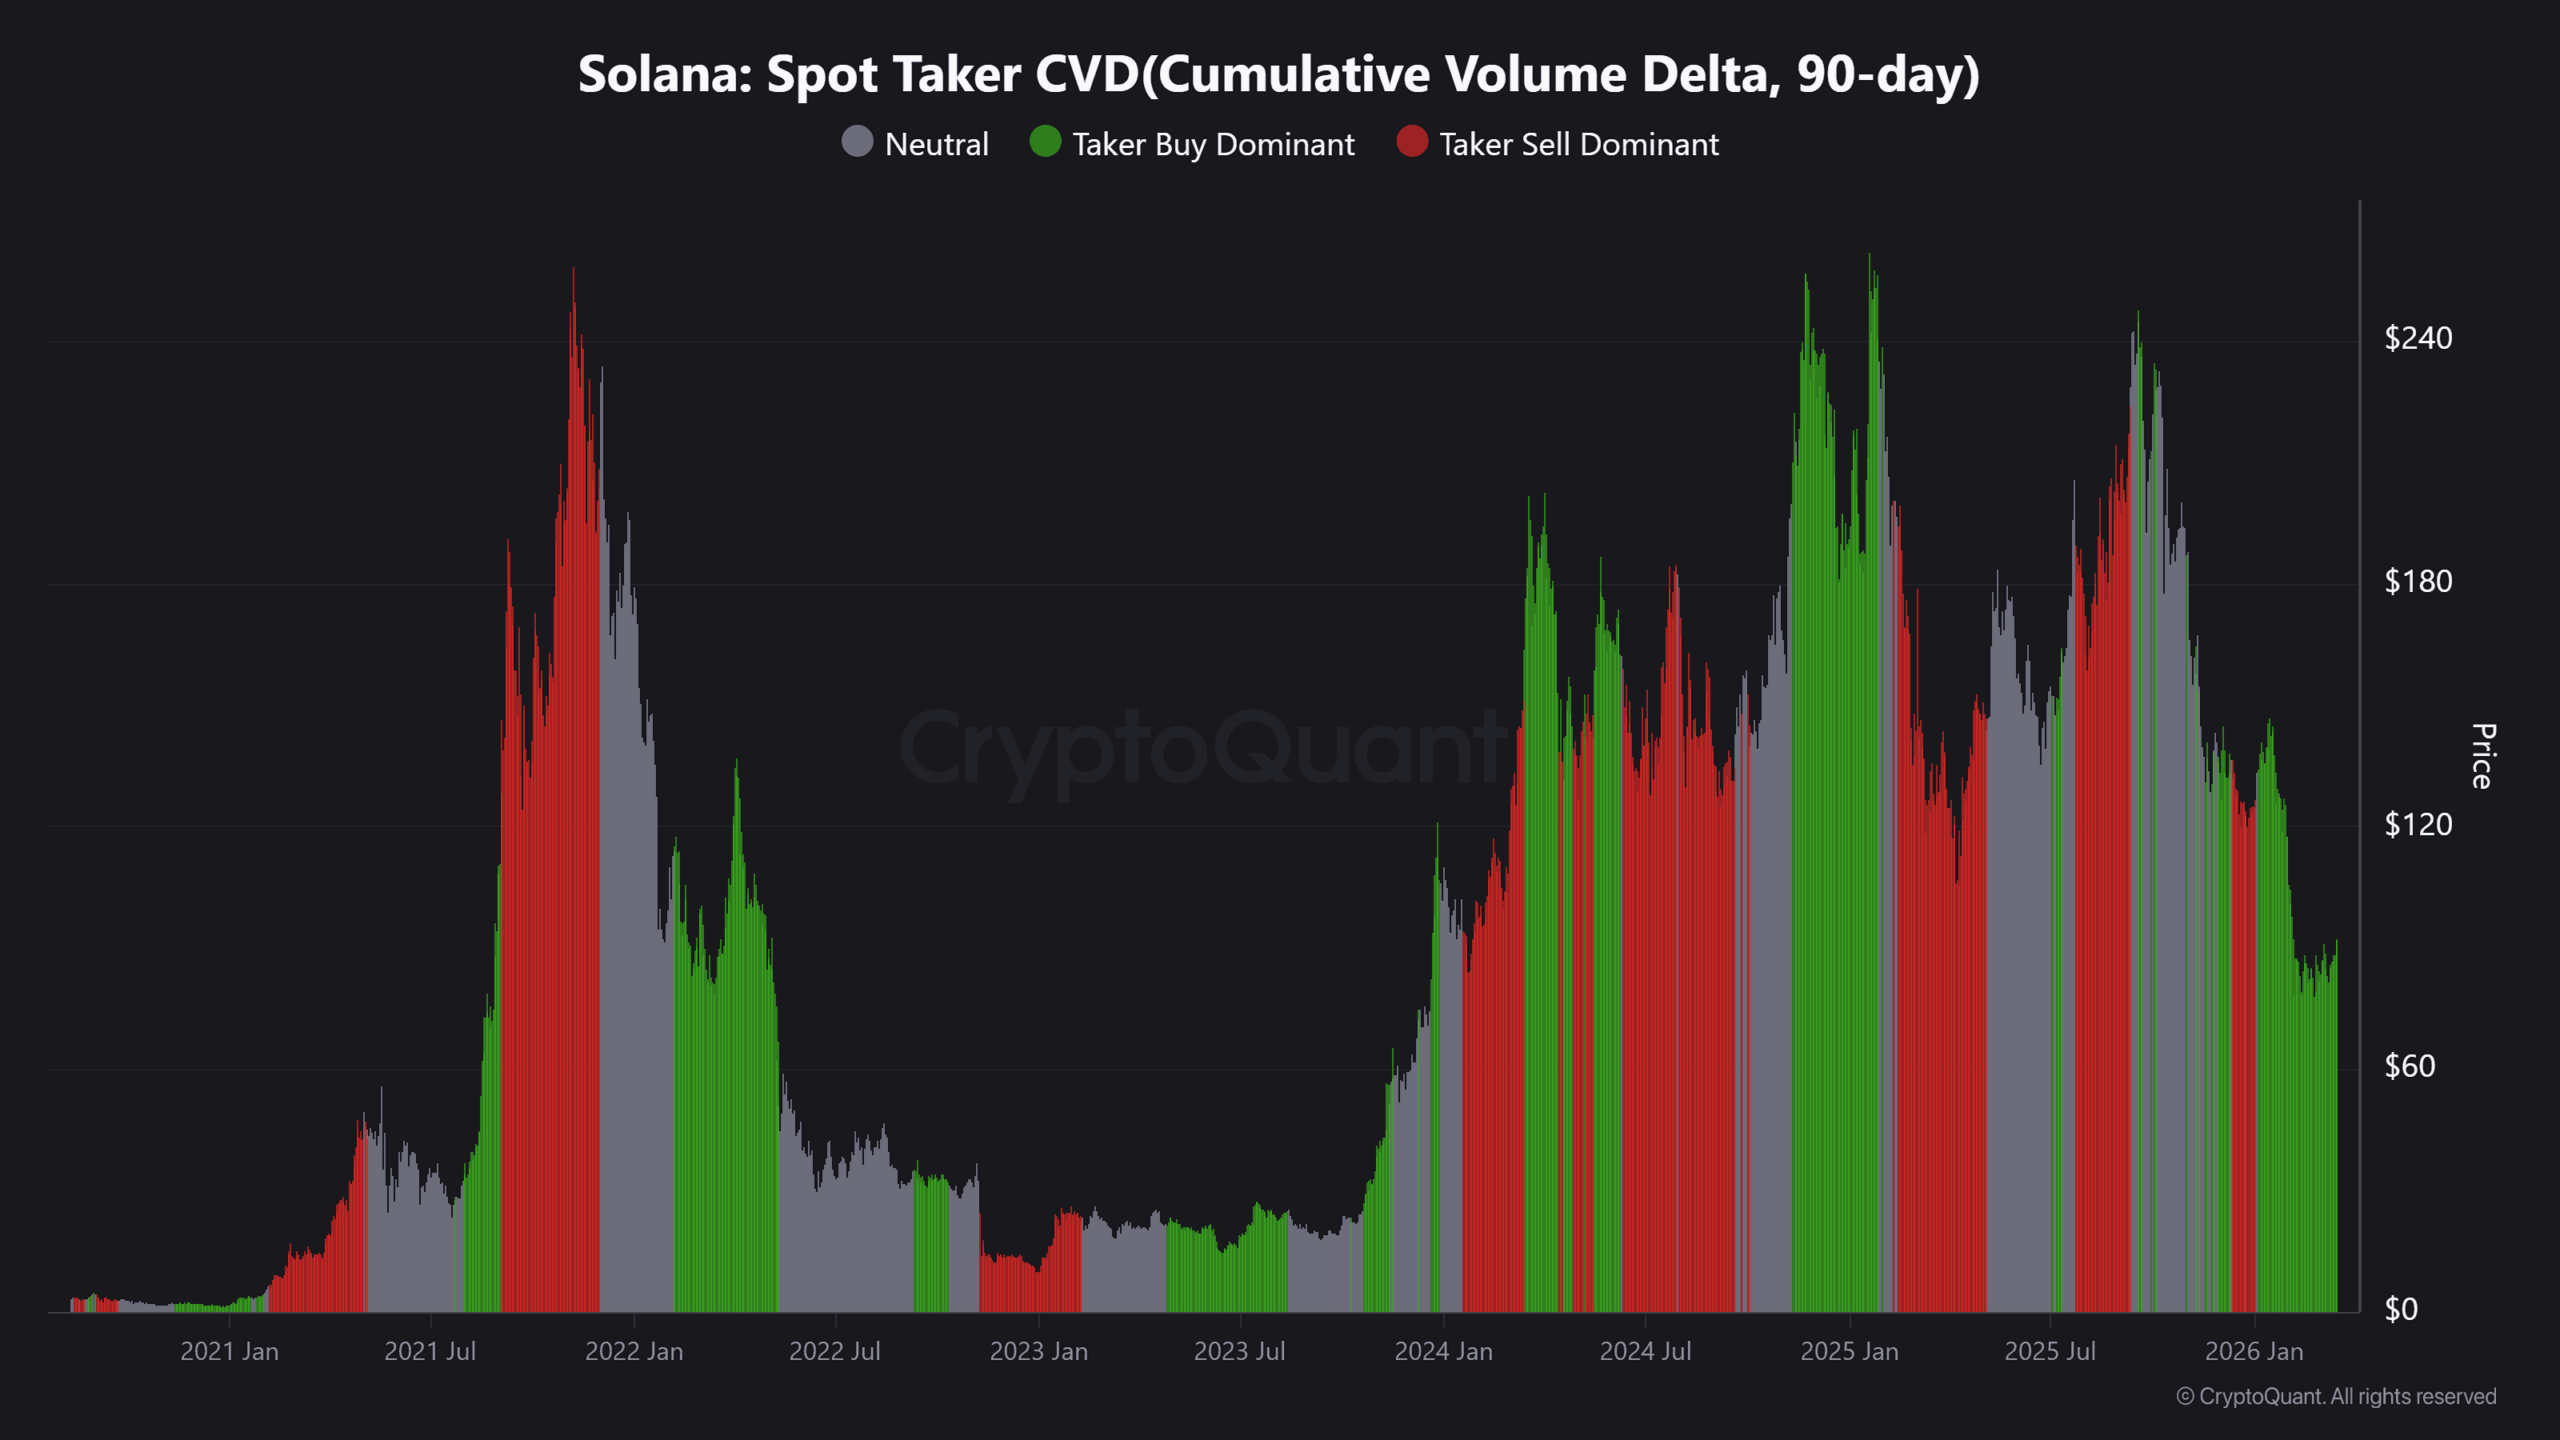
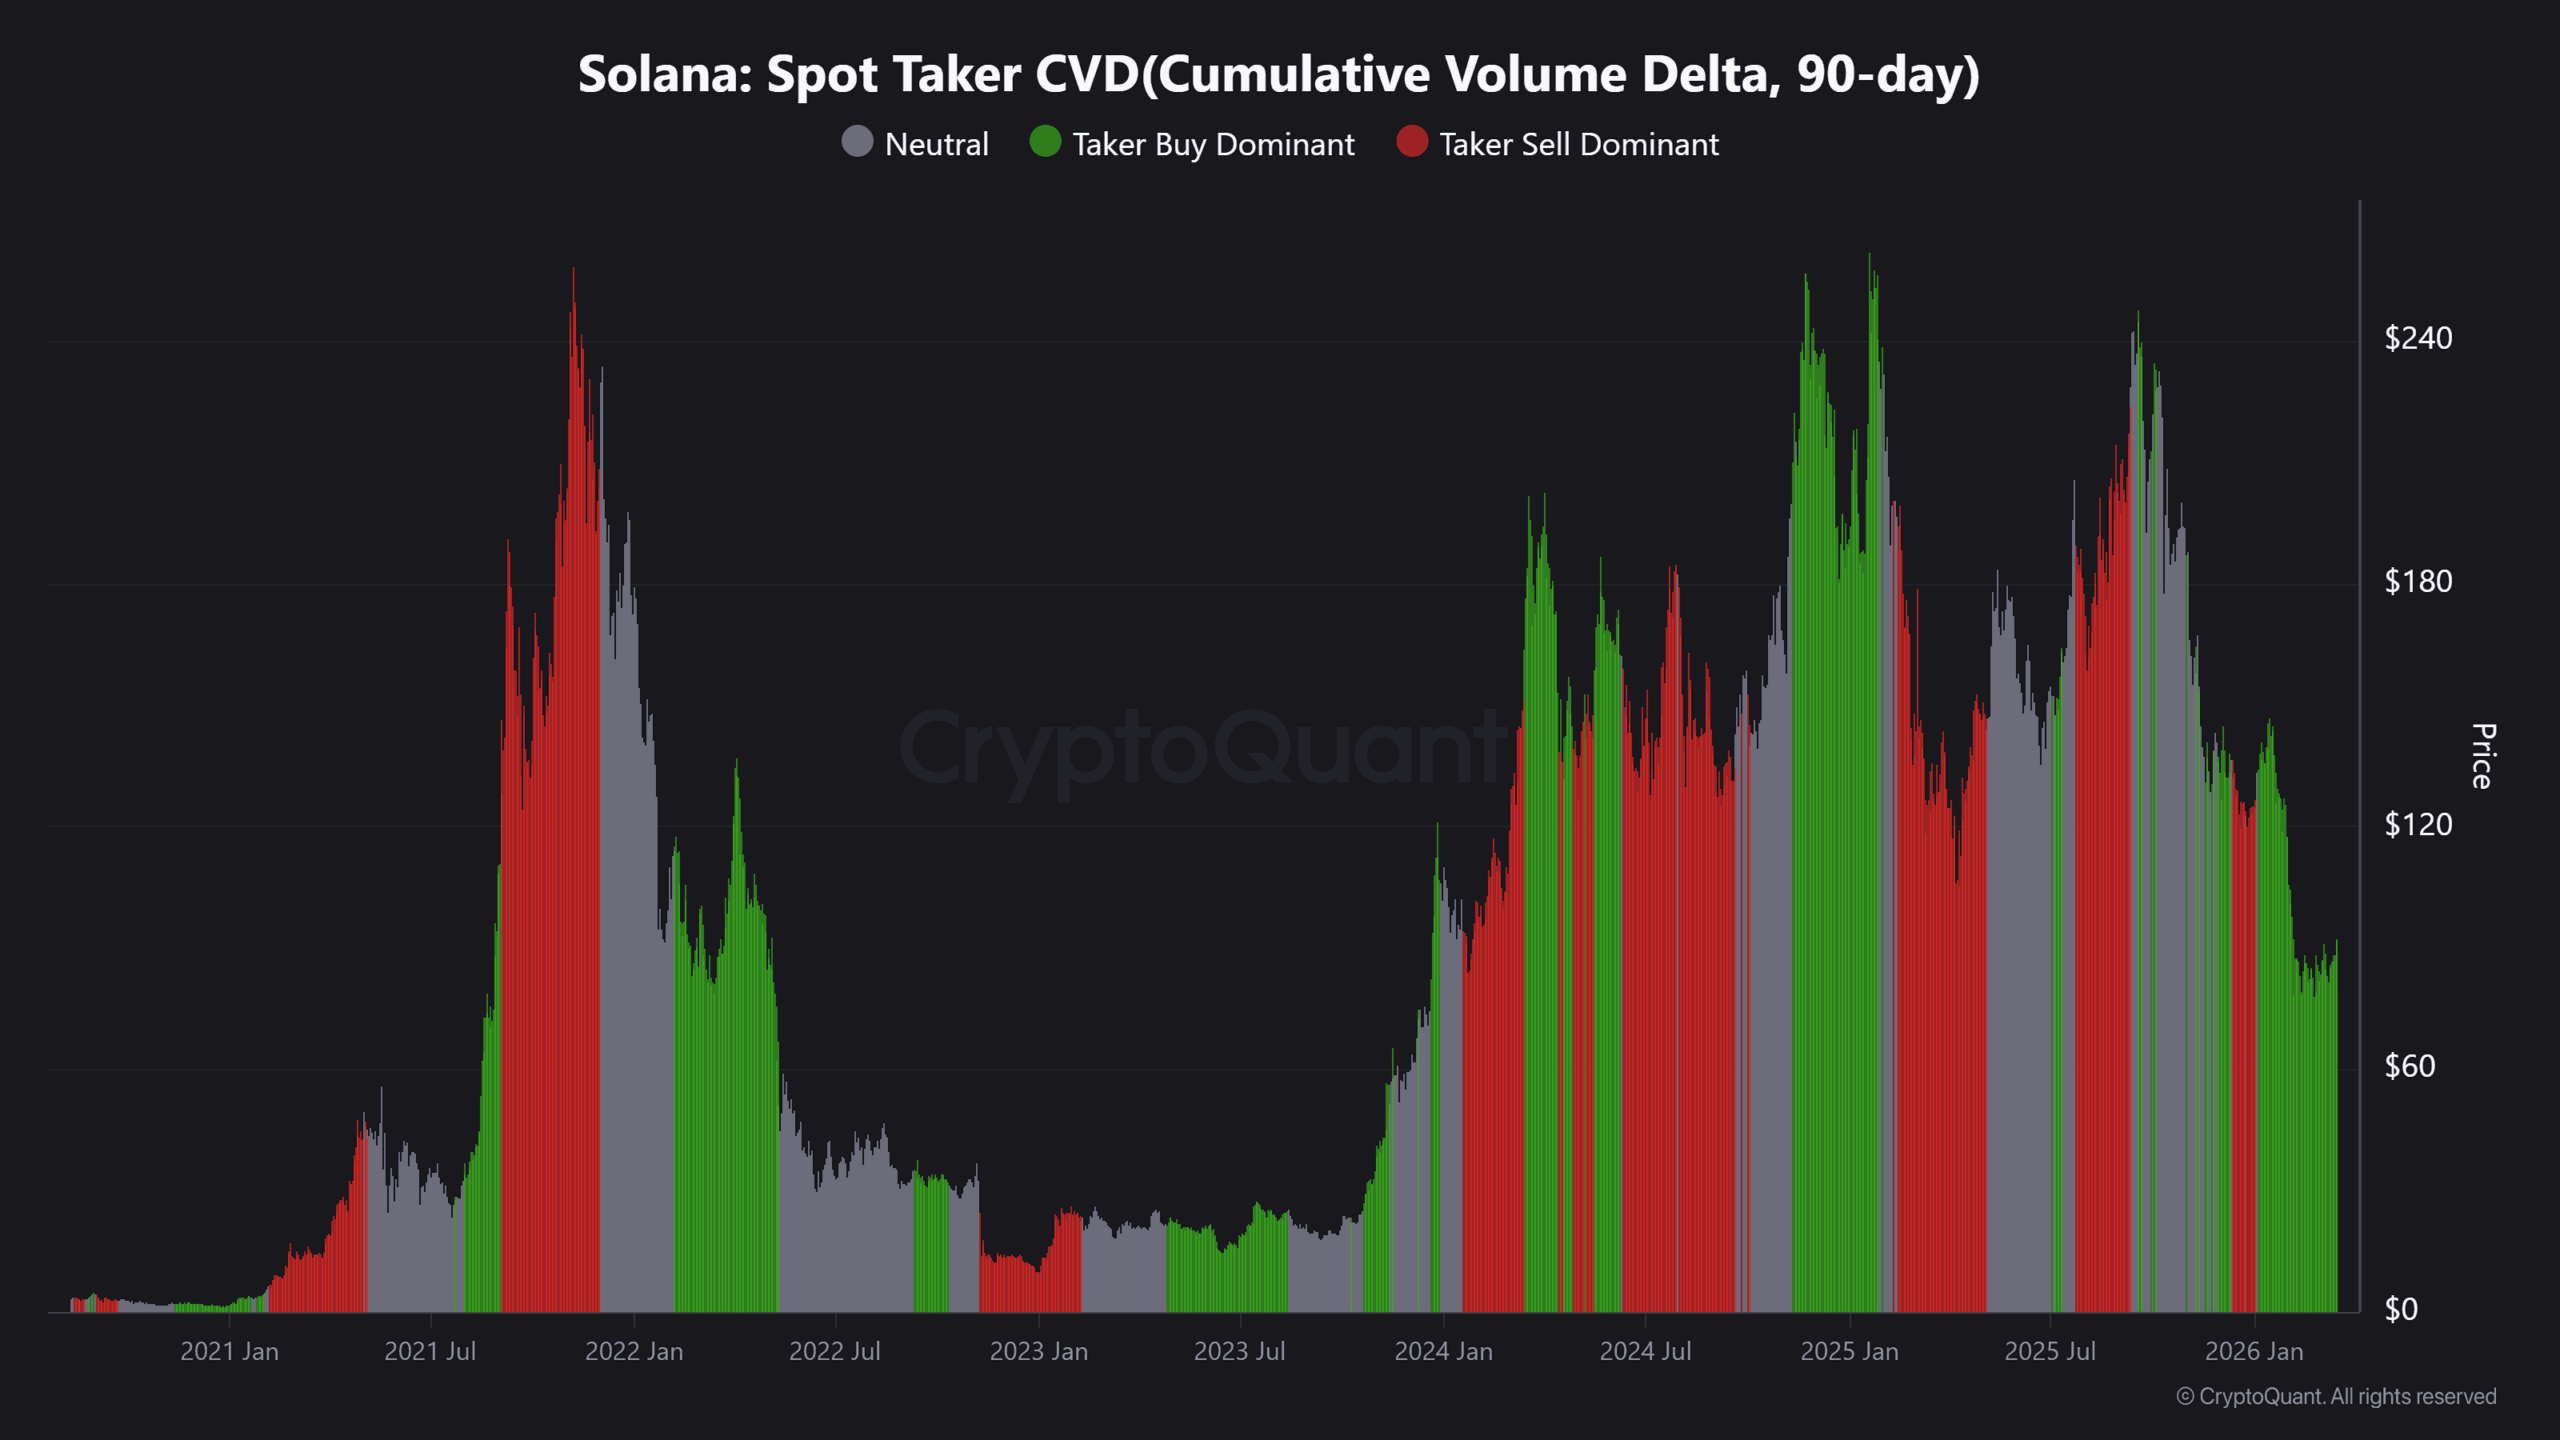
Spot Taker CVD data confirmed strong buyer dominance in recent weeks. Aggressive buyers lifted offers, indicating sustained Spot demand.

That shift aligned with stronger upward pressure building across the market.
Source: CryptoQuant

When Spot demand leads, price trends tend to hold better over time. Even so, momentum still depended on structure holding above breakout levels.

Technical breakout shifts momentum

Price action aligned with the improving demand profile.

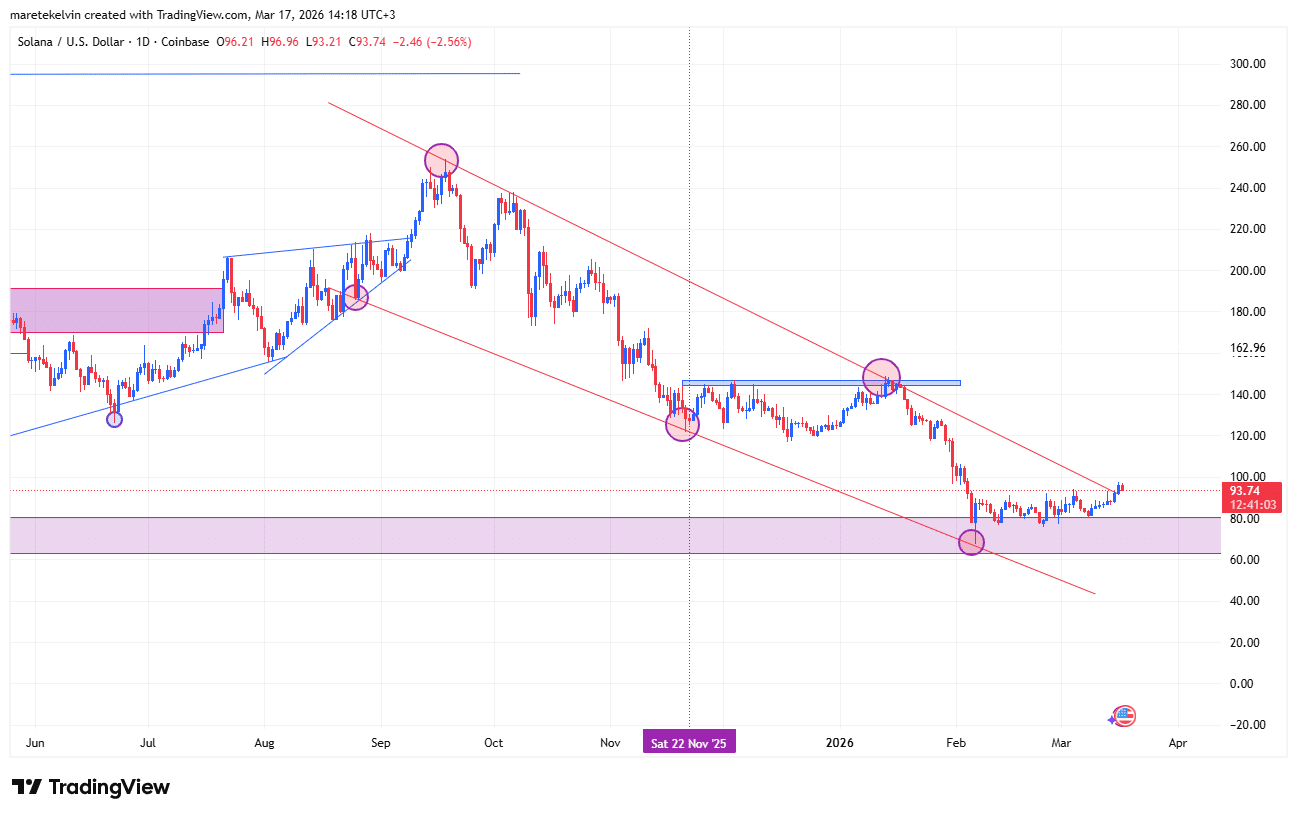
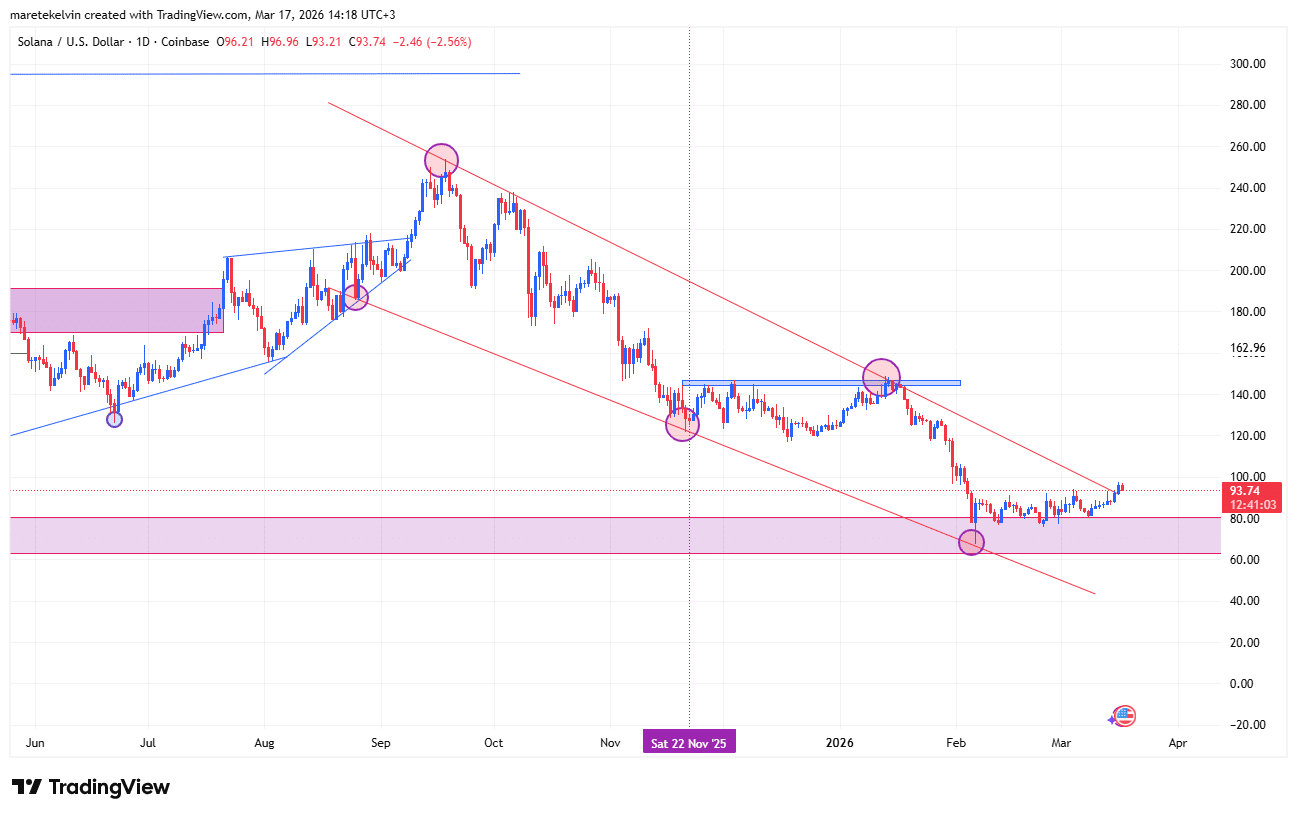
On the daily chart, SOL broke out of a wedge consolidation pattern, signaling a potential trend shift. At press time, SOL traded near $93.74 after a short-term pullback.

That move suggested a classic retest phase following the breakout.

Retests often allow investors to re-enter positions and confirm breakout strength. If the level holds, the breakout may extend into a stronger trend phase.
Source: TradingView

$100 emerges as the next key target

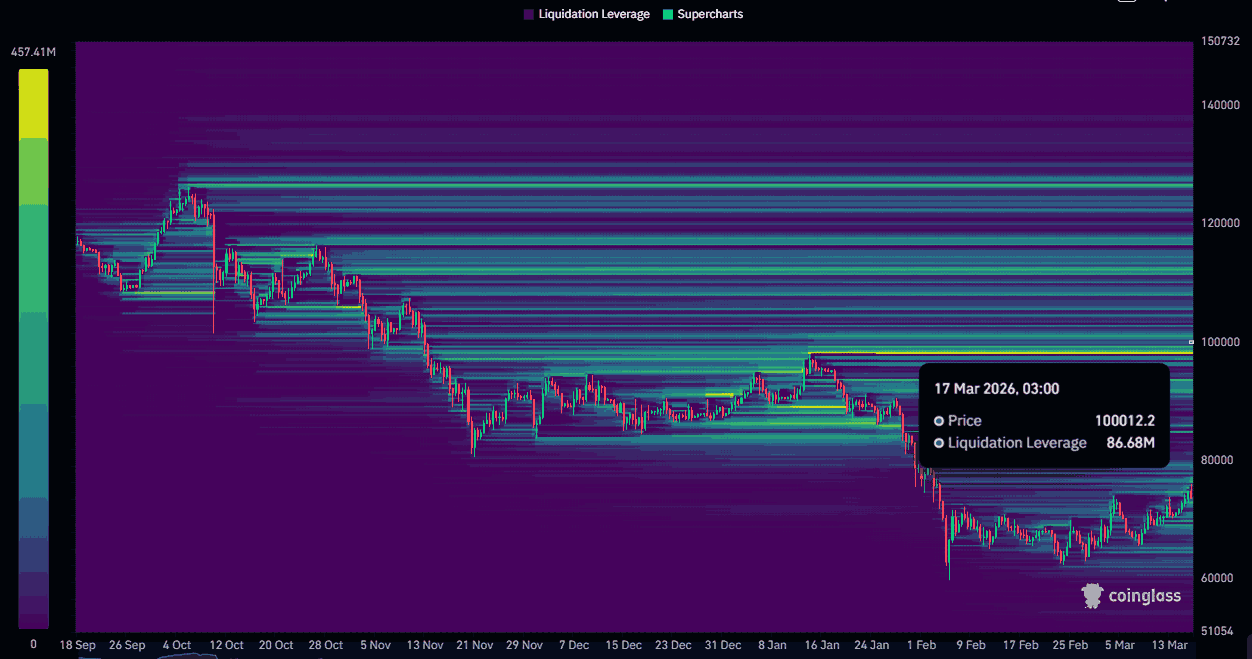
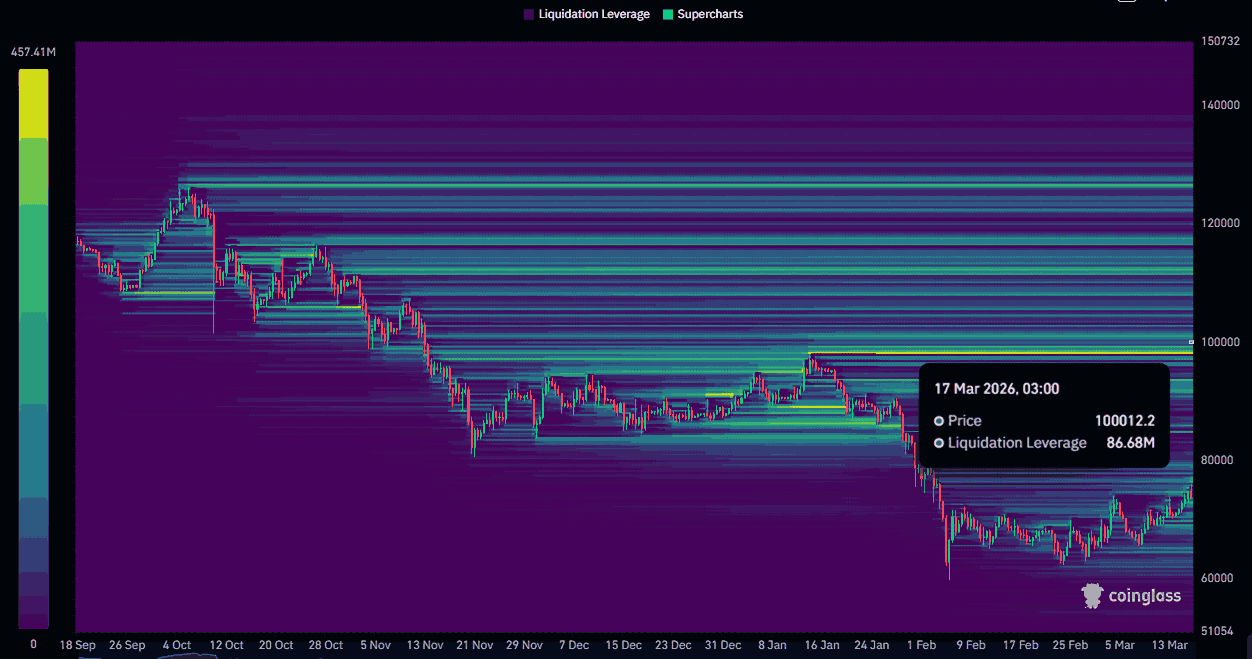
Market focus shifted toward the next liquidity zone near $100.

CoinGlass data showed a Liquidation cluster worth $86.68 million around that level. That concentration made $100 a key magnet for price action.

On top of that, clustered liquidity often attracts price as traders target leveraged positions.

However, failure to hold current levels could delay any move toward that zone.
Source: CoinGlass

What could be next for SOL

The setup remained constructive at the time of writing.

Institutional inflows stayed strong, while Spot demand supported the price structure. If both trends persisted, SOL could extend toward the $100 liquidity zone.

Even so, the breakout needed to hold to maintain bullish momentum.


Final Summary

  • Solana recorded $9.1M inflows, extending its streak to six consecutive weeks.
  • Year-to-date inflows reached $181M, second only to Bitcoin.

Trending Cryptos

Related Questions

QWhat was the amount of Solana's net institutional inflows last week, and how long has the inflow streak lasted?

ASolana recorded $9.1 million in net institutional inflows last week, marking the 6th consecutive week of inflows.

QAccording to the article, what is the key price level that is acting as a magnet for SOL's price action?

AThe $100 level is identified as the key liquidity zone and the next target for SOL's price action.

QWhat on-chain metric confirmed strong buyer dominance in the spot market for SOL?

AThe Spot Taker CVD data confirmed strong buyer dominance, indicating aggressive buyers were lifting offers.

QWhat technical pattern did SOL break out of on its daily chart, signaling a potential trend shift?

ASOL broke out of a wedge consolidation pattern on the daily chart.

QWhat is the total year-to-date institutional inflow for Solana, and how does it compare to Bitcoin?

ASolana's year-to-date institutional inflows total $181 million, which is second only to Bitcoin.

Related Reads

Why Bitcoin Holds Above $64,000 After Fed's Hard Pause

**Bitcoin Stabilizes Near $64,000 Following Hawkish Fed Pause** The cryptocurrency market, led by Bitcoin, remained stable around $64,000 despite a volatile reaction to the latest U.S. Federal Reserve meeting. The Fed paused interest rates but signaled a hawkish stance, with three committee members voting for an increase—the highest dissent since 2016. This limits risk appetite but hasn't triggered panic selling. Key market highlights include Bitcoin ETFs seeing a net inflow of $32.1 million, breaking a streak of outflows, while Ethereum ETFs experienced outflows of $18.65 million. Liquidations affected about 90,000 traders. Technically, Bitcoin finds support around $63,000-$63,500, with major resistance near $66,000. While its price is about 49% below its all-time high, institutional demand via ETFs and the absence of mass capitulation support a potential recovery scenario in the second half of the year. Major altcoins showed mixed movements, with Solana attracting capital while Ethereum faced selling pressure despite strong on-chain metrics like a growing staking queue. Regulatory news took a pause as the U.S. Senate delayed the CLARITY Act vote until at least autumn. For the final trading day of July, U.S. inflation and consumer spending data will be crucial. Bitcoin's key levels to watch are $63,000 support and $66,000 resistance. Sustained ETF inflows and Bitcoin holding above $63,000 are seen as positive signs for a potential market recovery later in the year.

cryptonews.ru3h ago

Why Bitcoin Holds Above $64,000 After Fed's Hard Pause

cryptonews.ru3h ago

Trading

Spot

Hot Articles

Discussions

Welcome to the HTX Community. Here, you can stay informed about the latest platform developments and gain access to professional market insights. Users' opinions on the price of SOL (SOL) are presented below.

活动图片