Solana price consolidates in KEY range: Could SOL fall under $50?

ambcryptoPublished on 2026-04-10Last updated on 2026-04-10

Abstract

Solana (SOL) has been consolidating within a $78–$92 range since early February, following a sharp drop on March 5. Despite brief attempts to rise above the 50-day moving average (currently at $85.43), SOL has consistently failed to sustain above it since November 2025. This pattern has repeated multiple times, with each consolidation below the 50-day MA followed by a significant sell-off. Analysts suggest that if SOL remains unable to reclaim and hold above this key level, another downward move is likely. The long-term bearish outlook remains, with expectations that SOL could eventually fall below $50, especially after the rejection of the $95.26 resistance level in March.

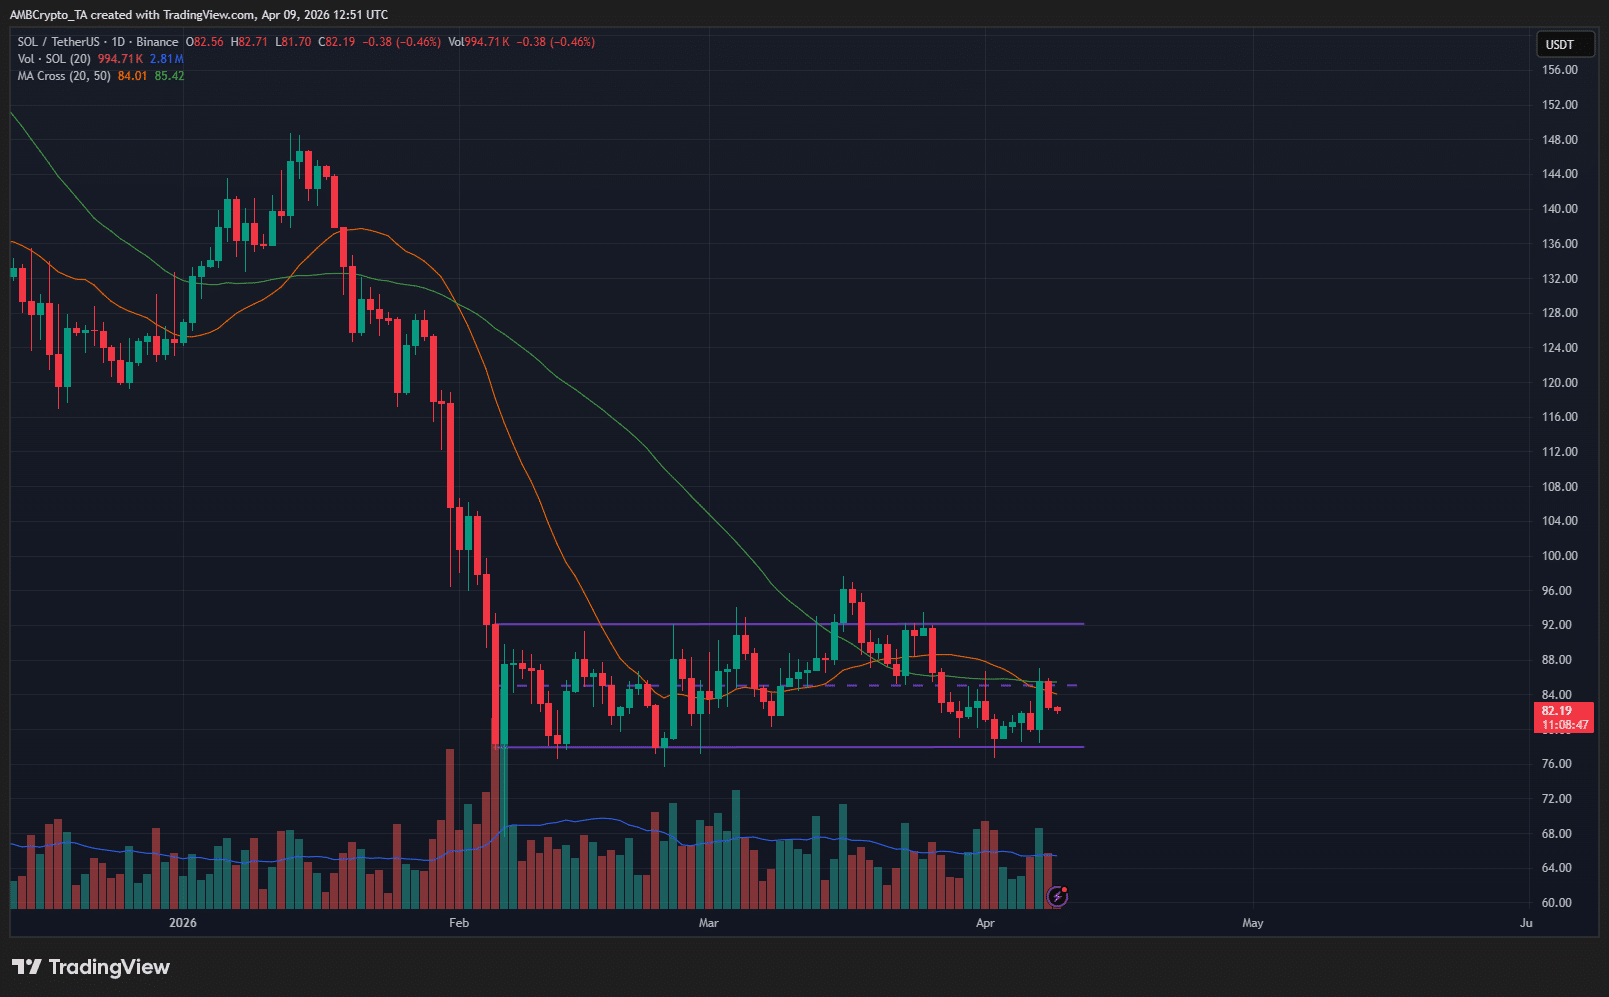
Solana [SOL] has been trading within a range, for the most part, since the early February crash. This range reached from $78 to $92 and also represented a volatile day of trading that saw SOL drop from $92 to $78 on the 5th of March.
Source: SOL/USDT on TradingView

The fact that the price action has mostly been contained within this 1-day candlestick since then indicates a consolidation underway. Yet, this consolidation can have a few surprises left for the bulls.

Here’s why the next major SOL sell-off could be brewing

In a post on X, crypto analyst Ali Martinez pointed out why the 50-day Moving Average (MA) is important to the long-term Solana price trends. The analyst noted a pattern in play since November 2025, where SOL prices appeared to reclaim the 50-day MA, but were unable to do so for more than a short while.

A consolidation period under the 50-day MA, which was at $85.43 as of writing, has been succeeded by a sell-off since November 2025. The current consolidation could turn into another such bearish rout. This puts the range formation on the 1-day chart from earlier into context. It might not be the market participants testing out the local lows and establishing key demand zones.

Instead, Solana prices might be coiling before another southward expansion. The longer SOL remains unable to reclaim the 50-day MA and stay above it, the more likely such a sell-off would be, based on the past few months of price action.

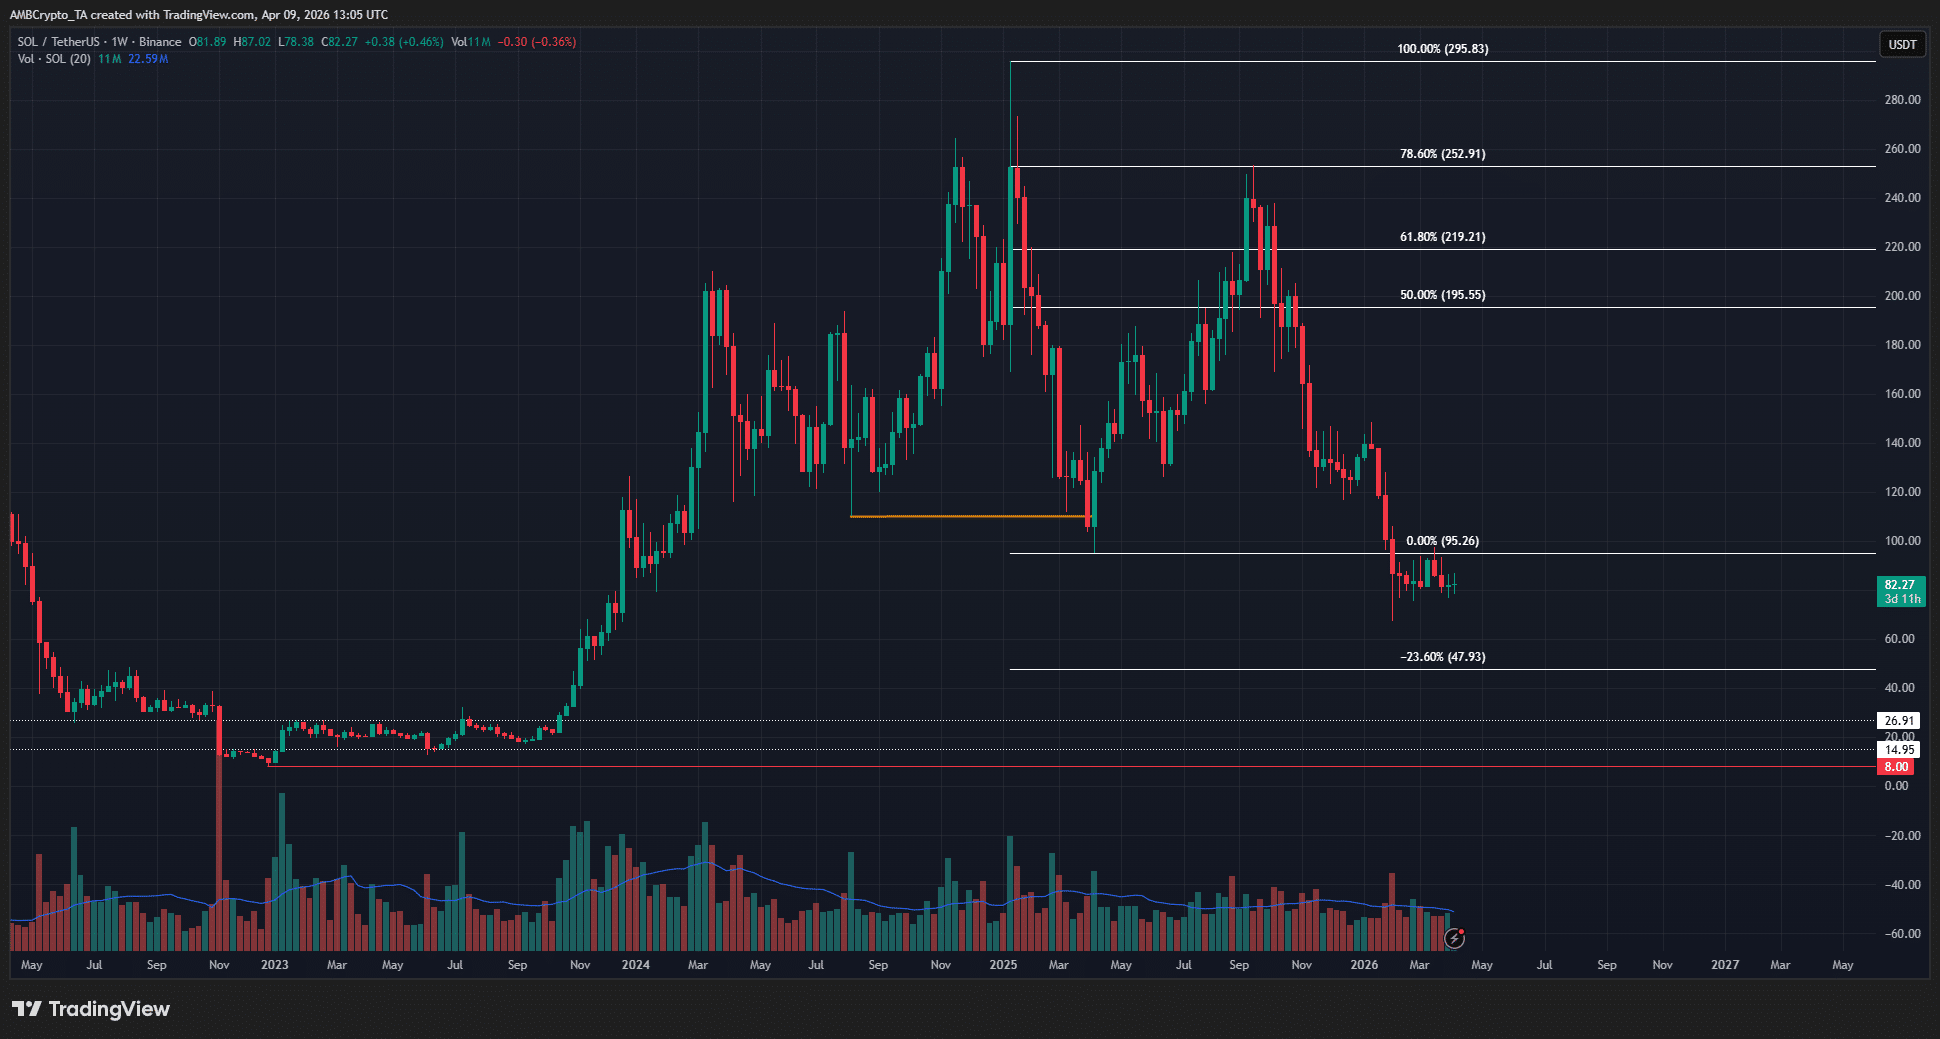
This also ties in well with the long-term Solana trend expectations. AMBCrypto had reported in February that the $47.9 level was the next projected long-term price target. This was based on the weekly structure.
Source: SOL/USDT on TradingView

The higher timeframe bearish bias remained firm. The retest of the 2025 lows at $95.26 as resistance in March and the subsequent rejection solidified the claim that SOL would fall below the $50 round number level later in 2026.


Final Summary

  • SOL reclaimed the 50-day moving average briefly before falling below this dynamic support once more.
  • This pattern has occurred for the third time since November 2025. The previous two occurrences were followed by consolidation and a strong sell-off.


Trending Cryptos

Related Questions

QWhat is the key price range for Solana (SOL) mentioned in the article?

AThe key price range for Solana is between $78 and $92.

QAccording to analyst Ali Martinez, what technical indicator is crucial for Solana's long-term price trend?

AThe 50-day Moving Average (MA) is the crucial technical indicator for Solana's long-term price trend.

QWhat pattern has been observed with SOL's price and the 50-day MA since November 2025?

ASince November 2025, SOL price has repeatedly reclaimed the 50-day MA only to fall back below it after a short period, a pattern followed by consolidation and a strong sell-off.

QWhat is the projected long-term price target for SOL based on the weekly structure?

AThe projected long-term price target for SOL is $47.9.

QWhat event in March solidified the bearish bias for Solana's higher timeframe?

AThe retest of the 2025 lows at $95.26 as resistance and the subsequent rejection in March solidified the higher timeframe bearish bias.

Related Reads

Why Bitcoin Holds Above $64,000 After Fed's Hard Pause

**Bitcoin Stabilizes Near $64,000 Following Hawkish Fed Pause** The cryptocurrency market, led by Bitcoin, remained stable around $64,000 despite a volatile reaction to the latest U.S. Federal Reserve meeting. The Fed paused interest rates but signaled a hawkish stance, with three committee members voting for an increase—the highest dissent since 2016. This limits risk appetite but hasn't triggered panic selling. Key market highlights include Bitcoin ETFs seeing a net inflow of $32.1 million, breaking a streak of outflows, while Ethereum ETFs experienced outflows of $18.65 million. Liquidations affected about 90,000 traders. Technically, Bitcoin finds support around $63,000-$63,500, with major resistance near $66,000. While its price is about 49% below its all-time high, institutional demand via ETFs and the absence of mass capitulation support a potential recovery scenario in the second half of the year. Major altcoins showed mixed movements, with Solana attracting capital while Ethereum faced selling pressure despite strong on-chain metrics like a growing staking queue. Regulatory news took a pause as the U.S. Senate delayed the CLARITY Act vote until at least autumn. For the final trading day of July, U.S. inflation and consumer spending data will be crucial. Bitcoin's key levels to watch are $63,000 support and $66,000 resistance. Sustained ETF inflows and Bitcoin holding above $63,000 are seen as positive signs for a potential market recovery later in the year.

cryptonews.ru2h ago

Why Bitcoin Holds Above $64,000 After Fed's Hard Pause

cryptonews.ru2h ago

Trading

Spot

Hot Articles

Discussions

Welcome to the HTX Community. Here, you can stay informed about the latest platform developments and gain access to professional market insights. Users' opinions on the price of SOL (SOL) are presented below.

活动图片