Smart Money Still Selling Ethereum? Futures CVD Shows $5.7B Bearish Pressure

bitcoinistPublished on 2026-03-14Last updated on 2026-03-14

Abstract

Ethereum is testing key resistance levels as the broader crypto market shows signs of stabilization. Despite a slight daily advantage for buyers in futures, with a positive Taker Delta of $7.15 million, the broader 90-day Smart Money CVD remains deeply negative at -$5.71 billion. This indicates sustained aggressive selling pressure has dominated over the past three months. However, analysts note that large buyers may be absorbing this selling through limit orders, potentially setting the stage for a future momentum shift if the pressure subsides.

Ethereum is currently testing key resistance levels as the broader cryptocurrency market attempts to recover from the recent period of volatility and downward pressure. After weeks of corrective price action, ETH has begun to stabilize, with buyers gradually pushing the asset higher as traders reassess market conditions and liquidity flows across digital assets.

While price action suggests the possibility of a short-term rebound, derivatives market data indicate that bigger structural changes may be unfolding beneath the surface. According to a recent analysis from CryptoQuant analyst Arab Chain, the ETH Binance Futures Smart Money CVD (90D) indicator is beginning to reflect notable shifts in the demand dynamics within Ethereum’s derivatives market on Binance.

The indicator tracks the cumulative difference between aggressive buy orders and aggressive sell orders executed through market orders in the futures market. Because these orders represent traders willing to immediately execute trades, the metric provides valuable insight into real-time demand pressure from more active market participants.

According to the latest data, aggressive buying volume in Ethereum futures on Binance recently reached approximately $4.583 billion, while aggressive selling volume totaled around $4.576 billion. As a result, the daily Taker Delta recorded a positive value of roughly $7.15 million, indicating a slight advantage for buyers during that session as the market attempted to regain momentum.

Smart Money CVD Still Reflects Dominant Selling Pressure

Despite the recent session showing a slight advantage for buyers, the broader structure of Ethereum’s derivatives market remains tilted toward selling pressure. According to the analysis, the 90-day rolling Smart Money CVD still registers a negative reading of approximately -$5.71 billion, indicating that aggressive selling activity has outweighed aggressive buying over the past three months.
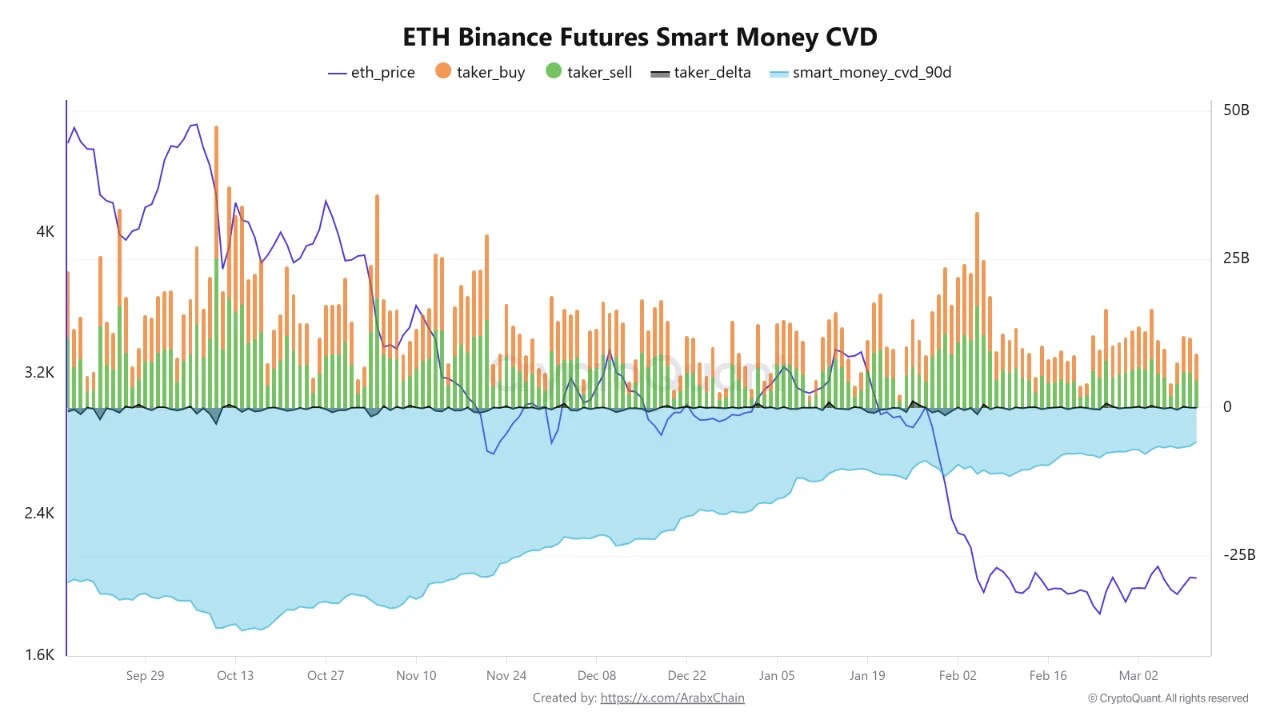
Ethereum Binance Futures Smart Money CVD | Source: CryptoQuant

In practical terms, this means that market participants using market orders have been more willing to sell Ethereum than to accumulate it during that period. Because the CVD tracks the cumulative difference between buy and sell orders executed directly in the market, sustained negative values typically reflect a market environment dominated by sellers closing positions or initiating short trades.

However, analysts note that negative CVD readings do not automatically translate into immediate downward price movement. Market dynamics can sometimes produce a different outcome through a mechanism known as liquidity absorption.

In such situations, large buyers place substantial limit orders in the order book, allowing them to absorb selling pressure without significantly pushing the price higher in the short term. This behavior can create a temporary equilibrium where aggressive sellers continue to hit bids while patient buyers gradually accumulate supply.

If this absorption process persists, it may eventually reduce sell-side pressure and lay the groundwork for a potential shift in market momentum.


Trending Cryptos

Related Questions

QWhat does the negative 90-day Smart Money CVD reading of -$5.71 billion indicate for Ethereum's derivatives market?

AIt indicates that aggressive selling activity has significantly outweighed aggressive buying over the past three months, reflecting a market environment dominated by sellers closing positions or initiating short trades.

QAccording to the article, what was the daily Taker Delta value and what does it signify?

AThe daily Taker Delta recorded a positive value of roughly $7.15 million, indicating a slight advantage for buyers during that specific trading session as the market attempted to regain momentum.

QHow does the Smart Money CVD indicator measure market activity on Binance?

AIt tracks the cumulative difference between aggressive buy orders and aggressive sell orders executed through market orders, providing insight into real-time demand pressure from active traders willing to immediately execute trades.

QWhat mechanism can allow for a negative CVD reading without causing an immediate price drop, as mentioned in the analysis?

ALiquidity absorption, where large buyers place substantial limit orders to absorb selling pressure without significantly pushing the price higher in the short term, creating a temporary equilibrium.

QWhat are the recent aggressive buying and selling volumes for Ethereum futures on Binance as cited in the article?

AAggressive buying volume was approximately $4.583 billion, while aggressive selling volume totaled around $4.576 billion.

Related Reads

Why Bitcoin Holds Above $64,000 After Fed's Hard Pause

**Bitcoin Stabilizes Near $64,000 Following Hawkish Fed Pause** The cryptocurrency market, led by Bitcoin, remained stable around $64,000 despite a volatile reaction to the latest U.S. Federal Reserve meeting. The Fed paused interest rates but signaled a hawkish stance, with three committee members voting for an increase—the highest dissent since 2016. This limits risk appetite but hasn't triggered panic selling. Key market highlights include Bitcoin ETFs seeing a net inflow of $32.1 million, breaking a streak of outflows, while Ethereum ETFs experienced outflows of $18.65 million. Liquidations affected about 90,000 traders. Technically, Bitcoin finds support around $63,000-$63,500, with major resistance near $66,000. While its price is about 49% below its all-time high, institutional demand via ETFs and the absence of mass capitulation support a potential recovery scenario in the second half of the year. Major altcoins showed mixed movements, with Solana attracting capital while Ethereum faced selling pressure despite strong on-chain metrics like a growing staking queue. Regulatory news took a pause as the U.S. Senate delayed the CLARITY Act vote until at least autumn. For the final trading day of July, U.S. inflation and consumer spending data will be crucial. Bitcoin's key levels to watch are $63,000 support and $66,000 resistance. Sustained ETF inflows and Bitcoin holding above $63,000 are seen as positive signs for a potential market recovery later in the year.

cryptonews.ru2h ago

Why Bitcoin Holds Above $64,000 After Fed's Hard Pause

cryptonews.ru2h ago

Trading

Spot

Hot Articles

Discussions

Welcome to the HTX Community. Here, you can stay informed about the latest platform developments and gain access to professional market insights. Users' opinions on the price of ETH (ETH) are presented below.

活动图片














