Shiba Inu At A Crossroads: Here’s How Top Traders Are Leaning On The Meme Coin

bitcoinistPublished on 2026-03-05Last updated on 2026-03-05

Abstract

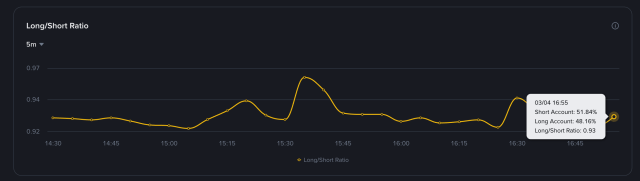
Shiba Inu is at a pivotal point, with top traders maintaining a net-long bias but showing signs of fading conviction. Derivatives data from Binance indicates a Long/Short Ratio (Positions) of 1.13, with 52.97% long positions versus 47.03% short. However, this ratio has been gradually declining, reflecting a cautious reduction in bullish exposure. Similarly, the Long/Short Ratio (Accounts) has decreased from above 1.30 to 1.09, signaling a steady cooling in sentiment. Buying activity is met with responsive selling, creating balanced volume dynamic and preventing either side from dominating. This suggests a market in a compression phase, lacking a clear catalyst, with traders prioritizing risk management over aggressive bets. While bulls still hold a structural edge, the narrowing bias and balanced activity indicate growing uncertainty. Shiba Inu remains at a crossroads, with professional traders positioned carefully rather than confidently, awaiting a decisive move.

Shiba Inu is approaching a pivotal moment, and the latest derivatives data suggests that while top traders still lean bullish on the meme coin, their conviction is steadily fading. Rather than signaling a strong directional move, current positioning reflects a market that is active but cautious.

Shiba Inu Positioning Reflects Controlled Optimism

On the 5-minute timeframe, data from Binance shows that the Top Trader Long/Short Ratio (Positions) recently stood at 1.13, with 52.97% of positions long and 47.03% short. This confirms that leading traders maintain a net-long bias. However, the margin remains relatively narrow. Earlier in the session, the ratio was closer to 1.18 before gradually trending lower, indicating that bullish exposure has been scaled back over time.

The broader Long/Short Ratio (Accounts) reinforces this pattern. The metric was near 1.09 at the same timestamp, reflecting 52.12% long accounts compared to 47.88% short. More importantly, this ratio has declined from levels above 1.30 earlier in the observed window among Shiba Inu traders. The downward slope is not dramatic, but it is consistent. That consistency signals a steady cooling in sentiment.
Source: Binance

In strongly trending markets, long/short ratios typically expand as traders crowd into the prevailing direction. Here, the opposite is happening. The imbalance between longs and shorts is compressing. Traders are not abandoning their bullish outlook entirely, but they are scaling back exposure. This suggests risk management is taking priority over aggressive positioning.

Such behavior often appears when the market lacks a clear catalyst. Participants remain involved, yet they hesitate to commit heavily without stronger confirmation from price action.

Balanced Volume Underscores A Market At Decision Point

Taker buy and sell volume data adds another layer of context. Buying activity has produced visible spikes, but these are frequently met with responsive selling. This balanced interaction prevents either side from establishing dominance. Instead of momentum building in one direction, liquidity remains evenly distributed.

Crucially, both positioning ratios for Shiba Inu remain above 1.0. Bulls still hold a structural edge. However, the gradual decline toward parity indicates that confidence is thinning. This is not a bearish reversal signal, but it does reflect growing uncertainty.

Markets often move from expansion to compression before a breakout. The current environment around Shiba Inu resembles that compression phase. Exposure is active but measured. Traders are participating, yet leverage concentration appears controlled.

Taken together, the data presents a coherent narrative. Shiba Inu is not experiencing aggressive accumulation, nor is it under heavy short-term pressure. Instead, it is trading in a state of restrained optimism. The narrowing long bias and balanced volume suggest a market preparing for its next decisive move.

Until a clear imbalance emerges, either through renewed long expansion or a shift below parity, this meme coin remains at a crossroads, with professional traders positioned carefully rather than confidently.

SHIB price begins to recover again | Source: SHIBUSDT on Tradingview.com

Trending Cryptos

Related Questions

QWhat does the current Top Trader Long/Short Ratio (Positions) for Shiba Inu indicate about market sentiment?

AThe current ratio of 1.13, with 52.97% long positions and 47.03% short, indicates that top traders maintain a net-long bias, but the narrow margin and its decline from earlier levels of 1.18 show that bullish conviction is steadily fading, reflecting a cautious and controlled optimism.

QHow has the Long/Short Ratio (Accounts) for Shiba Inu changed, and what does this trend signify?

AThe Long/Short Ratio (Accounts) has declined from levels above 1.30 earlier in the observed window to near 1.09, indicating a consistent and steady decline in bullish sentiment among traders, signaling a cooling off rather than a dramatic reversal.

QWhat does the behavior of the long/short ratios in a strongly trending market typically look like compared to the current Shiba Inu market?

AIn a strongly trending market, long/short ratios typically expand as traders crowd into the prevailing direction. In contrast, Shiba Inu's ratios are compressing, indicating that traders are scaling back exposure and prioritizing risk management over aggressive positioning due to a lack of a clear catalyst.

QWhat does the taker buy and sell volume data reveal about the current state of the Shiba Inu market?

AThe taker buy and sell volume data shows that buying activity produces visible spikes, but these are frequently met with responsive selling. This balanced interaction prevents either side from establishing dominance, resulting in evenly distributed liquidity and a market at a decision point.

QHow is the current Shiba Inu market environment characterized based on the overall data presented?

AThe data characterizes the Shiba Inu market as being in a state of restrained optimism and compression. It is not experiencing aggressive accumulation or heavy selling pressure, but is instead active yet measured, with traders carefully positioned and preparing for the next decisive move, leaving the meme coin at a crossroads.

Related Reads

Within Strategy's Framework, STRC's Dividend Yield Remains at 12% as Share Price Stays Below Par Value

Michael Saylor, Executive Chairman of Strategy (MSTR), confirmed that the dividend rate for its STRC perpetual preferred shares will remain at 12.00% through August 2026. The rate has increased from 9% at its July 2025 launch to the current high via a "ratchet" mechanism, which permanently raises the rate by 0.5% whenever the share price falls below $95. This mechanism is intended to push the price back toward its $100 par value and support Strategy's "at-the-market" (ATM) program for issuing new shares to fund Bitcoin purchases. However, the mechanism has not worked as intended. STRC shares closed at $89.46 on July 31, remaining about 10-11% below par value despite the record-high dividend. Competition from rival Strive's higher-yielding SATA securities has pressured demand. The persistent discount has forced Strategy to suspend new STRC issuances via its ATM program, limiting this funding channel for Bitcoin acquisitions. STRC's struggles reflect Bitcoin's own volatility, as the preferred shares historically move in tandem. Analysts have warned the ratchet structure carries long-term, one-way risk. A law firm is investigating Strategy's ability to maintain dividend payments if Bitcoin's price stays low. Retail investors own roughly 83% of outstanding STRC shares, a group seen as prone to panic selling during downturns. In response, Strategy has established financial reserves, including a liquidity cushion covering about 26 months of dividend/interest obligations, and a $2 billion share buyback program alongside a Bitcoin monetization framework, though the company emphasized it is not obligated to sell any Bitcoin.

cryptonews.ru30m ago

Within Strategy's Framework, STRC's Dividend Yield Remains at 12% as Share Price Stays Below Par Value

cryptonews.ru30m ago

Analyst: Bitcoin's Price Will Drop to $60k in August, Then Rebound to $70k

Financial analyst Andrey Poroshin has provided a new forecast for Bitcoin's price dynamics in August. Poroshin, an analyst at the Bitbanker exchange, expects the cryptocurrency market to experience a downturn this month, with prices retesting the $60,000 level due to a lack of supportive macroeconomic catalysts. He noted that the recent US Federal Reserve decision to hold interest rates did not significantly impact the market, while inflation remains above the 2% target. Poroshin stated that Bitcoin is ending July under pressure from moderate volatility and a lack of new macroeconomic stimuli, leading to continued market caution. According to his base scenario, Bitcoin will drop to a range of $60,000 to $62,000 before recovering to $70,000. He pointed out that even $70,000 remains below the cost of mining in the US, which has prompted some miners to shift towards AI data center operations. Poroshin cited the winding down of BitMEX's operations as a potential catalyst for a price rebound, suggesting the exit of weaker players often coincides with market reversals and reduced short-term selling pressure. He believes Bitcoin is currently less susceptible to geopolitical shocks, such as the Iran-US conflict, and does not expect significant market changes in August related to the pending CLARITY Act. Looking ahead, Poroshin forecasts that September will bring more active price fluctuations driven by potential Fed rate decisions and possible discussions or approval of the CLARITY Act.

cryptonews.ru31m ago

Analyst: Bitcoin's Price Will Drop to $60k in August, Then Rebound to $70k

cryptonews.ru31m ago

Trading

Spot

Hot Articles

Discussions

Welcome to the HTX Community. Here, you can stay informed about the latest platform developments and gain access to professional market insights. Users' opinions on the price of MEME (MEME) are presented below.

活动图片