Q2 2026 Bitcoin Valuation: Why $143,000 Remains Achievable?

marsbitPublished on 2026-04-24Last updated on 2026-04-24

Abstract

In Q2 2026, Bitcoin's valuation target of $143,000 remains achievable, representing a potential 2x upside from the current $70,500 price. Despite a 27% decline since Q1, the overall macro environment remains supportive. Global M2 liquidity hit a record $13.44 trillion, though Chinese-driven liquidity (over 60% of growth) has limited access to Bitcoin markets. U.S. monetary policy, a key driver, faced delays due to Iran conflict-induced oil price spikes, pushing March CPI to 3.3% and reducing Fed rate cut expectations. However, the easing direction persists. On-chain metrics show recovery from panic zones, with key resistance at $78,000 (long-term holder cost basis). Institutional flows turned positive, with Bitcoin ETFs seeing net inflows and corporate buying accelerating. Yet, network activity reveals stagnation—active addresses fell 13.2% YoY, suggesting superficial transaction growth. The revised $143K target (down from $185.5K in Q1) applies a -10% adjustment for weak fundamentals (BTCFi ecosystem contraction) and +20% for macro support. Key catalysts include breaking $78K, sustained ETF inflows, and geopolitical stability aiding Fed policy shifts.

Macro environment remains supportive, albeit at a slower pace: Global M2 hits a new all-time high of $13.44 trillion, Bitcoin ETF flows turn net positive for the first time in 14 months. However, the oil shock triggered by the Iran conflict pushed March CPI to 3.3%, narrowing the Fed's rate cut path.

Bitcoin on-chain metrics are shifting from undervalued to early equilibrium: Key on-chain indicators have moved out of the Q1 panic zone. The current price of $70.5K is about 13% below the long-term holder average cost basis of $78K. Breaking above this level would be a key signal for a short-term trend reversal.

The $143K target price and 2x upside potential remain valid: Based on a neutral baseline of $132.5K, adjusted by -10% for fundamentals and +20% for macro factors.

This is a downward revision from the Q1 target of $185.5K, but the significant spot price correction means the actual upside potential from the current price level has actually increased.

Macro Tailwinds Persist, but Momentum Has Slowed

Since the release of the Q1 report, Bitcoin has fallen approximately 27%, with the average price hovering around $70.5K in early April.

The Iran conflict introduced a new variable, but the overall macro environment remains favorable. What changed is not the direction, but the speed.

Liquidity at record highs, yet ineffective transmission to Bitcoin

As of February 2026, global M2 continued to expand to near a record high of $13.44 trillion. Yet Bitcoin is down 27% from Q1. Liquidity and price are moving inversely.

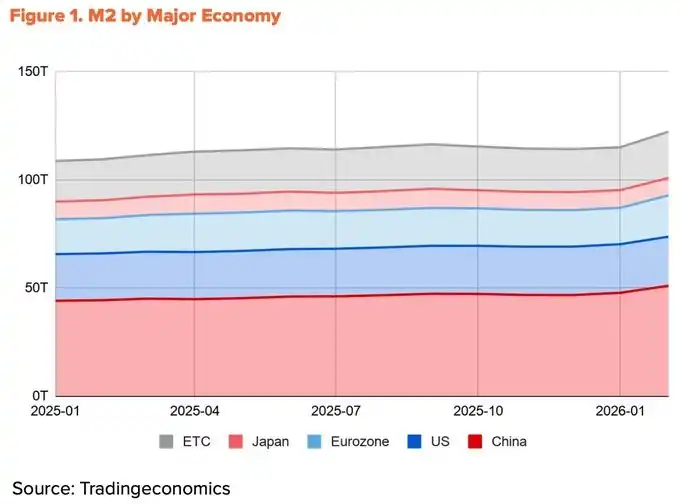
The source of this liquidity explains the divergence. Over the past year, over 60% of M2 growth from the four major economies (China, US, Eurozone, Japan) came from China, benefiting from the PBoC's RRR cuts and its formal shift to an easing stance in Q1.

The US contribution was only 10%. The problem is that channels for China-sourced liquidity to enter the Bitcoin market are limited.

Domestic crypto trading restrictions remain, and indirect channels via Hong Kong and Singapore primarily serve institutional capital. Global liquidity is at historic peaks, but the share that can actually reach the Bitcoin market is shrinking.

Iran Conflict Slows Fed Rate Cut Pace

With transmission of China-sourced liquidity blocked, USD liquidity remains the primary driver for Bitcoin. But even this part has been delayed by the Iran conflict.

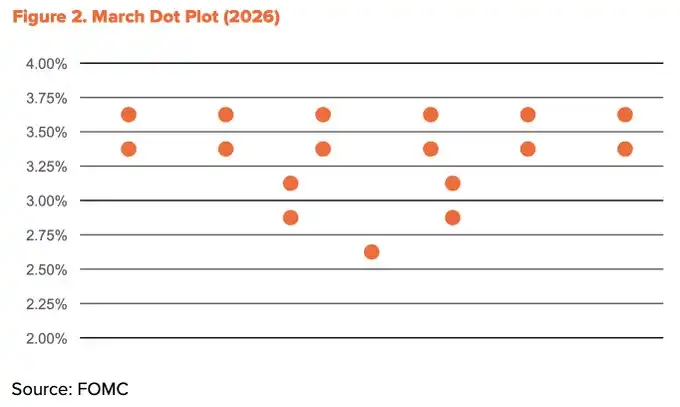
Following the US-Israel strike on Iran on February 28th, the Strait of Hormuz was blocked. Brent crude surged to $118/barrel by mid-March, and Dubai crude hit a record high of $166/barrel. This shock directly pushed inflation higher. US March CPI rose to 3.3% from 2.4% in February, a two-year high. The Fed's room for rate cuts subsequently narrowed. The March dot plot reduced 2026 rate cut expectations to just one.

Nevertheless, the direction of easing remains unchanged. By mid-April, the Strait of Hormuz partially reopened, and oil prices retreated significantly to around $90. Core CPI stabilized at 2.6%, indicating the shock hasn't broadly spread through the economy yet.

President Trump formally nominated Kevin Warsh as the next Fed Chair at the end of January, with Senate confirmation hearings ongoing. Powell's term ends May 15th, and an easing bias is highly likely to continue. The number of cuts may be reduced, but the direction remains.

Institutional flows begin to reverse

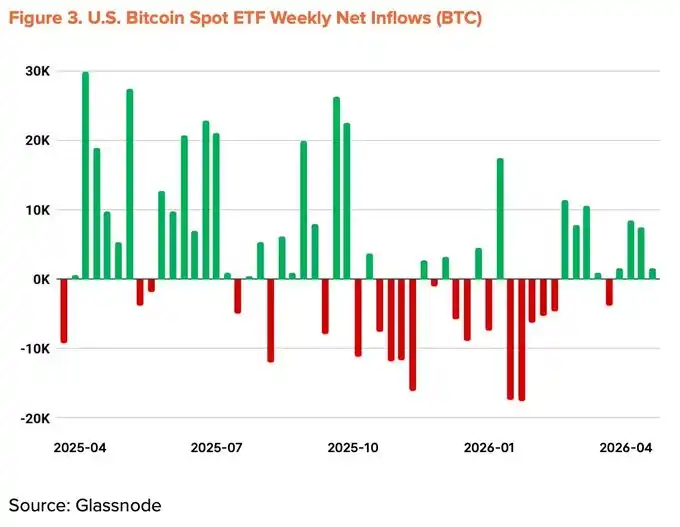
The institutional outflows that drove the Q1 decline have started to reverse. Bitcoin spot ETFs saw their worst monthly outflows since their November 2025 launch and were in net outflow for five consecutive months. However, since March, monthly net flows have turned positive. As of mid-April, year-to-date cumulative flows turned positive, with total AUM recovering to $96.5 billion.

Corporate accumulation is also accelerating. Strategy spent $2.54 billion buying 34,164 BTC in a single week (April 13-19), increasing its total holdings to 815,061 BTC. However, the number of companies participating in this trend has not increased significantly.

Macro indicator adjusted down to +20%

Structural tailwinds remain intact: liquidity expansion, policy easing bias, institutional flows back on track, and progress on the US CLARITY Act. Recent headwinds—the Iran-induced oil shock and slower Fed cuts—partly offset these positives. The Q2 macro indicator is adjusted down 5 percentage points from Q1 to +20%.

Shifting from Undervalued to Early Equilibrium

On-chain metrics have moved out of the extreme fear zone and are transitioning towards the border of undervaluation and equilibrium. Key metrics like MVRV-Z, NUPL, and aSOPR have exited the Q1 panic zone, entering an early recovery phase.

While a massive rally like those from panic zone rebounds is less probable, historical data shows that one-year average returns starting from this region consistently remain in double digits. The risk-reward ratio at this point remains in its most favorable position.

Notably, the average cost basis for Short-Term Holders (STH) is gradually declining.

This suggests speculative capital is exiting, while new buyers are accumulating at lower prices. The timing aligns with the restart of ETF net inflows and Strategy's large purchases, supporting the view that institutional investors are persistently accumulating at discounted prices, thereby pulling down the average entry cost.

A key risk level is $54K, the network's average cost basis. A break below this level would put the entire network in an unrealized loss state, forming a bottom in an extreme scenario. The strongest resistance is at $78K, coinciding with the long-term holder average cost basis.

The current price of $70.5K is about 13% below this resistance level, leaving a significant amount of recently entered short-term capital in unrealized loss. A decisive break above $78K in the short term is worth close attention.

Surface Growth, Underlying Stagnation

Bitcoin's average daily transaction count reached 564,000 in the first half of April, up 37.9% year-on-year. The surface data looks impressive, but the details tell another story.

Active addresses fell to 428,000 in the same period, down 13.2% YoY and 4.2% quarter-on-quarter. The average transaction size dropped to 1.19 BTC, down 34.1% from 1.80 BTC last quarter. Transaction count is rising, but both participants and value per transaction are falling.

This pattern reflects a small number of users repeatedly making small transfers, rather than broad economic utilization of the network. A significant portion of the transaction growth likely comes from mechanical flows like exchange deposits, unrelated to real growth.

The Q1 report maintained the fundamental indicator at 0%, based on expectations of BTCFi ecosystem expansion. Entering Q2, this thesis has clearly weakened.

According to The Block's "2026 Digital Asset Outlook," Bitcoin L2 TVL is down 74% year-to-date, and total BTCFi TVL has fallen 10%, representing only 0.46% of total Bitcoin supply (91,332 BTC). While individual protocols like Babylon and Lombard have seen growth, the overall ecosystem has contracted.

Fundamental indicator adjusted down to -10%

Surface growth has not translated into real network expansion, and the underlying data supporting the BTCFi thesis has weakened. The balance of offsetting positive and negative signals present in Q1 has been broken. The Q2 fundamental indicator is adjusted down from 0% to a baseline -10%.

Target Price $143K, Still 2x Upside Potential

Using the TVM method, the neutral baseline calculated from the early April 2026 average price is $132.5K. Applying the -10% fundamental and +20% macro adjustments yields a 12-month target price of $143K.

This figure is about 23% lower than the Q1 target of $185.5K. However, the actual upside potential has instead increased. Calculated from the average price, the upside expanded from +93% in Q1 to +103% in Q2.

The lower target price does not represent pessimism. The macro direction and on-chain structure still support a medium-to-long-term bull thesis.

Three short-term watch points:

· A decisive break above the network's mid-term equilibrium level of $78K;

· Sustained net inflows into ETFs;

· A Fed policy pivot following eased geopolitical risks.

If these three conditions materialize simultaneously, the $143K target remains achievable.

Related Questions

QWhat is the 12-month target price for Bitcoin as of Q2 2026, and what factors contribute to this valuation?

AThe 12-month target price for Bitcoin is $143,000. This is derived from a neutral baseline of $132,500, adjusted with a -10% for weakened fundamentals (like BTCFi ecosystem contraction) and a +20% for a supportive macro environment (including liquidity and policy trends).

QHow did the geopolitical conflict involving Iran impact the macroeconomic factors influencing Bitcoin's price?

AThe Iran conflict led to a blockade of the Strait of Hormuz, causing a spike in oil prices which pushed the March CPI to 3.3%. This narrowed the Fed's path for interest rate cuts, slowing down the primary driver of dollar liquidity for Bitcoin and delaying monetary easing.

QWhat key on-chain level is identified as the major resistance point for a short-term trend reversal, and why is it significant?

AThe major resistance level is $78,000, which represents the Long-Term Holder's average cost basis. A decisive break above this level is a key signal for a short-term trend reversal, as it would indicate that recent buyers are moving into profit and could spur further buying momentum.

QDespite a record high global M2, why has there been a divergence between liquidity and Bitcoin's price performance?

AThe divergence occurred because over 60% of the M2 growth came from China, where strict crypto trading restrictions limit the flow of that liquidity into the Bitcoin market. The US, a primary source of Bitcoin-driving dollar liquidity, contributed only 10% to the M2 growth.

QWhat is the critical risk level that could signal an extreme bottom for Bitcoin's price, according to the on-chain analysis?

AThe critical risk level is $54,000, which is the network-wide average cost basis. A break below this level would put the entire network into an unrealized loss position, potentially marking an extreme bottom in a worst-case scenario.

Related Reads

Near Returns to the AI Stage: Transformation into a Public Chain Due to 'Payroll Difficulties,' Agent and Privacy Emerge as New Growth Narratives

NEAR Returns to AI Origins: From Payroll Struggles to Blockchain, Now Focusing on AI Agents and Privacy NEAR Protocol's journey began not with grand blockchain ambitions, but from a practical hurdle: its AI startup founders, including Transformer paper co-author Illia Polosukhin, couldn't efficiently pay international developers in 2017. This led them to pivot and build a high-performance, scalable blockchain. After years navigating various crypto narratives like sharding and cross-chain interoperability, NEAR is now leveraging its AI roots to re-enter the AI arena. A key driver is its "NEAR Intents" layer, which abstracts complex cross-chain transactions. Users simply state their goal (e.g., swap BTC for ETH), and a solver network finds the optimal route. This system has processed over $20B in cross-chain volume, generating significant fee revenue. A major growth area is private transactions via "Confidential Intents/Swaps," which hide trade details until settlement to protect against MEV and front-running. Remarkably, private swaps recently accounted for over 40% of NEAR's transaction volume, highlighting strong demand but also potential regulatory scrutiny. With its AI-founder pedigree, NEAR is positioning itself at the intersection of blockchain, AI agents, and privacy, aiming to become infrastructure for the emerging agent economy while navigating the challenges of its rapid adoption.

marsbit1h ago

Near Returns to the AI Stage: Transformation into a Public Chain Due to 'Payroll Difficulties,' Agent and Privacy Emerge as New Growth Narratives

marsbit1h ago

From Ethereum to AI's 'CROPS': What Exactly is This Set of 'Slow Variables' That Vitalik Repeatedly Emphasizes?

In recent discussions, Vitalik Buterin has frequently emphasized the concept of "CROPS," a framework defining core values for Ethereum's development. CROPS stands for Censorship Resistance, Capture Resistance, Open Source, Privacy, and Security. Initially outlined in the Ethereum Foundation's "EF Mandate," it represents a commitment to user sovereignty, ensuring that the network resists external control, remains open, protects privacy, and prioritizes security. The relevance of CROPS extends beyond Ethereum's foundational principles, becoming crucial in the context of AI integration. As AI agents begin handling wallet operations and automated transactions, the risk increases that users may cede control over their digital assets, privacy, and intentions to centralized AI service providers. A "CROPS AI" would therefore emphasize local execution where possible, privacy-preserving remote model calls (e.g., using zero-knowledge proofs), and transparent, verifiable processes to maintain user agency. Vitalik highlights a significant convergence between "CROPS Ethereum access layer" and "CROPS AI." Both address the same fundamental challenge: how users can access powerful services—be it blockchain data via RPCs or AI models—without exposing sensitive information or relinquishing ultimate control. This intersection points toward a future digital entry point that is more private, secure, and user-controlled. Ultimately, CROPS is not merely an abstract ideal but a practical guidepost. It steers development—from protocol resilience and wallet design to AI agent safety—towards a future where users retain self-sovereignty even as digital systems grow more complex and powerful. In an era of accelerating AI adoption, these "slow variables" of censorship resistance, openness, privacy, and security may define Ethereum's enduring value.

marsbit1h ago

From Ethereum to AI's 'CROPS': What Exactly is This Set of 'Slow Variables' That Vitalik Repeatedly Emphasizes?

marsbit1h ago

Silicon Valley 'Startup Guru' Steve Hoffman: Web3 + AI Could Be a Trap

Silicon Valley investor and "Godfather of Startups" Steve Hoffman warns that combining Web3 with AI is likely a trap, not a promising venture. In an interview, Hoffman argues that while AI is a foundational technology touching all industries, Web3 adds complexity, friction, and regulatory risk without solving mainstream consumer or business needs. He advises founders to focus on deep, specialized applications where startups can out-iterate giants, rather than on generic features easily replicated by large tech companies. Hoffman observes that Silicon Valley will lead foundational AI research, while China excels at rapid, large-scale application and commercialization, particularly in robotics. He stresses that AI-driven autonomous agents capable of collaborative, multi-step tasks are 2-4 years away, which will cause significant job displacement. The solution is not to slow AI but to redesign business models around human-AI collaboration and reform social systems like education and retraining. For startups, Hoffman recommends focusing on vertical, expertise-heavy domains to build defensibility. He sees major opportunities in AI fraud detection and cybersecurity. Key founder mindsets include systemic thinking over feature-focus, relentless customer centricity, building adaptive teams, and deeply understanding AI's capabilities and limits. Hoffman is also leading a non-profit initiative to establish university centers aimed at training future leaders in responsible, human-value-aligned AI innovation.

marsbit3h ago

Silicon Valley 'Startup Guru' Steve Hoffman: Web3 + AI Could Be a Trap

marsbit3h ago

Token Inefficient, Economy Tokenless

The article "Tokens Aren't Economical, Economics Aren't Tokenized" analyzes a pivotal shift in the AI industry from a technology-driven narrative to one dominated by capital efficiency. It highlights two concurrent trends: a severe capital shortage due to the exorbitant and recurring costs of compute (e.g., OpenAI's high burn rate) and a wave of corporate spin-offs where major tech companies are separating their AI units (like Kuaishou's Kling and Baidu's Kunlunxin). The core argument is that AI's "anti-internet" business model, where user growth increases costs rather than profits, has created a disconnect between high valuations and actual cash flow. Spin-offs address this by allowing AI assets to be valued independently. Within a parent company, they are seen as cost centers, but as standalone entities, they are priced based on their growth potential and scarcity in the primary market, leading to massive valuation premiums (e.g., Kling's estimated value tripling post-spin-off). The industry is at an inflection point, moving from "model worship" to "value realization." The competition is evolving from a pure compute (GPU) race to a broader focus on systemic efficiency and full-stack engineering (involving CPUs and orchestration) to achieve viable commercialization. The year 2026 is framed as a critical moment where the industry must definitively answer how to economically translate AI capability into tangible business value, reshaping the sector's future power structure.

marsbit3h ago

Token Inefficient, Economy Tokenless

marsbit3h ago

Trading

Spot
Futures

Hot Articles

What is $BITCOIN

DIGITAL GOLD ($BITCOIN): A Comprehensive Analysis Introduction to DIGITAL GOLD ($BITCOIN) DIGITAL GOLD ($BITCOIN) is a blockchain-based project operating on the Solana network, which aims to combine the characteristics of traditional precious metals with the innovation of decentralized technologies. While it shares a name with Bitcoin, often referred to as “digital gold” due to its perception as a store of value, DIGITAL GOLD is a separate token designed to create a unique ecosystem within the Web3 landscape. Its goal is to position itself as a viable alternative digital asset, although specifics regarding its applications and functionalities are still developing. What is DIGITAL GOLD ($BITCOIN)? DIGITAL GOLD ($BITCOIN) is a cryptocurrency token explicitly designed for use on the Solana blockchain. In contrast to Bitcoin, which provides a widely recognized value storage role, this token appears to focus on broader applications and characteristics. Notable aspects include: Blockchain Infrastructure: The token is built on the Solana blockchain, known for its capacity to handle high-speed and low-cost transactions. Supply Dynamics: DIGITAL GOLD has a maximum supply capped at 100 quadrillion tokens (100P $BITCOIN), although details regarding its circulating supply are currently undisclosed. Utility: While precise functionalities are not explicitly outlined, there are indications that the token could be utilized for various applications, potentially involving decentralized applications (dApps) or asset tokenization strategies. Who is the Creator of DIGITAL GOLD ($BITCOIN)? At present, the identity of the creators and development team behind DIGITAL GOLD ($BITCOIN) remains unknown. This situation is typical among many innovative projects within the blockchain space, particularly those aligning with decentralized finance and meme coin phenomena. While such anonymity may foster a community-driven culture, it intensifies concerns about governance and accountability. Who are the Investors of DIGITAL GOLD ($BITCOIN)? The available information indicates that DIGITAL GOLD ($BITCOIN) does not have any known institutional backers or prominent venture capital investments. The project seems to operate on a peer-to-peer model focused on community support and adoption rather than traditional funding routes. Its activity and liquidity are primarily situated on decentralized exchanges (DEXs), such as PumpSwap, rather than established centralized trading platforms, further highlighting its grassroots approach. How DIGITAL GOLD ($BITCOIN) Works The operational mechanics of DIGITAL GOLD ($BITCOIN) can be elaborated on based on its blockchain design and network attributes: Consensus Mechanism: By leveraging Solana’s unique proof-of-history (PoH) combined with a proof-of-stake (PoS) model, the project ensures efficient transaction validation contributing to the network's high performance. Tokenomics: While specific deflationary mechanisms have not been extensively detailed, the vast maximum token supply implies that it may cater to microtransactions or niche use cases that are still to be defined. Interoperability: There exists the potential for integration with Solana’s broader ecosystem, including various decentralized finance (DeFi) platforms. However, the details regarding specific integrations remain unspecified. Timeline of Key Events Here is a timeline that highlights significant milestones concerning DIGITAL GOLD ($BITCOIN): 2023: The initial deployment of the token occurs on the Solana blockchain, marked by its contract address. 2024: DIGITAL GOLD gains visibility as it becomes available for trading on decentralized exchanges like PumpSwap, allowing users to trade it against SOL. 2025: The project witnesses sporadic trading activity and potential interest in community-led engagements, although no noteworthy partnerships or technical advancements have been documented as of yet. Critical Analysis Strengths Scalability: The underlying Solana infrastructure supports high transaction volumes, which could enhance the utility of $BITCOIN in various transaction scenarios. Accessibility: The potential low trading price per token could attract retail investors, facilitating wider participation due to fractional ownership opportunities. Risks Lack of Transparency: The absence of publicly known backers, developers, or an audit process may yield skepticism regarding the project's sustainability and trustworthiness. Market Volatility: The trading activity is heavily reliant on speculative behavior, which can result in significant price volatility and uncertainty for investors. Conclusion DIGITAL GOLD ($BITCOIN) emerges as an intriguing yet ambiguous project within the rapidly evolving Solana ecosystem. While it attempts to leverage the “digital gold” narrative, its departure from Bitcoin's established role as a store of value underscores the need for a clearer differentiation of its intended utility and governance structure. Future acceptance and adoption will likely depend on addressing the current opacity and defining its operational and economic strategies more explicitly. Note: This report encompasses synthesised information available as of October 2023, and developments may have transpired beyond the research period.

363 Total ViewsPublished 2025.05.13Updated 2025.05.13

What is $BITCOIN

Discussions

Welcome to the HTX Community. Here, you can stay informed about the latest platform developments and gain access to professional market insights. Users' opinions on the price of BTC (BTC) are presented below.

活动图片