Written by: Dami-Defi
Compiled by: AididaoJP, Foresight News
Original title: A Practical Guide to On-Chain Metrics for Traders
On-chain metrics are something everyone talks about, but few truly understand. This guide will explain their true meaning in a simple and clear way, and how traders should use them.
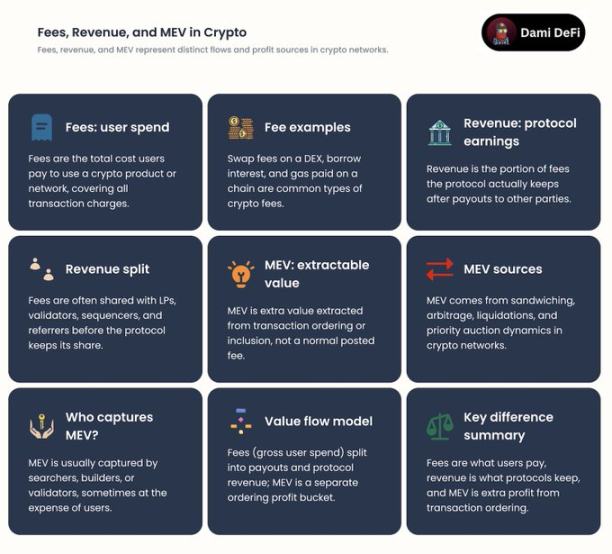
Fees vs. Revenue vs. MEV: The Real Earnings of a Chain
First, clarify a few concepts:
-
Fees: The cost users pay to conduct transactions.
-
Revenue: The portion ultimately kept by the protocol or validators.
MEV (Maximal Extractable Value): Additional profit validators gain by optimizing transaction ordering.
Key Point: High fees do not equal success. The real key is sustainable revenue. If users are driven away by $50 fees, this model is difficult to sustain.
Trader's Perspective:
Focus on public chains where real revenue is growing and the token model is reasonable. Models overly reliant on MEV are fragile; once trading volume declines or competition intensifies, prosperity can quickly fade.
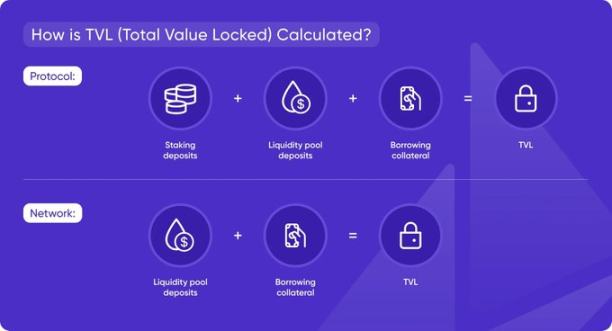
TVL: The Three "Lies" of Total Value Locked
Total Value Locked represents the total capital locked in a protocol or chain. It shows market trust but can also be very misleading.
The Three "Lies" of TVL:
-
Double Counting: The same capital is collateralized across different protocols, inflating the total.
-
Incentive-Driven TVL: "Mercenary capital" arrives for short-term incentives and leaves quickly once rewards end.
-
Idle Stablecoins: Large amounts of funds sit in wallets, counted in TVL but never used.
Trader's Perspective:
Never look at TVL alone; it must be analyzed alongside trading volume and incentive programs. Real usage is far more important than vanity metrics.
DAA / Daily Active Addresses: Real Users or Market Noise?
Daily Active Addresses count the number of addresses that have performed operations on the chain. It is often used as a proxy for real users but is also easily manipulated.
Common Issues:
-
Bulk operations by bots.
-
Airdrop farmers creating massive numbers of addresses.
-
Protocol internal transfers inflating data.
Key Point: DAA is meaningful only when it grows in sync with fees, trading volume, and real activity. If the number of addresses surges while revenue stagnates, it's likely a manufactured metric.
Trader's Perspective:
Treat DAA as a secondary confirmation signal, not a primary buy indicator. It only serves to validate growth when supported by other fundamentals.

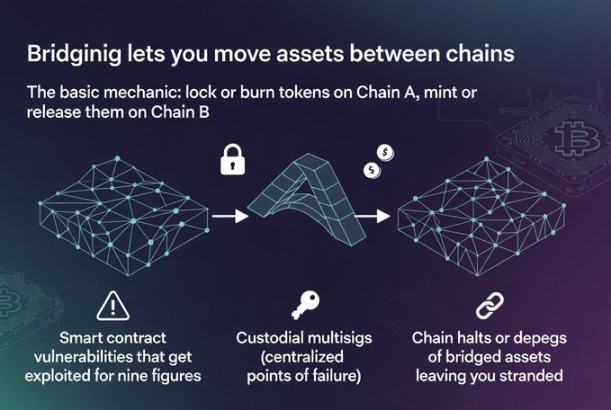
Cross-Chain Bridges: How Funds Move Across Chains and Where the Risks Lie
Cross-chain bridges enable the transfer of assets between different blockchains. The basic principle is: lock or burn tokens on Chain A, mint or release an equivalent amount on Chain B. The concept is simple, but the risks are complex.
Main Risks:
-
Smart Contract Vulnerabilities: Can lead to huge financial losses.
-
Custodial Multi-Sigs: Represent centralized points of failure.
-
Chain Outages or Asset De-pegging: Can result in assets being trapped.
Trader's Perspective:
Avoid storing large amounts of funds long-term on higher-risk cross-chain bridges. However, monitor the trading volume of bridges as a leading indicator of capital flow. For example, funds moving from Ethereum to an L2, or migrating between different ecosystems, signal changes that may present trading opportunities.
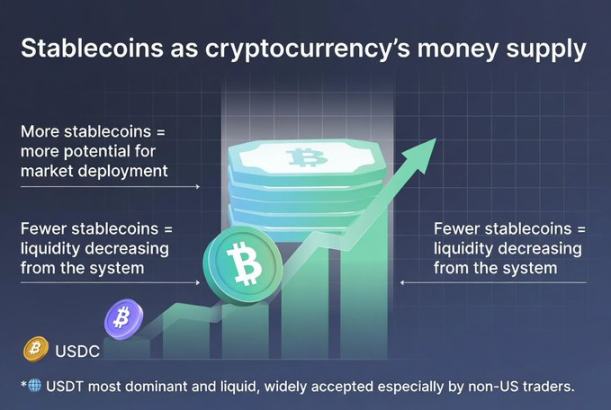
Stablecoins: The Money Supply of the Crypto World
Stablecoin supply is equivalent to the broad money supply (M2) of the crypto world.
-
Supply Increase: Means more "ammunition" waiting to enter the market.
-
Supply Decrease: Indicates liquidity is withdrawing.
Market Status:
USDT dominates due to its high liquidity and wide acceptance (especially favored by non-US traders). USDC is more transparent and compliant but has a slightly narrower usage.
Trader's Perspective:
A rising total stablecoin supply generally supports larger market trends; a shrinking supply means tightening liquidity, which can curb rallies. This is a crucial reference indicator for macro positioning.
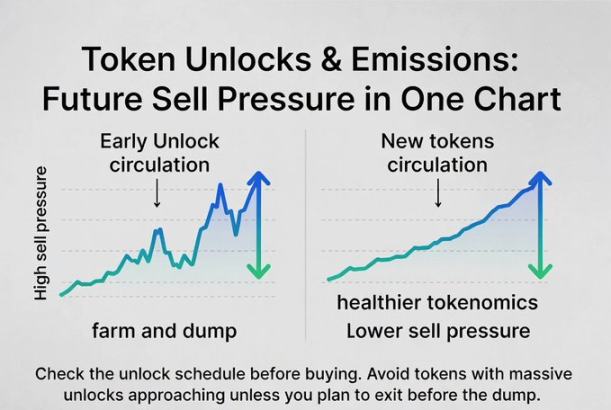
Token Unlocks & Emissions: Future Selling Pressure
Unlocks and emissions mean new tokens entering the circulating market. Large-scale unlocks are often accompanied by automatic selling: teams cashing out, VCs reducing holdings, reward releases causing a supply surge.
Simple Judgment:
-
Early, High Unlocks: Often indicate a "farm-and-dump" model.
-
Long-term, Gradual Unlocks + Real Demand: Typically represent healthier tokenomics.
Trader's Perspective:
Always check the unlock schedule before buying. Avoid tokens nearing large unlocks, unless you are trading short-term and plan to exit before the selling pressure hits.
On-Chain Volume vs. TVL: Is the Capital Active or Dormant?
-
TVL: How much capital is deposited.
-
Volume: How frequently the capital moves.
A pool with a TVL of $100 million but a daily volume of only $5,000 is essentially "dead capital".
Key Ratio: Volume / TVL Ratio.
-
High Ratio: Capital is active, usage is high.
-
Low Ratio: Could be "ghost liquidity" or idle funds.
Trader's Perspective:
Look for protocols with solid TVL and strong trading volume. You need real usage, not fake prosperity.
Summary
On-chain metrics are not magic, but they are the closest thing to "financial statements" in the crypto world. Use them as analytical tools, not absolute truths. Always cross-verify multiple signals and constantly think about the real meaning behind the data.
Twitter:https://twitter.com/BitpushNewsCN
Bitpush TG Discussion Group:https://t.me/BitPushCommunity
Bitpush TG Subscription: https://t.me/bitpush