Measuring Market Asymmetry: The Glassnode Skew Index

insights.glassnodePublished on 2025-12-11Last updated on 2025-12-11

Abstract

The Glassnode Skew Index is a new metric designed to measure market asymmetry by aggregating information across the entire volatility smile, rather than relying on the traditional 25-delta skew which only samples two points. It condenses the volatility curve into two components: DownVol (volatility from OTM puts, indicating downside protection and fear) and UpVol (volatility from OTM calls, reflecting bullish sentiment and upside speculation). The index is calculated as UpVol minus DownVol. Positive values suggest optimism and call buying dominance, while negative values indicate hedging and risk aversion. It helps identify sentiment regimes, confirm or contradict price movements, and analyze different tenors for layered market outlooks. Available for multiple assets and tenors, it provides a standardized, cross-exchange view of options market sentiment.

When assessing options markets, one of the most powerful signals is skew: how the market prices risk on the upside versus the downside. The standard approach for traders is to look at the 25-delta skew: a simple comparison between the implied volatility of a 25-delta call and a 25-delta put. This method is effective, simple and familiar, but it samples only two points on the volatility curve. As a result, it often misses structure embedded in the rest of the surface.

The Glassnode Skew Index addresses this by aggregating information across the full smile, producing a more robust signal of where risk is being priced. We explain the purpose of the new metric, how it is constructed, and how it can fit into the broader toolkit of options analysis.

To access the new metrics visit Glassnode Studio. Available to Professional plan users.

View metric

Introducing the Glassnode Skew Index

Instead of focusing on two isolated strikes, the Glassnode Skew Index condenses the entire shape of the volatility smile into a single, intuitive measure of market asymmetry.

We divide the curve into two regions: one representing downside risk, and one representing upside potential. Each region is transformed into a standardized volatility measure as we calculate how much volatility the market is pricing into that segment.

  • DownVol represents the total implied volatility from out-of-the-money put options — protection against falling prices. When traders rush to buy puts, DownVol rises, signalling fear or a desire to hedge.
  • UpVol captures the opposite: the total volatility priced into out-of-the-money call options. This reflects how much traders are willing to pay for upside exposure or potential short-squeeze gains. When call demand increases, UpVol rises, often alongside strong bullish sentiment.

The difference between these two components gives us the skew index: Glassnode Skew Index = UpVol - DownVol

  • Positive values indicate a market that’s paying more for upside volatility – typically driven by optimism, momentum, or speculative call buying.
  • Negative values mean downside protection dominates, as investors prioritize safety and hedging over chasing upside.

In practical terms, The Glassnode Skew Index shows whether option traders are more concerned about a crash down, or more excited about a breakout up – and by how much.
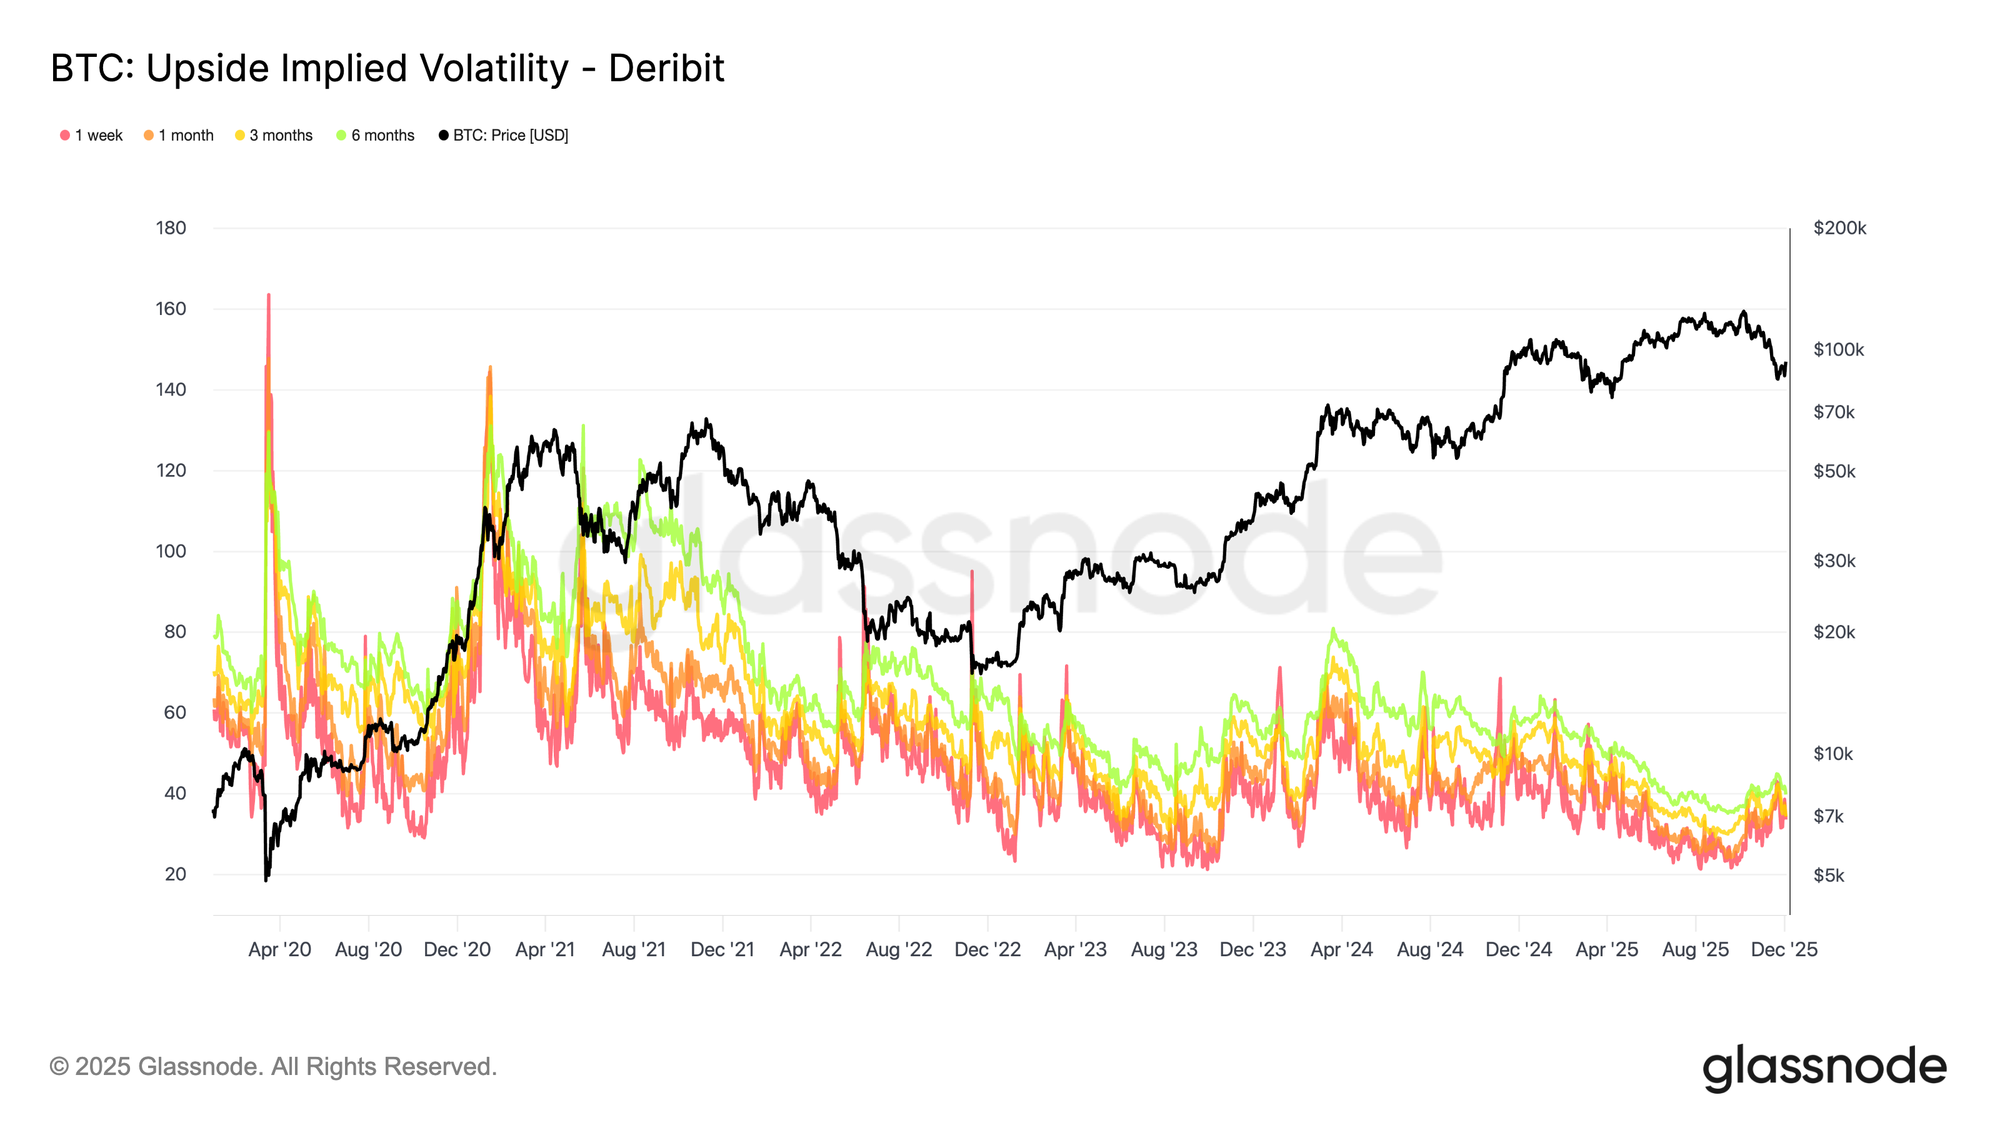
How to Use the Skew Index

The Skew Index can be applied in several ways to interpret options market positioning, identify sentiment regimes, and understand how traders are distributing risk across upside and downside scenarios.

Map the Current Sentiment Regime

The index can help contextualize prevailing market conditions:

  • Deeply negative values indicate a market that is paying a premium for downside protection, consistent with defensive positioning.
  • Strongly positive values indicate that investors are paying more for upside participation, often in the context of strong trends and speculative call activity.

Monitoring these extremes helps identify when fear or euphoria dominates the options market.

Use it as a Confirmation or Divergence Tool

The index can complement movements in spot price:

  • A rising Skew Index alongside a rising spot price suggests that the options market is reinforcing the move through increased demand for upside volatility.
  • A rally in spot with a Skew Index that stays sharply negative points to a distrusted move, where traders remain hedged and cautious.
  • A falling market with a heavily negative Skew Index confirms a classic risk-off environment with significant demand for protection.
  • A falling market with a positive Skew Index can indicate that traders are already looking through the weakness and positioning for a recovery.

This makes the index useful for evaluating whether options flows validate or contradict price action.

Interpreting Tenor Combinations

Different tenors can convey different layers of sentiment:

  • A negative 1-week skew with neutral or positive 3- and 6-month values often indicates temporary stress overlaying a constructive medium- and long-term outlook.
  • A very positive 1-week skew with subdued longer tenors suggests that traders are enthusiastic about the near-term, but reluctant to extend risk far into the future.
  • When skew is consistently elevated or depressed across all tenors, it points to a stable, regime-like sentiment environment rather than a short-lived spike.

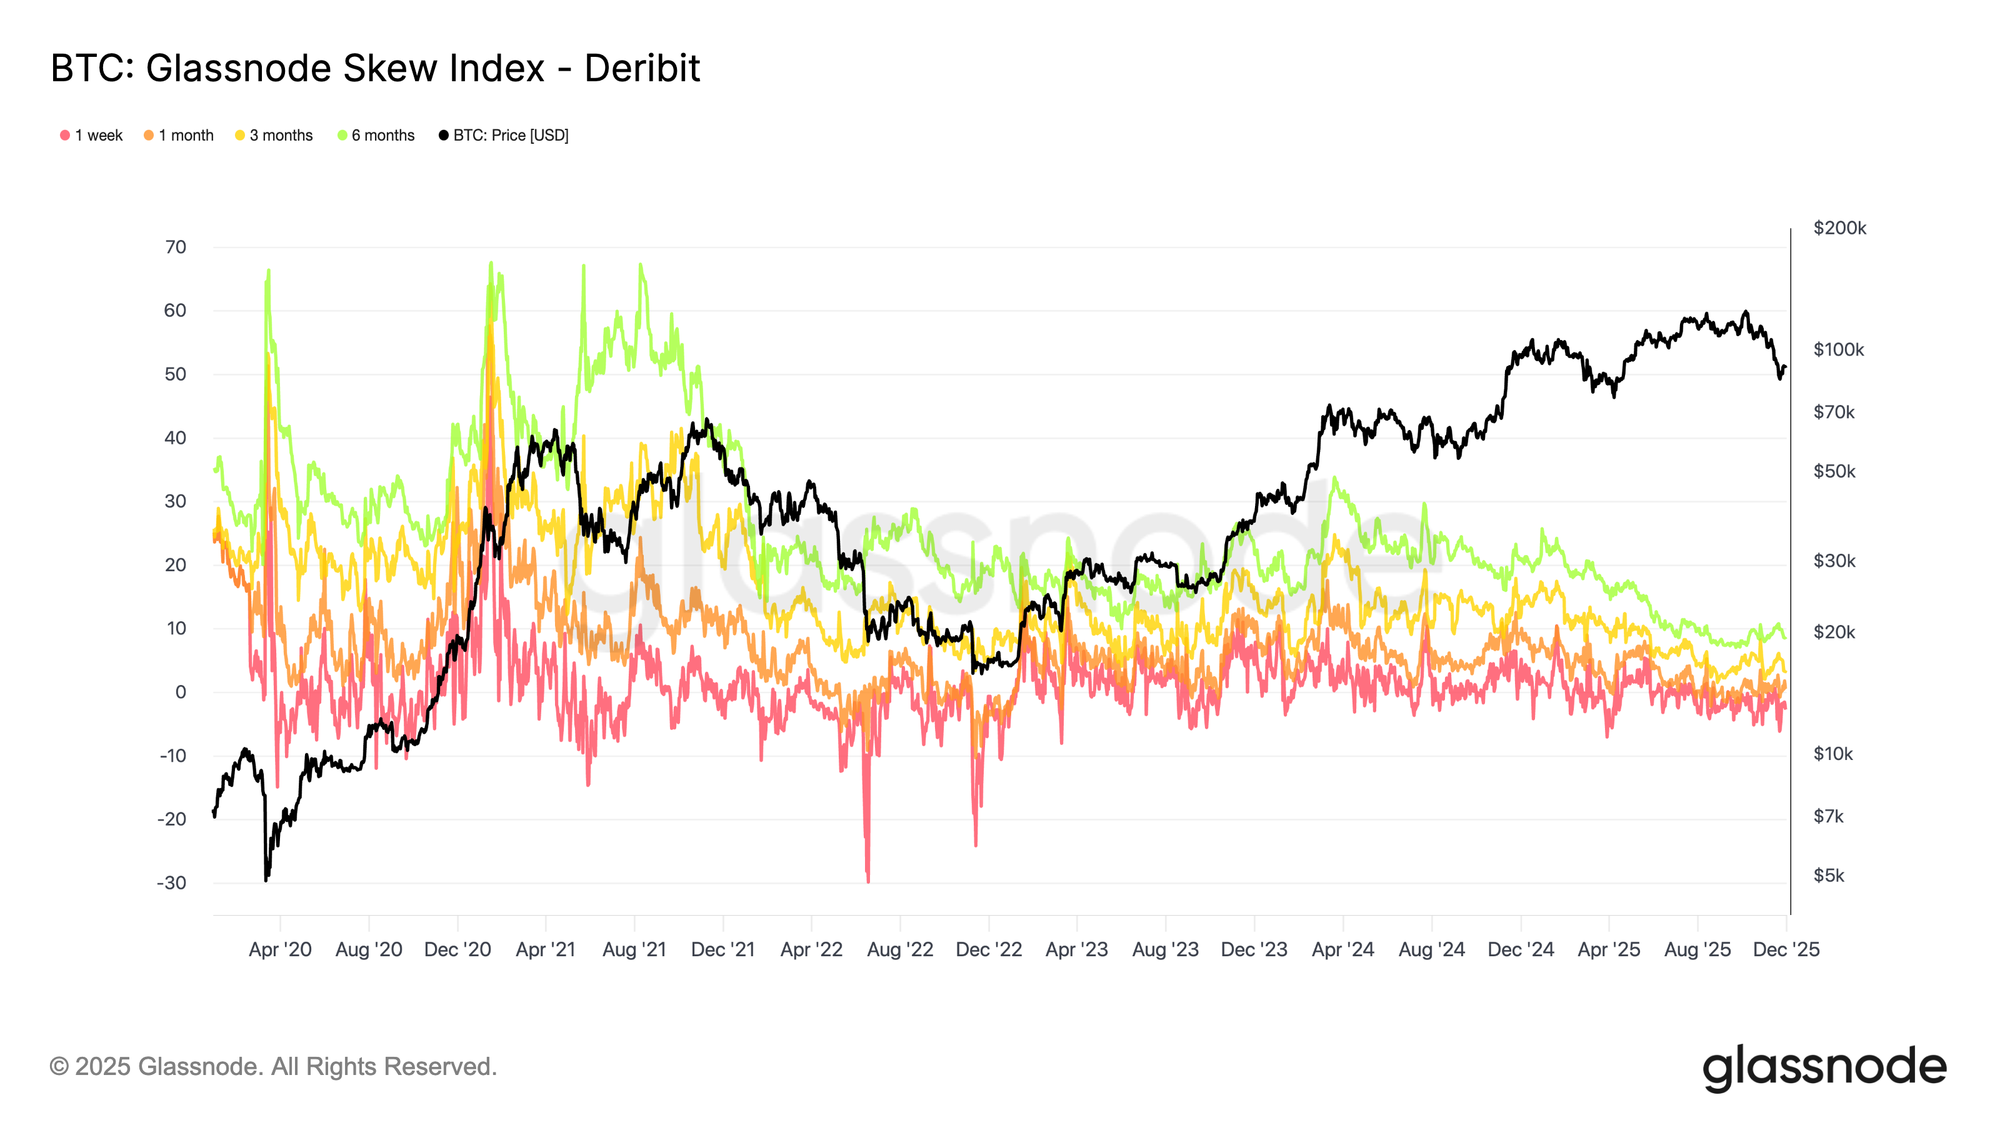
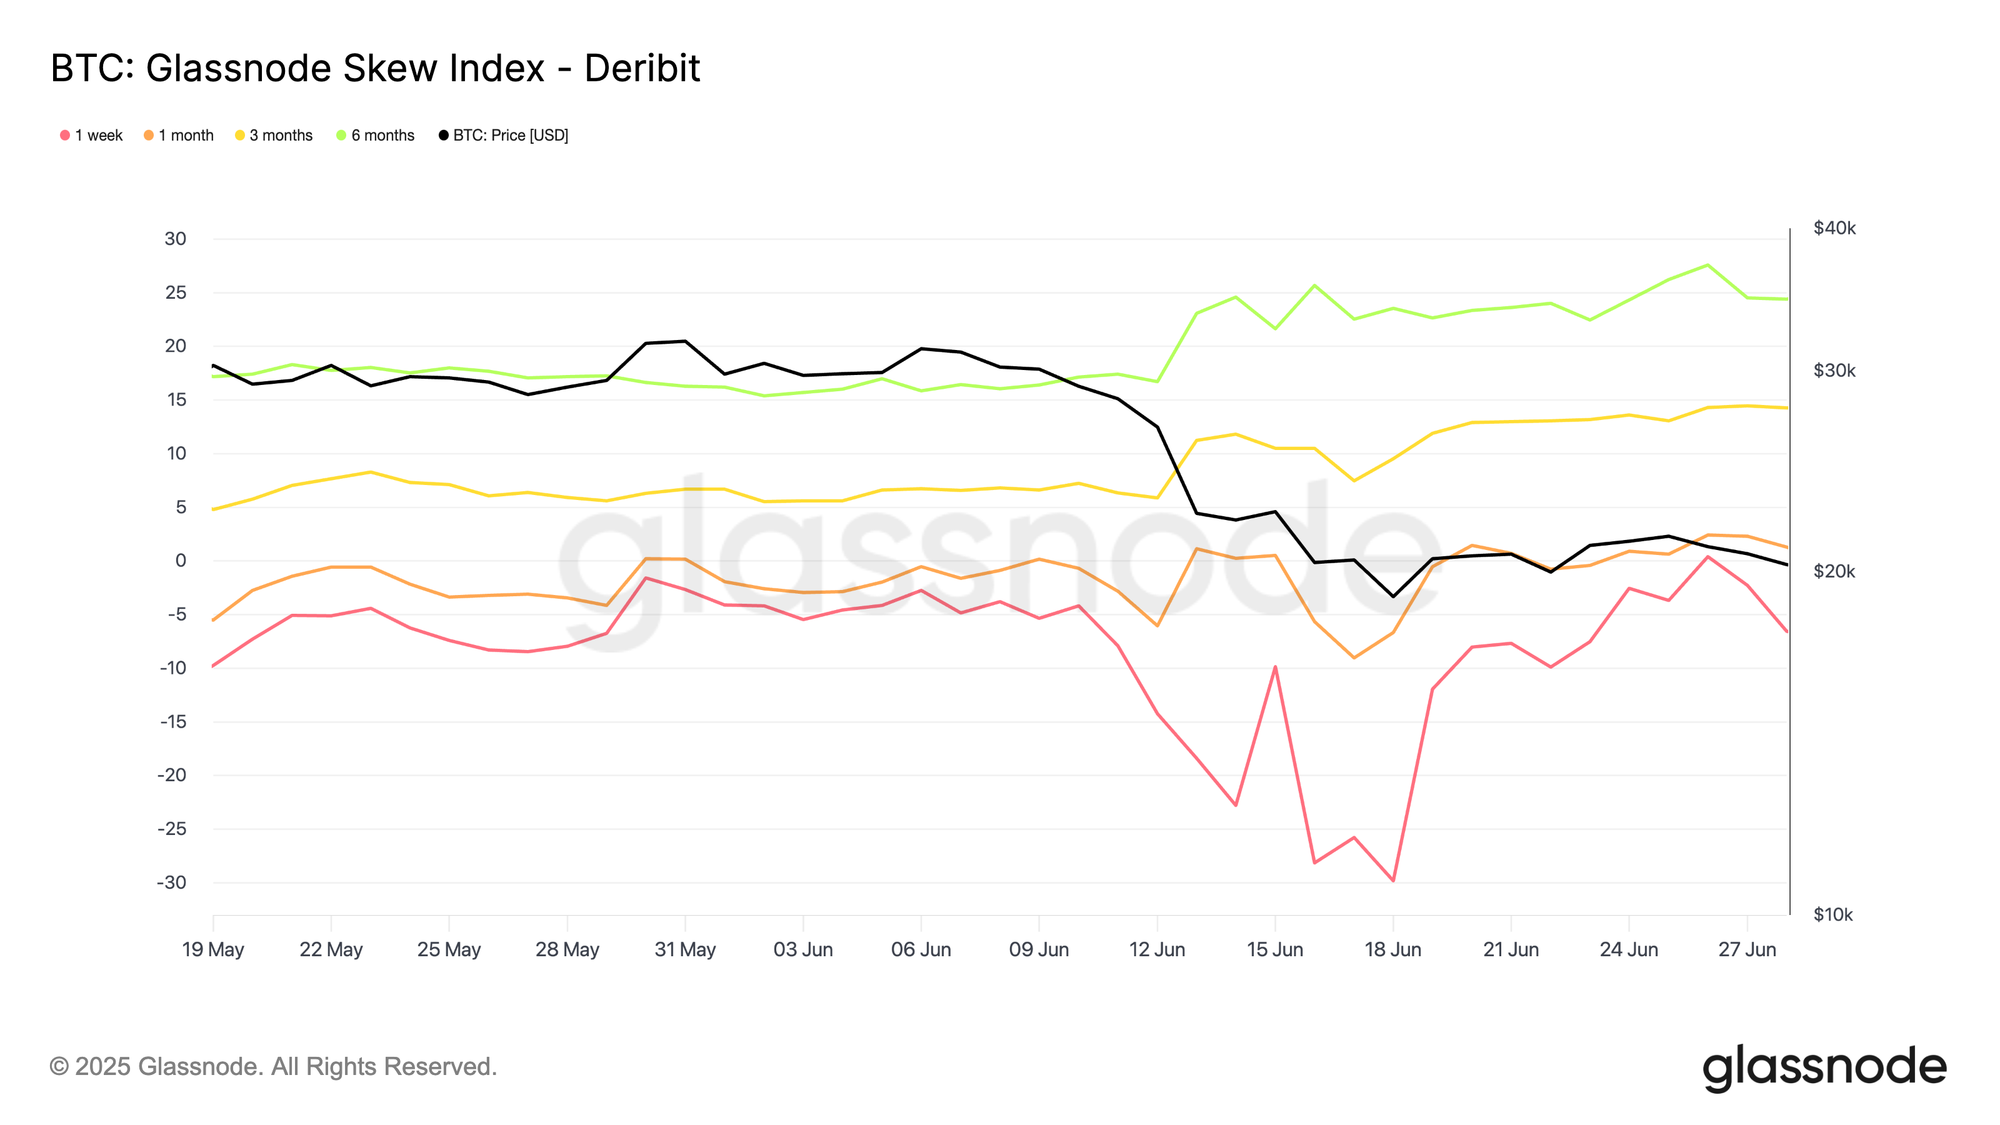
For example, in June 2022, we saw a clear tenor divergence: the 1-week Skew Index (red) plunged into deeply negative territory, signalling aggressive demand for short-dated puts over calls. Meanwhile, the 3-month (yellow) and 6-month (green) skews moved higher, indicating that investors were still willing to pay relatively more for upside exposure further out the curve.

In other words, the fear was mainly short-term, and longer-dated options continued to lean towards upside scenarios, implying that many participants expect better prices further out on the horizon.
How it works under the hood

We calculate the Glassnode Skew Index by aggregating option prices across many strikes on both sides of the distribution. These prices are transformed into standardized measures of upside and downside implied volatility, aligned to fixed maturities such as 1 week, 1 month, 3 months, and 6 months.

We then combine data across major venues so traders can compare BTC, ETH, SOL, XRP, or PAXG on consistent terms. This standardization removes the distortions that arise from strike irregularities, liquidity gaps, or exchange-specific conventions.

The result is a cross-asset, cross-tenor gauge of options market sentiment that captures the full structure of the volatility smile rather than relying on a single-point skew measure.

Available for:

  • Resolutions: 10 minutes, hourly, daily
  • Tenors: 1 week, 1 month, 3 months, 6 months
  • Assets: BTC, ETH, SOL, XRP, PAXG
  • Exchanges: Deribit, OKX

  • Follow us on X for timely market updates and analysis
  • Join our Telegram channel for regular market insights
  • For on-chain metrics, dashboards, and alerts, visit Glassnode Studio

Disclaimer: This report is for informational and educational purposes only. The analysis represents a limited case study with significant constraints and should not be interpreted as investment advice or definitive trading signals. Past performance patterns do not guarantee future results. Always conduct thorough due diligence and consider multiple factors before making investment decisions.


Trending Cryptos

Related Reads

Agent Race Ends, Super Workbench Takes Over

The era of fragmented AI agents is ending. Over the past month, China's tech giants—Tencent, Alibaba, and ByteDance—have simultaneously shifted strategy: instead of launching new, standalone AI agents, they are consolidating their various agent projects into unified "super workbenches." Tencent integrated its QClaw teams into WorkBuddy, a strategic product hailed as a potential third flagship after QQ and WeChat. Alibaba is merging its QoderWork, Wukong, and MuleRun agents into a new "Qianwen Office" platform under DingTalk's leadership. ByteDance rebranded its TRAE SOLO coding agent to TRAE Work, signaling a broader focus on workflow collaboration. This convergence marks a pivotal industry consensus. The initial exploration phase, where companies rapidly built numerous overlapping agents for different scenarios, proved costly and inefficient. With open-source tools eroding technical barriers, competition has shifted from agent creation to resource consolidation and cost control. Historically, platform wars are won not by creating more products, but by simplifying them—as seen with browsers unifying web access and super-apps consolidating services. Now, the "super workbench" aims to become the unified AI entry point for work. This reflects a deeper market realization: the primary audience for AI is no longer just programmers (a market in the tens of millions) but all knowledge workers (a market of billions). The real opportunity lies in augmenting everyday tasks—managing emails, documents, data, and meetings—across the entire workday. The core battleground is becoming control over the primary AI entry point that employees use daily. Tencent's WorkBuddy leverages WeChat and Tencent Docs; Alibaba's Qianwen Office taps into DingTalk's organizational data; ByteDance's TRAE Work integrates with Feishu's workflows. Whoever owns this "super workbench" gains strategic control over orchestrating enterprise data and APIs. This shift is redefining enterprise software. Traditional SaaS applications, valued for their user interfaces, will recede into the background. Their core functionalities will be exposed as standardized "Skills" or APIs for the super workbench's agents to invoke. Software value will shift from selling user seats to charging based on API calls and outcomes delivered. The evolution of agents is moving through clear stages: first as novel standalone products, then as consolidated primary work entry points, and finally as pervasive, invisible capabilities embedded into the digital fabric. The recent moves by major tech firms signal the transition from the first stage into the second, accelerating toward the third. In the end, the most successful agent technology may become invisible—like electricity or the HTTP protocol—a fundamental, unnamed infrastructure powering work itself.

marsbit15m ago

Agent Race Ends, Super Workbench Takes Over

marsbit15m ago

Michael Saylor: 110 Reasons to Oppose BIP-110

Michael Saylor presents 110 arguments against Bitcoin Improvement Proposal (BIP) 110, a soft fork aimed at restricting certain non-monetary data storage uses (like inscriptions) on the Bitcoin blockchain. He acknowledges the proponents' valid concerns—such as node costs, fee pressure, and preserving Bitcoin's monetary focus—but fundamentally disagrees with the proposed solution. Saylor argues that BIP 110 represents a dangerous precedent of using consensus rules to enforce value judgments on transaction validity, moving away from Bitcoin's core principles of neutrality and permissionless innovation. His key objections are organized into eleven categories: 1) It violates neutrality and hard consensus by banning currently valid transactions. 2) It fails to meet the high burden of proof required for a consensus change, lacking concrete data on the alleged crisis. 3) Its seven bundled technical restrictions are overly broad, targeting generic script functionalities and blocking future upgrade paths. 4) It sacrifices compatibility and future optionality by closing off designed upgrade hooks. 5) Its temporary rules add significant complexity (grandfathering, expiry states) without sufficient justification. 6) The economic and security impacts, particularly on miner revenue and fee markets, are uncertain and unmodeled. 7) Superior, market-based tools (fee markets, relay/mining policies) already exist to manage blockchain load. 8) It stifles innovation by creating a chilling effect for developers. 9) Its modified activation mechanism (55% threshold, forced signaling) is aggressive and risks network splits. 10) The precedent it sets—using consensus to suppress disliked but legal uses—is more dangerous than the problem it aims to solve. 11) A better path exists: improving measurements, refining resource-based policies, and allowing market forces to work. Saylor concludes that Bitcoin's strength lies in its neutral rules, open markets, and hard consensus. Changing these foundational elements to target specific use cases is an unnecessary and risky "iatrogenic" intervention. He advocates for guarding Bitcoin's neutrality rather than acting as its redeemer.

marsbit30m ago

Michael Saylor: 110 Reasons to Oppose BIP-110

marsbit30m ago

Trading

Spot

Hot Articles

How to Buy ONE

Welcome to HTX.com! We've made purchasing Harmony (ONE) simple and convenient. Follow our step-by-step guide to embark on your crypto journey.Step 1: Create Your HTX AccountUse your email or phone number to sign up for a free account on HTX. Experience a hassle-free registration journey and unlock all features.Get My AccountStep 2: Go to Buy Crypto and Choose Your Payment MethodCredit/Debit Card: Use your Visa or Mastercard to buy Harmony (ONE) instantly.Balance: Use funds from your HTX account balance to trade seamlessly.Third Parties: We've added popular payment methods such as Google Pay and Apple Pay to enhance convenience.P2P: Trade directly with other users on HTX.Over-the-Counter (OTC): We offer tailor-made services and competitive exchange rates for traders.Step 3: Store Your Harmony (ONE)After purchasing your Harmony (ONE), store it in your HTX account. Alternatively, you can send it elsewhere via blockchain transfer or use it to trade other cryptocurrencies.Step 4: Trade Harmony (ONE)Easily trade Harmony (ONE) on HTX's spot market. Simply access your account, select your trading pair, execute your trades, and monitor in real-time. We offer a user-friendly experience for both beginners and seasoned traders.

4.4k Total ViewsPublished 2024.03.29Updated 2026.06.02

How to Buy ONE

Discussions

Welcome to the HTX Community. Here, you can stay informed about the latest platform developments and gain access to professional market insights. Users' opinions on the price of ONE (ONE) are presented below.

活动图片