Market Expert Reveals Why Ethereum Is A Better Bet Than Solana

bitcoinistPublished on 2026-06-04Last updated on 2026-06-04

Abstract

A market analyst argues that Ethereum (ETH) is a better long-term investment than Solana (SOL) despite recent price declines for both. While acknowledging Ethereum's weak price structure, falling network fees, and Solana's rapid growth in application fees, the analyst highlights key bullish factors for ETH. These include Ethereum's dominant share of on-chain stablecoin value (approximately $161.8 billion, or 50.7% of the total) and growing institutional interest, exemplified by BlackRock's recent filing for ERC-20 products on the Ethereum blockchain. The analyst projects that if the stablecoin market grows to $3 trillion by 2030 as forecasted, and Ethereum maintains its significant market share, over $1.5 trillion in value could be anchored to its network. This potential, coupled with the prospect of institutional asset tokenization, supports bullish long-term scenarios for Ethereum's market cap, ranging from 400% to 2,400% growth by 2029.

A crypto market expert has shared reasons why believes that despite the ongoing bearishness in the market right now, Ethereum (ETH) is still a better investment than Solana (SOL). Over the past few months, Ethereum has been in a slump, with its price falling below key support levels and underperforming the broader market. Meanwhile, Solana has seen its fair share of declines, plummeting by over 10% this past week. Despite the weakness across both assets, the analyst still picks Ethereum over Solana, citing ETH’s bullish drivers beyond price action and market trends.

Why Ethereum Is A Better Investment Than Solana

Emperor Osmo, a market analyst on X has presented a compelling case for why Ethereum remains a stronger bet than Solana despite ETH crashing more than 9.5% in the past week to trade near $1,870 at the time of writing. The analyst said he understands why many market participants and investors have turned bearish on the ETH price, pointing to weak price structure and declining network fees.

Osmo noted that Ethereum’s fee revenue has fallen sharply, while Solana continues to close the gap. According to him, Solana has generated about $3.859 billion in annual app fees compared to Ethereum’s $3.868 billion. The difference now stands at only $9 million after years of ETH maintaining a dominant lead.

The analyst also highlighted that Solana’s app fees are growing by roughly 9.5% per month, while ETH;s are declining by about 6.4%. Despite these trends, the analyst believes one key metric continues to support Ethereum’s long term bullish outlook. He revealed that the second largest cryptocurrency is currently sitting on about $161.8 billion in stablecoins, representing roughly 50.7% of all stablecoin value onchain.

Osmo also pointed to growing institutional interest in Ethereum’s ecosystem. He noted that BlackRock, the world’s largest asset manager, recently filed permissioned ERC-20 treasury products on Ethereum, picking the ETH blockchain above all others.

In addition, the analyst referenced projections from the U.S. Treasury Secretary, Scott Bessent, that the stablecoin market could eventually grow to $3 trillion by 2030. Based on those figures, Osmo argued that if Ethereum maintains its substantial stablecoin market share, more than $1.5 trillion in value could eventually be anchored to the network.

As a result, he believes that even if ETH’s current price reflects concerns around slowing fees and weak market structure, it does not represent its potential value backed by stablecoin growth and long term network retention.

Analyst Outlines Bull, Base, And Bear Case Scenarios For ETH

In an accompanying chart, Osmo mapped out bull, base, and bear case scenarios for Ethereum if it captures a significant slice of institutional stablecoin AUM. The analyst frames ETH’s potential upside against a projected $3 trillion stablecoin market, with retention hinging on whether the blockchain can ship what institutions need.

Source: Token Terminal

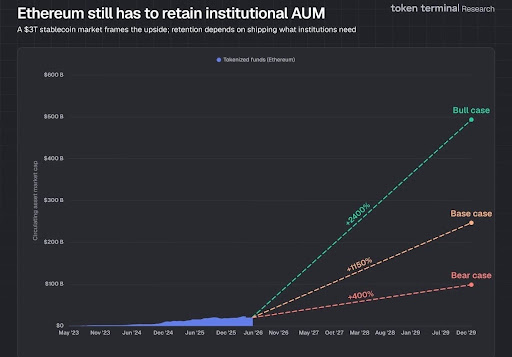
His bull case projects tokenized funds driving a 2,400% surge in ETH’s circulating asset market cap by December 2029. The base case puts that figure at 1,150%, while even the bear case holds upside at 400%.

ETH bears pull price below $2,000 | Source: ETHUSDT on Tradingview.com

Related Questions

QAccording to the analyst Emperor Osmo, what is the main reason Ethereum is considered a better investment than Solana despite its recent price slump?

AThe analyst believes Ethereum's long-term bullish outlook is supported by its massive stablecoin holdings, which represent about 50.7% of all onchain stablecoin value, and growing institutional interest, such as BlackRock filing ERC-20 treasury products on Ethereum.

QWhat key metric does Emperor Osmo highlight where Solana is closing the gap with Ethereum?

AEmperor Osmo highlights that Solana is closing the gap in annual app fee revenue. Currently, the difference is only $9 million, with Solana generating about $3.859 billion compared to Ethereum's $3.868 billion.

QWhat are the projected growth trends for app fees on Ethereum and Solana according to the article?

AAccording to the article, Solana's app fees are growing by roughly 9.5% per month, while Ethereum's app fees are declining by about 6.4% per month.

QWhat potential future market size for stablecoins does the analyst reference, and what implication does this have for Ethereum?

AThe analyst references a projection from U.S. Treasury Secretary Scott Bessent that the stablecoin market could grow to $3 trillion by 2030. If Ethereum maintains its substantial market share, more than $1.5 trillion in value could be anchored to its network.

QWhat are the three scenarios (bull, base, bear) outlined by the analyst for Ethereum's potential market cap growth by December 2029?

AThe analyst's scenarios for Ethereum's circulating asset market cap growth by December 2029 are: a bull case projecting a 2,400% surge, a base case projecting a 1,150% surge, and a bear case projecting a 400% surge.

Related Reads

GitHub, Transfixed by AI

On the night of February 9th, GitHub suffered a major outage caused by a simple configuration change—reducing a cache refresh interval from 12 to 2 hours—that triggered a cascade of failures. This was not an isolated event, but part of a broader pattern. In early 2026, GitHub experienced at least 8 major incidents, failing to meet its promised 99.9% availability. These outages stemmed from structural issues: explosive growth in load, tight service coupling, and insufficient protection against abnormal traffic. This unprecedented load is driven by AI Agents. In 2025, GitHub handled ~1 billion commits. By 2026, weekly commits reached 275 million, projecting to ~14 billion for the year—a 14x increase. AI tools like Claude Code now contribute 4.5% of all public repository commits, with weekly submissions surging 25x in just three months. AI-generated pull requests jumped from 4 million to 17 million per month in half a year. Unlike human developers, AI Agents work continuously, generating commits at a scale that overwhelms infrastructure designed for human rhythms. The surge also shattered GitHub's business model. Copilot's flat-rate pricing, based on assisting human developers, became unsustainable as Agentic AI sessions consumed resources worth hundreds of dollars for a few dollars in fees. In response, GitHub imposed usage limits and, by June 1st, shifted to a pay-per-use "AI Credits" system. Facing this new reality, GitHub realized a 10x scaling plan was insufficient. It announced a need to *redesign* its architecture for 30x current scale—decoupling services, adding fault isolation, and improving change management to prevent cascading failures. Other platforms like Stripe and AWS are facing similar challenges with AI Agents. Fundamentally, GitHub is transitioning from a human collaboration platform to an "exhaust pipe" for automated AI workflows. Its detailed post-mortem reports aim to maintain trust during this turbulent rebuild. The February outage was not just a technical glitch, but a signal of the software industry's entry into a new, AI-driven era.

marsbit14m ago

GitHub, Transfixed by AI

marsbit14m ago

Both Suffer Massive Losses Exceeding $90 Billion, Which Is in Greater Peril: Strategy or Bitmine?

Facing massive paper losses exceeding $90 billion each amidst a sharp market downturn, "Digital Asset Treasury" (DAT) giants Strategy and Bitmine find themselves in a precarious position, but with different underlying risks. Strategy, heavily invested in Bitcoin (BTC), faces significant financial strain. Its strategy relies heavily on debt, including convertible notes and preferred stock (STRC) requiring substantial dividend payments. With its cash reserves dwindling and BTC offering no staking yield for cash flow, Strategy's high leverage makes it vulnerable. A continued price decline could force asset sales to meet obligations, potentially creating a negative feedback loop. Its market value has already fallen sharply. In contrast, Bitmine, an Ethereum (ETH) holder, appears on firmer financial ground. It primarily funds its purchases through equity offerings (like ATM programs), avoiding debt pressure. It also generates income by staking a large portion of its ETH holdings. While not immune to market drops and shareholder dilution concerns, Bitmine maintains more flexibility, recently announcing a new preferred share offering to raise further capital. The core divergence lies in their financing: Bitmine uses equity (investor money), while Strategy uses debt (borrowed money). Consequently, Bitmine currently faces less immediate liquidity pressure than Strategy, which must navigate the dual challenge of servicing debt/dividends and a declining core asset (BTC) price.

marsbit21m ago

Both Suffer Massive Losses Exceeding $90 Billion, Which Is in Greater Peril: Strategy or Bitmine?

marsbit21m ago

Where the AI Bubble Really Is: Which Layer of Players Are Naked

AI Bubble: Where It Really Is and Who's Swimming Naked This analysis dissects the AI industry not as a single entity but as a five-layer pyramid, arguing that bubbles are concentrated in specific tiers, not uniformly distributed. **Key Distinction from the 2000 Dot-com Bubble:** Unlike 2000, where companies had stock prices before revenue, today's leading AI players have massive, contract-backed revenue driving their valuations. Core infrastructure demand is real, with every GPU running at full capacity for paying customers. **The Five-Layer Pyramid & Bubble Assessment:** * **L0 (Fab/Manufacturing) & Top L4 (Leading AI Apps): NO BUBBLE.** Companies like TSMC, NVIDIA, major cloud providers (Microsoft, Google, Meta, Amazon), and top AI labs have real revenues and orders. Supply is tightly constrained by TSMC's disciplined capacity control and physical limits like power/land for data centers, preventing a supply glut. * **L1 (Memory): BATTLEGROUND.** Sky-high HBM margins could signal a new structural cycle or a classic "boom before bust." The oligopoly of three major players may enforce supply discipline, making this a high-stakes bet. * **L2 (Interconnect/Optical Modules): BUBBLE TERRITORY.** Companies like Lumentum and AAOI have seen stock surges (4-10x) far outpacing revenue growth. This hardware segment has lower physical barriers to expansion than fabs, allowing speculation. It mirrors the 2000 bubble's epicenter—optics. * **L3 (Infrastructure/"GPU Landlords"): VULNERABLE.** GPU leasing companies profit from the current compute shortage but own no long-term moat. Their business model relies on a temporary bottleneck that will ease as big tech expands and new tech (e.g., potential space-based data centers) emerges. * **L4 Long Tail (VC-backed Startups): STRONG BUBBLE SIGNALS.** VC funding concentration in AI is twice that of the 1999 peak. Many startups with little revenue use the valuation logic of successful giants to justify their own, creating high risk of a "valuation crunch" when funding dries up. **Critical Risks to Monitor:** 1. **GPU Depreciation & Accounting:** Companies extending the assumed useful life of GPUs artificially boost profits. The true economic life depends on future generational leaps from NVIDIA. 2. **"GPU Credit" & Off-Balance-Sheet Leverage:** Emerging structures where shell companies borrow to buy GPUs and lease them out (with chipmakers sometimes investing) move debt off major balance sheets. This echoes the "vendor financing" of 2000 and the securitization risks of 2008, though currently small-scale. 3. **TSMC Abandoning Caution:** If the primary supply bottleneck (TSMC's conservative capacity planning) breaks, runaway supply could trigger a bust. 4. **Algorithmic Efficiency Breakthrough:** A major leap in software efficiency could drastically reduce the need for raw compute hardware, undermining the investment thesis. **Conclusion:** The AI boom is expensive and has frothy areas, but its core is underpinned by real demand and physical supply constraints. The bubble risk is layered: most present in optical components, GPU leasing, and the long-tail startup ecosystem, while the foundational chip manufacturing and leading application layers remain relatively solid—for now.

marsbit34m ago

Where the AI Bubble Really Is: Which Layer of Players Are Naked

marsbit34m ago

Trading

Spot
Futures

Hot Articles

Discussions

Welcome to the HTX Community. Here, you can stay informed about the latest platform developments and gain access to professional market insights. Users' opinions on the price of ETH (ETH) are presented below.

活动图片