Gate Institutional Weekly Report: BTC Funding Rate Turns Positive, CEX TradFi Trading Volume Soars (March 23–29, 2026)

marsbitPublished on 2026-04-03Last updated on 2026-04-03

Abstract

Last week, the market was primarily driven by a sharp escalation in the U.S.-Iran conflict, which pushed WTI crude oil prices above $100 amid threats to the Strait of Hormuz. This triggered inflation concerns, rising U.S. bond yields, and a sell-off in tech stocks and crypto assets, with major cryptocurrencies falling over 6%. Market sentiment indicators like the VIX and Fear & Greed Index reflected high uncertainty and fear. In crypto ETFs, outflows dominated mid-week with $500M net withdrawn from BTC and ETH products, though slight inflows returned by the weekend. TradFi trading volume on CEXs surged, especially in commodities and metals, while PAXG liquidity recover after initial sell pressure. On-chain, DEX trading cooled, with Meteora on Solana maintaining high volume while others declined. Stablecoin supply remained stable, with DAI showing resilience. LST protocols like Lido and Jito saw reduced activity due to lower ETH and SOL performance. Aave’s lending decreased overall, though Mantle saw growth. Derivatives data showed BTC funding rates briefly turned positive, indicating tentative long interest, though open interest declined and skew remained negative, reflecting defensive sentiment. Implied volatility held steady, suggesting limited expectations for near-term price swings. Gate highlighted progress in data-driven operations, growth in lending, AI integration, and upcoming events including the Hong Kong Web3 Festival.

The core driver of the market last week was the sharp escalation of the US-Iran conflict. As the Strait of Hormuz faced a substantial threat, WTI crude oil prices surged nearly 17% during the week, reclaiming the $100 mark. This simultaneously triggered strong inflation expectations, leading to rising US Treasury yields and dealing a heavy blow to high-valuation tech stocks. The US Dollar Index broke through the 100 mark, suppressing gold's gains. Cryptocurrencies, as high-risk assets, experienced significant selling pressure, with weekly declines exceeding 6%. As the US-Iran conflict entered its fifth week with no signs of resolution, the sell-off continued. Last week's volatility and uncertainty indicators reflected the current macroeconomic tone. The VIX index closed at 31.05, its highest level since the outbreak of the war; while CNN's Fear & Greed Index fell to the "Extreme Fear" level, its lowest since last November. The bond market further adjusted its pricing, with the 10-year US Treasury yield rising to 4.44% and the 30-year US Treasury yield briefly breaking through 5% before retreating to just below that level. This movement reflects the market's entrenched expectation of "higher for longer" interest rates. The market widely believes the possibility of a Fed rate cut before autumn is minimal, while the chance of a 25 basis point rate hike this year is about 25%.

2. Liquidity Analysis

2.1 Crypto ETF Net Flows

Crypto ETF flows showed a clear pattern of "outflows first, recovery later" over the past week: sentiment weakened rapidly mid-week, with spot ETFs seeing a combined net outflow of approximately $500 million—BTC outflows were about $296 million and ETH outflows about $207 million. The selling pressure was mainly concentrated on March 26-27, indicating a clear phase of institutional de-risking. Marginal inflows appeared over the weekend, ending the multi-day outflow trend. Overall, institutional funds remain cautiously allocated amid macroeconomic uncertainty.

2.2 TradFi Liquidity

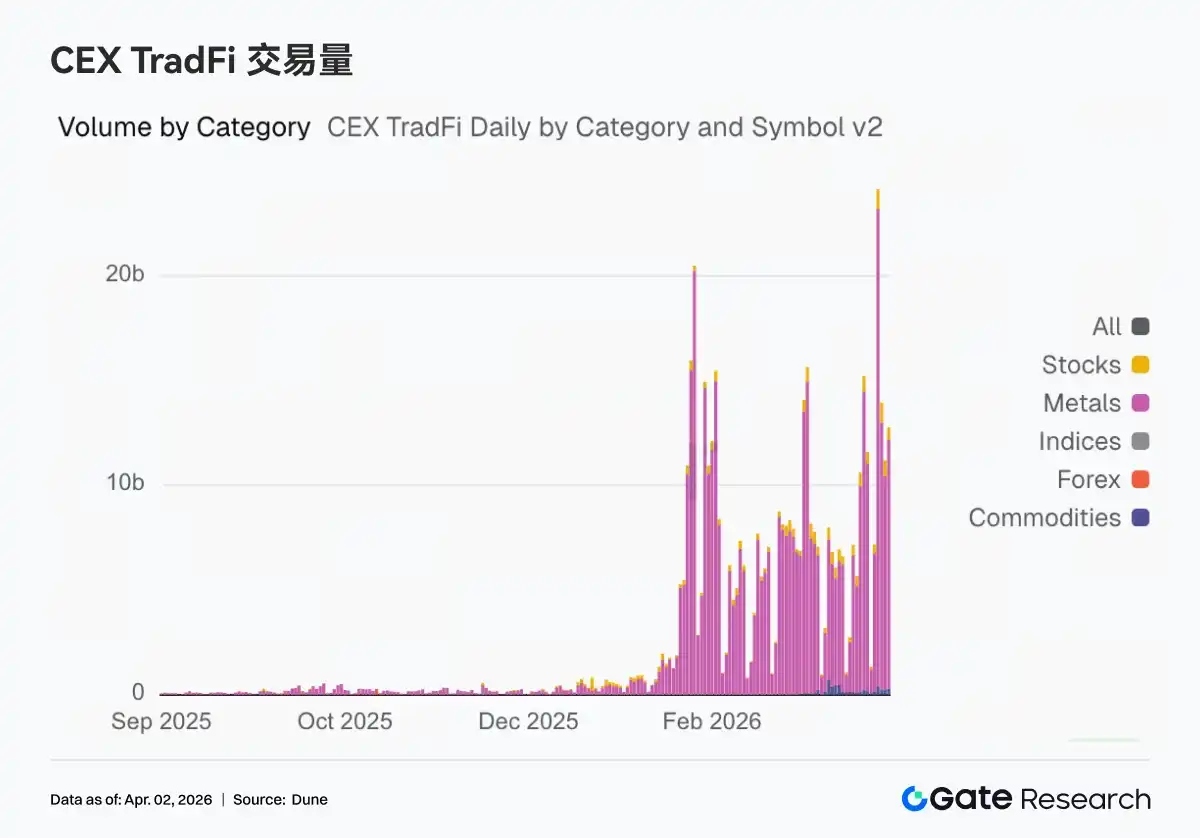
Over the past week, on-chain trading remained centered around macro asset volatility. Perp DEX TradFi trading volume rose to $17 billion; crude oil trading still had the highest weight but declined sequentially, while gold's share increased again. TradFi perpetual trading volume on CEXs surged, with volume on March 23rd hitting a record high. All sub-categories saw significant growth, with commodities and metals showing the highest sequential increases.
PAXG's market depth changes over the past week exhibited a structural feature of "weak first then strong, with tail-end volume expansion." Early in the week, Delta was mostly negative, coupled with price declines from highs, indicating net selling dominated and liquidity tended to withdraw; subsequently, around March 23rd, a round of concentrated selling pressure emerged, corresponding to a rapid price drop and creating a temporary liquidity vacuum. Depth structure improved significantly over the weekend, with Delta turning consistently positive and the scale significantly expanding, indicating funds began to actively absorb selling and push prices higher.

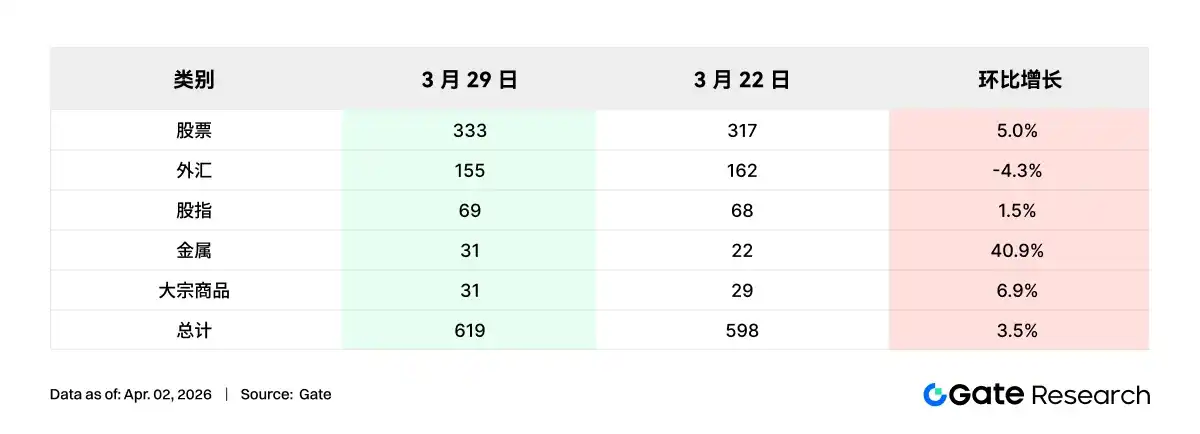
The number of TradFi asset categories expanded further last week. The total number of TradFi asset categories (counting only TradFi and CFD sections, excluding perpetual contracts) on three major CEXs increased from 598 to 619, a sequential growth of 3.5%. Metals saw the most significant growth, increasing from 22 to 31 items, up 40% sequentially; overall, only Gate saw an increase in the number of TradFi asset categories last week.
3. On-Chain Data Insights

3.1 DEX Trading Cools Down, Meteora Remains High

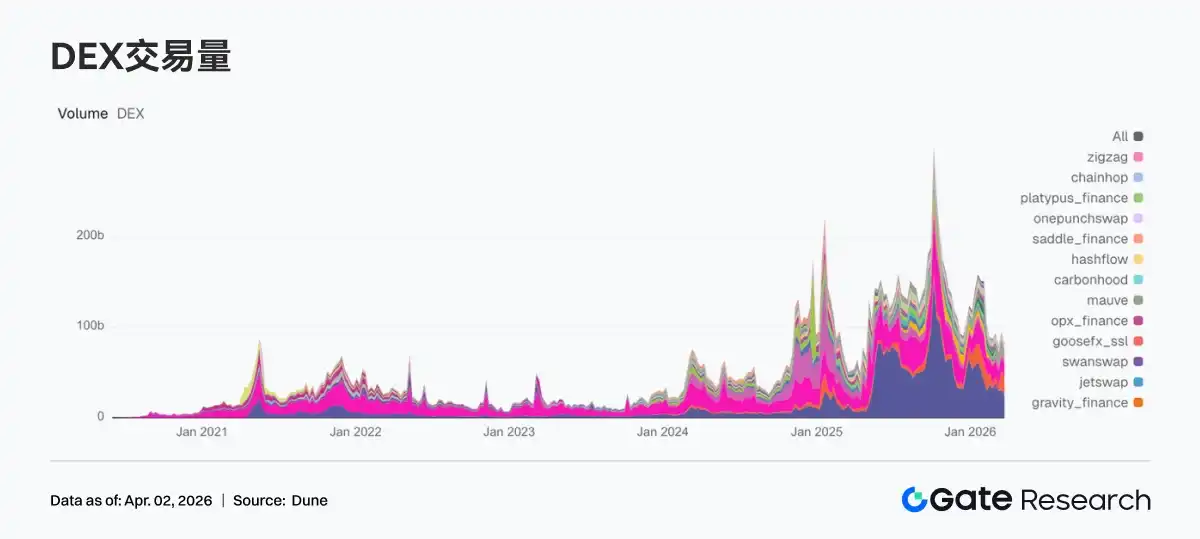
Trading heat shifted from last week's surge to a cooling phase, with top protocols generally pulling back. Weekly trading volume on both PancakeSwap and Uniswap declined compared to the previous week, indicating a overall convergence of spot trading demand on mainstream chains. The Solana side showed divergence; Meteora remained at a high level slightly above $20 billion in trading volume, but marginal growth has slowed; Raydium's weekly trading volume fell 50% sequentially, the largest drop among top DEXs. Aerodrome, Humidifi, and Bisonfi also saw varying degrees of decline. Looking at the protocol side, PancakeSwap's Infinity architecture and Meteora's DLMM remain the strongest efficiency labels, but the market this week placed more emphasis on确定性 liquidity.
3.2 Stablecoin Supply Consolidates at Highs, DAI Shows Resilience

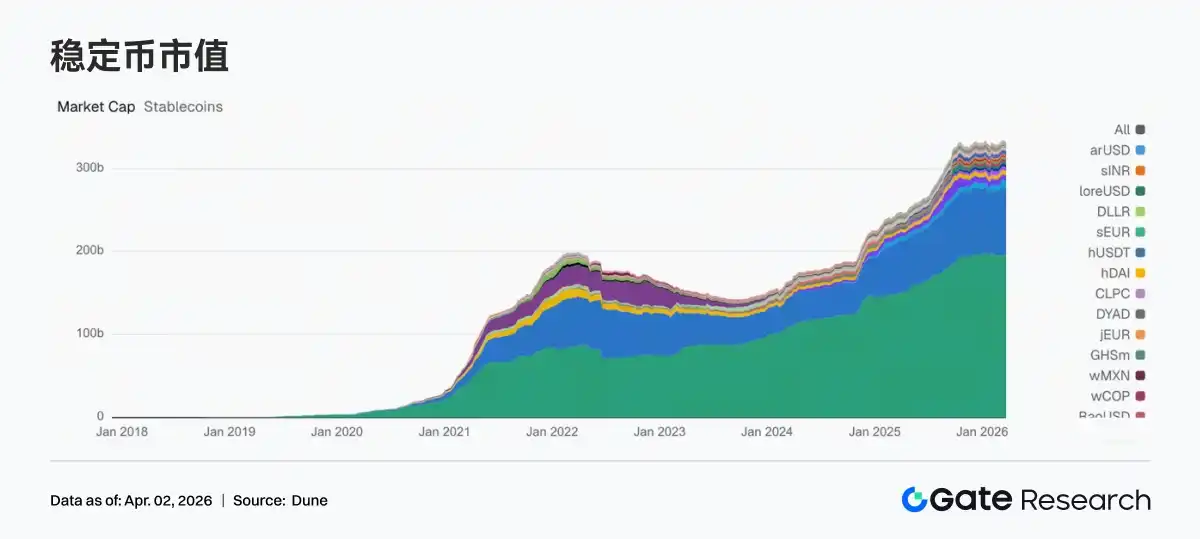
No new external inflows were seen in the stablecoin sector this week, with overall levels consolidating at highs. USDT remained almost flat compared to the previous week. USDC decreased by about $1.4 billion, and PYUSD also fell by nearly $200 million, indicating demand for payment and settlement-oriented stablecoins slightly declined this week. Protocol-type stablecoins were relatively more stable, with DAI seeing slight growth and USDS maintaining high levels. USD1, USDe, and GHO had minor fluctuations,偏向 structural reallocation. Circle continues to advance the multi-chain expansion of USDC + CCTP, but this week's data reflects a tilt within stablecoins from payment/settlement towards resilience in DeFi scenarios.
3.3 LST Protocols Pull Back, ETH and SOL Both Decelerate

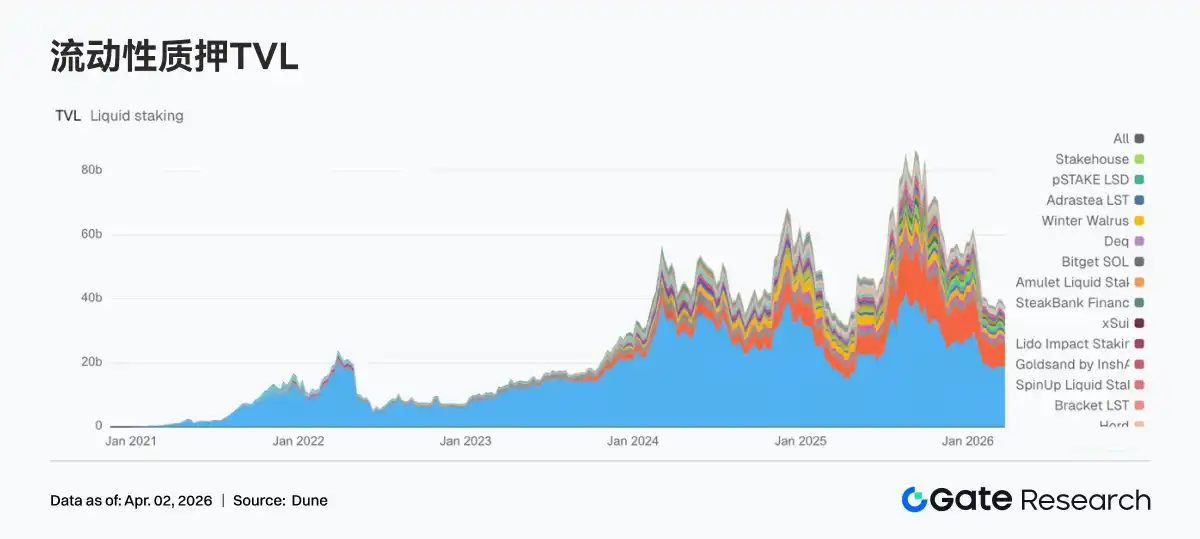
This week, the liquid staking sector saw both ETH and SOL narratives decelerate. Affected by ETH's poor performance, ETH LST funds began阶段性 reducing positions, with TVL declining for both Lido and Rocket Pool. Lido's V3 and EarnETH / EarnUSD vault expansions have broadened the product boundaries, but short-term TVL is more influenced by market risk appetite and staked asset price volatility. The SOL direction also faced pressure, with Jito and Sanctum Validator LSTs, among others, experiencing pullbacks. Overall, the week saw a downturn in the sector's overall risk appetite.
3.4 Aave Loan Volume Pulls Back, Mantle Becomes a Market Absorbing Limited Increment

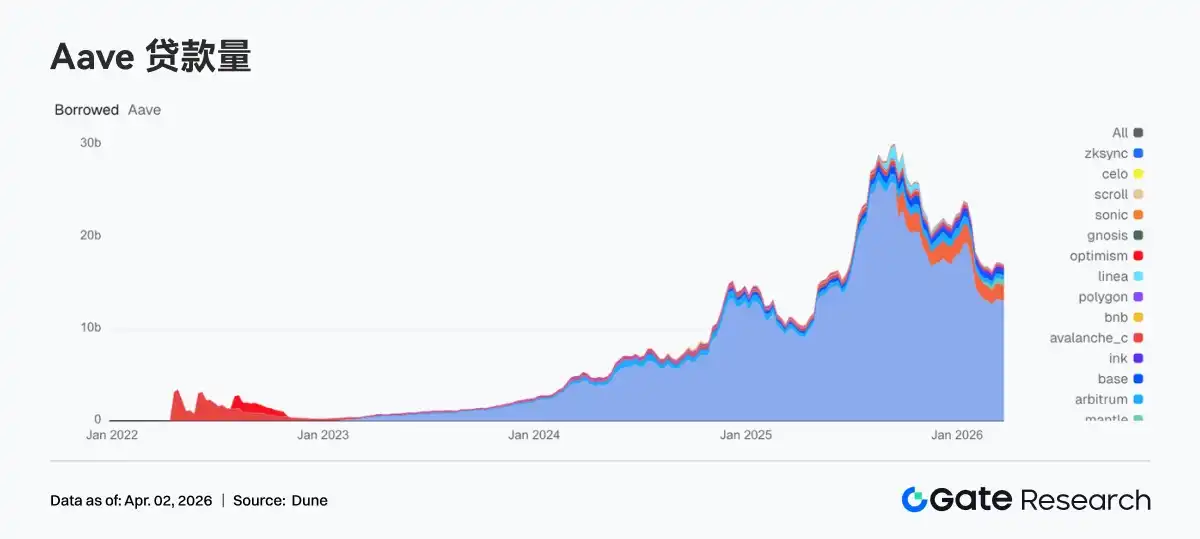
Aave's total loan balance slightly decreased compared to the previous week. Both the Ethereum main market and Plasma saw declines of about $100 million, indicating deleveraging in mainstream markets. Multi-chain expansion also temporarily slowed this week, with Base and Arbitrum同步 pulling back. Mantle was one of the few markets that grew against the trend, with loan规模 increasing from $555 million to $574 million, becoming the structural highlight of the week. Ink also rose slightly from $289 million to $292 million, but the increase was limited. Aave is recently advancing its V4 Hub-and-Spoke model, and the market is pricing in future cross-market liquidity efficiency, but current funds are prioritizing reducing overall leverage and allocating limited increments to sub-markets with new narratives.
3.5 Divergence in Aave's Three Core Asset Lending Rates Continues

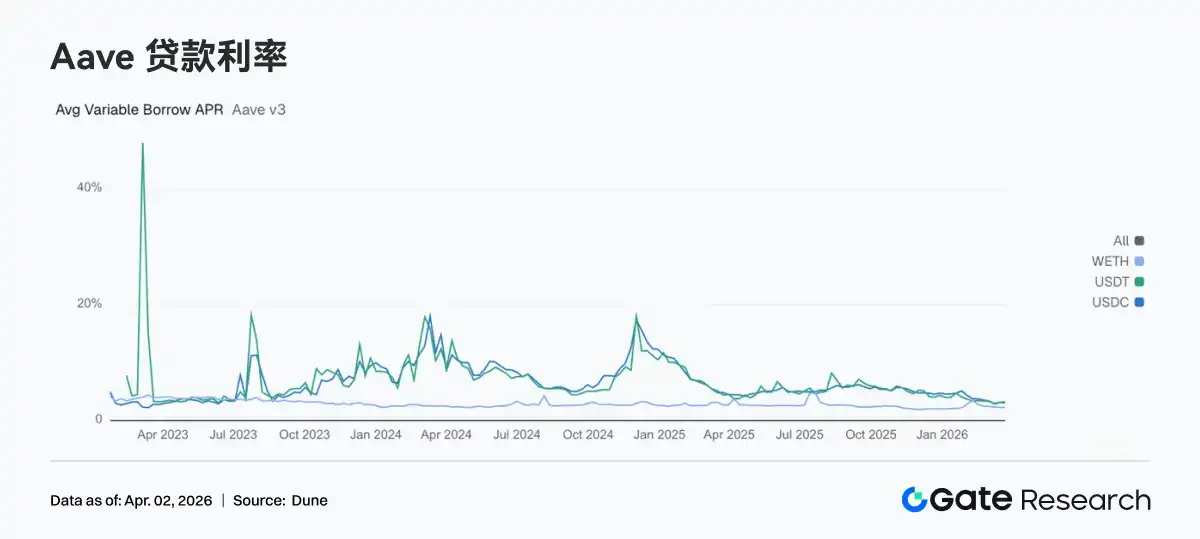
The average floating borrowing APR for USDC rose from 3.10% to 3.23%; demand for USD stablecoins did not weaken同步 with the decline in total loan balance this week. In contrast, USDT fell from 3.10% to 3.02%, and WETH also slightly decreased from 2.25% to 2.23%. While compressing broad risk exposure on-chain this week, lending demand became more concentrated on USDC. From a strategic perspective, this typically corresponds to institutions preferring USDC for liquidity scheduling, collateral management, and neutral strategy turnover. Combined with Aave's latest governance progress, the risk isolation and liquidity routing framework of V4 is gradually becoming clearer. Divergence in interest rates between different assets is likely to become more frequent in the future, better reflecting true capital preferences.
3.6 Protocol Revenue Shifts from Transaction-Driven Back to Stock-Driven

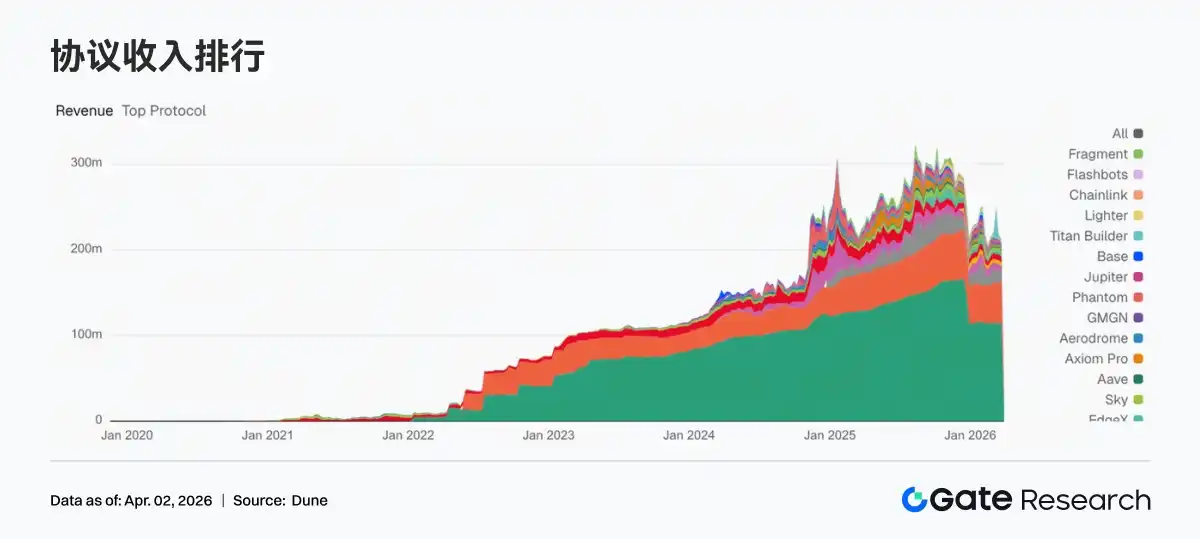
Revenue from trading protocols generally cooled down, while stablecoin issuers remained the most stable profit centers. Weekly revenue for Tether and Circle remained stable at high levels. In contrast, Hyperliquid declined from $14.3025 million to $12.6277 million, Pump fell from $7.1452 million to $6.6905 million, and EdgeX also dropped from $4.5534 million to $3.7969 million; the cooling trading activity has already transmitted to the revenue side. Overall, the main theme of protocol revenue this week was whose revenue is less dependent on short-term trading volatility.
4. Derivatives Tracking

4.1 Funding Rates Shift to Short-Term Bullish, Sentiment Switches to Tentative Longing

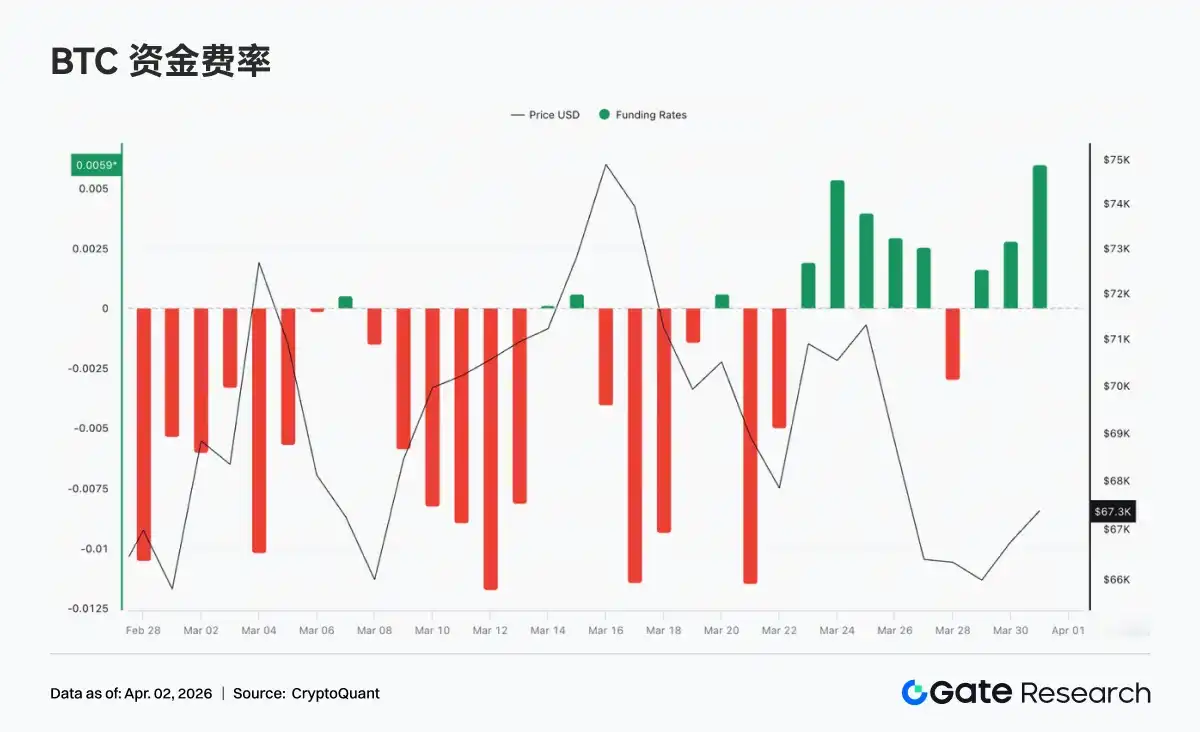
BTC funding rates overall showed a structure of shifting from repair to briefly turning positive before fluctuating again. The previously long-standing deep negative, short-dominated pattern has明显 eased. Funding rates turned positive mid-week and remained for several days (peaking near +0.005), indicating the market switched to active long试探, with short-term risk appetite repairing and resonating with the阶段性 price rebound. However, this positive funding rate phase was short-lived and limited in intensity, failing to form a trend-positive premium structure.
4.2 Open Interest Rises Then Falls, Consolidates; Leveraged Funds Turn Watchful

Over the past week, BTC open interest first expanded to a阶段性 high alongside rising prices, but then quickly decreased to around $21B following the price pullback, indicating significant deleveraging in the market. Subsequently, open interest failed to return to previous highs, instead oscillating and repairing within the $21B–$22.5B range, with the overall center of gravity lower. New capital inflow momentum was insufficient, and leverage shifted from expansion to contraction. Overall, the current open interest structure is dominated by存量博弈 (stock game playing), lacking sustained volume配合, and the market remains in a震荡重建阶段 (oscillating rebuilding phase) after deleveraging.

4.3 Option Open Interest Concentrated in Medium-to-Long Term & High Strike Prices, Bullish Structure Prevails

BTC option open interest is mainly concentrated in medium-to-long term contracts like April and June, indicating the market is focused on medium-term positioning; structurally, Calls are significantly higher than Puts, overall still偏向 bullish. Looking at strike prices, Calls are主要集中在 the $80,000–$120,000 range, while Puts are distributed in the $60,000–$80,000 range, forming a typical structure of upside call speculation and downside hedging. It is worth noting that Put open interest in the $60K–$70K range is not low,表明 the market maintains medium-term bullish expectations while also strengthening short-term defensive sentiment.

4.4 Skew in Negative Territory, Short-Term Defensive Sentiment Still Dominates

Over the past week, the BTC 25D Skew overall remained in negative territory (approx. -6 to -10), with Puts still carrying a premium relative to Calls, indicating the market's assessment of downside risk remains relatively high. Shorter cycles (7D, 30D) were more volatile, falling rapidly before briefly repairing, reflecting反复 switching short-term sentiment; medium-to-long term (60D and above) was relatively stable, overall maintaining in the -5 to -7 range, showing little change in medium-term risk expectations. Overall, the Skew did not show a sustained recovery to near neutral or positive values, meaning that although there were repair attempts, defensive positioning still dominates.

4.5 Implied Volatility Stabilizes, Market Expects Limited Short-Term Volatility

Over the past week, the BTC DVol index overall oscillated within the 52%–55% range, first slightly declining then rising again, without a trend increase. The market's pricing of future volatility remains relatively restrained overall. During this period, prices experienced significant declines, but implied volatility only rose温和, without panic amplification, indicating the market did not view the current adjustment as a high-risk event. Overall, IV showed some desensitization from price, reflecting traders' inclination towards range-bound volatility expectations rather than unilateral trend行情 (market moves).

5. Week Ahead Outlook
6. Gate Institutional Dynamics

Refined Operations

1. Advancing data-driven and refined management,精准定位 customer needs, enriching customized solutions.

2. Significant results in dormant user activation.

Capital Business

1. Collateralized lending scale continues to grow, approaching bull market levels.

2. BTC interest rates下调, driving new demand growth.

Product & Technology

1. Websocket contract BBO real-time push achieved full availability in April.

2. AI gradually implemented, institutional services entering the AI-assisted operation phase.

Events & Marketing

1. CrossEx Advanced Trading Incentive Program launched, offering up to -0.01% contract rebate maker fees starting April 9th.

2. April Hong Kong Web3 Festival Side Event即将开启 (coming soon).

Data Sources:

• Investing, https://investing.com/currencies/xau-usd-historical-data

• Gate, https://www.gate.com/trade/BTC_USDT

• CMC, https://coinmarketcap.com/real-world-assets/?type=all-tokens

• Coinglass, https://www.coinglass.com/pro/depth-delta

• Dune, https://dune.com/gateresearch/gate-institutional-weekly-report

• CryptoQuant, https://cryptoquant.com/asset/btc/chart/derivatives

• Amberdata, https://pro.amberdata.io/options/deribit/btc/current/

Gate Research Institute is a comprehensive blockchain and cryptocurrency research platform, providing readers with in-depth content including technical analysis, hot topic insights, market reviews, industry research, trend predictions, and macroeconomic policy analysis.

Disclaimer

Cryptocurrency market investment involves high risks. It is recommended that users conduct independent research and fully understand the nature of the assets and products they purchase before making any investment decisions. Gate is not responsible for any losses or damages resulting from such investment decisions.


Trending Cryptos

Related Questions

QWhat was the main driver of the market last week and how did it impact cryptocurrency prices?

AThe main driver was the sharp escalation of the US-Iran conflict, which threatened the Strait of Hormuz. This caused WTI crude oil prices to surge nearly 17%, reigniting inflation expectations. As a result, US Treasury yields rose, putting pressure on high-valuation tech stocks. Cryptocurrencies, as high-risk assets, experienced significant selling, with weekly losses exceeding 6%.

QHow did the net flows for crypto ETFs perform last week, and what was the trend for BTC and ETH specifically?

ACrypto ETF flows showed a clear pattern of 'outflows first, followed by a recovery.' Mid-week, sentiment weakened rapidly, with spot ETFs seeing a combined net outflow of approximately $500 million. Specifically, outflows were about $296 million for BTC and $207 million for ETH, with the selling pressure concentrated on March 26-27. A marginal inflow occurred over the weekend, ending the multi-day outflow trend.

QWhat was notable about the trading volume of TradFi perpetual contracts on CEXs last week?

AThe trading volume of TradFi perpetual contracts on CEXs surged significantly last week. Notably, March 23rd set a new all-time high for trading volume. All sub-categories saw substantial growth, with commodities and metals recording the highest month-over-month increases.

QWhat was the trend for BTC funding rates last week, and what did it indicate about market sentiment?

ABTC funding rates shifted from a deep negative, bearish-dominated structure to briefly turning positive (reaching nearly +0.005) mid-week. This indicated a shift towards active long positioning and a repair in short-term risk appetite, resonating with a temporary price rebound. However, this positive rate phase was short-lived and of limited intensity, failing to establish a sustained positive premium structure.

QHow did the Aave lending market perform last week, and which specific market was a structural bright spot?

AThe total loan balance on Aave saw a slight decline compared to the previous week. The main Ethereum market and Plasma both decreased by approximately $100 million, showing deleveraging in mainstream markets. Multi-chain expansion also slowed. Mantle was a structural bright spot, with its loan scale increasing from $555 million to $574 million, representing a rare instance of growth.

Related Reads

After Three Consecutive Quarters of Decline, Can the Crypto Market Find a Window for Stabilization in Q3?

The cryptocurrency market has just concluded its worst-performing quarter since 2022, with total capitalization dropping 12.6% to $2.1 trillion. All core metrics indicate capital is leaving the sector, not just rotating within it. Bitcoin fell 14.2% and Ethereum dropped 25.4% in Q2, breaking their previous correlation with US tech stocks. A key driver is the reversal in US spot Bitcoin ETF flows, which saw a net outflow of approximately $4.67 billion in Q2, including a record monthly outflow near $4.5 billion in June. While recent data suggests long-term holders are accumulating again, sustained ETF outflows mean continued selling pressure. Market focus is now singularly on the Federal Reserve. The upcoming July FOMC meeting is seen as the most critical event for Q3. A dovish signal could support Bitcoin reclaiming a $68,000-$84,000 range, while a hawkish stance might establish a new trading band around $50,000-$56,000. Additionally, regulatory uncertainty persists, with the progress of the crucial *CLARITY Act* stalling in the Senate, reducing its perceived 2026 passage probability to 40-45%. Despite the broad downturn, a few sectors showed growth. Prediction markets saw nominal volume surge 48.7% year-over-year to $113.8 billion, and tokenized collectibles transaction volume rose 143% quarterly to $1.4 billion. The Real-World Asset (RWA) tokenization sector also continued steady growth, now representing ~$28.1 billion in on-chain value. The market's foundation for an extreme crash appears limited, with Bitcoin price hovering near its 200-week moving average. However, the trading paradigm has shifted from narrative-driven speculation to decisions based on price action, policy developments, and interest rate expectations, making a broad sentiment-driven rally unlikely in the near term.

marsbit14h ago

After Three Consecutive Quarters of Decline, Can the Crypto Market Find a Window for Stabilization in Q3?

marsbit14h ago

BIT Trading Moment: BTC Still Suppressed by Weekly 200 EMA, Rejection May Restart Decline; Storage and Semiconductors that Surged Last Night Begin Falling in Evening Trading

**Crypto & Stock Market Wrap: Bitcoin Tests Resistance, Stocks Retreat After AI Surge** Bitcoin consolidates around $66,000, facing key resistance near $68,000—an area seen as a major psychological and technical hurdle where previous rallies have failed. Analysts note the cryptocurrency is caught between its 200-week moving average (~$63,333) and 200-week EMA (~$68,328). A clear break above $68k is needed to signal a stronger bullish trend, while a rejection could lead to a retest of $63k support. Market sentiment remains cautious, with low futures open interest pointing to a low-liquidity rebound rather than a full bull market. Bitcoin spot ETFs saw another $203 million inflow. US stock futures pointed lower after a strong Tuesday session led by a massive rebound in semiconductors and memory stocks. The rally was fueled by renewed optimism about AI-driven hardware demand, with Micron, SanDisk, and SK Hynix surging. However, those gains reversed in pre-market trading. Super Micro Computer (SMCI) soared over 20% after hours on strong guidance and a record backlog. Other standouts included Rocket Lab and nuclear energy plays Oklo and X-Energy. Rising oil prices (Brent above $91) and climbing Treasury yields (10-year near 4.64%), however, are reigniting inflation concerns and acting as a headwind for equities. In Asia, markets were mixed. South Korea's KOSPI pared early gains to close slightly higher as semiconductor stocks like SK Hynix gave back initial surges. Japan's Nikkei edged lower as the yen hit a fresh 38-year low against the dollar, raising fears of potential market intervention. Key events to watch include the Samsung Galaxy launch, AMD's AI event, and a slew of major tech earnings from Alphabet, Tesla, and IBM after the close on Wednesday, followed by the ECB meeting and Intel's earnings on Thursday.

marsbit14h ago

BIT Trading Moment: BTC Still Suppressed by Weekly 200 EMA, Rejection May Restart Decline; Storage and Semiconductors that Surged Last Night Begin Falling in Evening Trading

marsbit14h ago

Former CFTC Chairman, Circle President Tarbert: Preaching Long-Termism While Cashing Out $30 Million Himself

Former CFTC Chairman and Circle President Heath Tarbert has consistently advocated for a long-term vision in public, urging patience from investors as Circle’s stock price has fallen significantly from its peak. However, it has been revealed that since Circle’s IPO, Tarbert has continuously sold his CRCL shares through pre-arranged trading plans, cashing out approximately $30 million, without making any public market purchases. This contrast between his public messaging and personal actions has drawn criticism. Tarbert joined Circle in July 2023 as Chief Legal Officer, leveraging his regulatory experience to help guide the company through its IPO and expansion. Despite promoting stablecoins as long-term infrastructure, he established a 10b5-1 trading plan just before Circle went public, leading to substantial stock sales over the following year. In March 2026, he initiated another plan to sell more shares. His career trajectory highlights a pattern of moving between high-level regulatory roles and influential positions in the financial sector. After resigning as CFTC Chairman in early 2021, he joined Citadel Securities as Chief Legal Officer just 27 days later, during a period of intense regulatory scrutiny for the firm. He later joined Circle, aiding its efforts to navigate regulatory challenges for its public listing. While Tarbert's expertise in policy and compliance is valuable to companies like Circle, his actions—advocating long-term confidence while personally divesting—raise questions about the alignment between his public statements and his private financial decisions, leaving investors who followed his advice to bear the market risks.

marsbit15h ago

Former CFTC Chairman, Circle President Tarbert: Preaching Long-Termism While Cashing Out $30 Million Himself

marsbit15h ago

Gate Research Institute: The 'Wall Street-ization' Wave of Crypto Financial Products – Competition or Integration?

The article titled "Gate Research Institute: Are Crypto Financial Products Sparking a 'Wall Street' Wave—Competition or Convergence?" explores the evolving relationship between the crypto ecosystem and traditional finance (TradFi). The piece begins by reflecting on Bitcoin's original 2009 vision of decentralization, disintermediation, and moving away from banks. It then contrasts this with the 2024 landscape, where key crypto assets like Bitcoin are increasingly held through Wall Street products like ETFs issued by giants like BlackRock. The article questions whether this signifies that TradFi is systematically taking over the rights to issue, price, custody, and distribute crypto financial assets. The core argument is that this is not a zero-sum takeover but rather a bidirectional convergence where each side addresses the other's weaknesses. Crypto offers 24/7 global markets, programmable settlement, and open access but lacks compliant channels, institutional-grade custody, deep fiat liquidity, and mainstream distribution. TradFi possesses these but is constrained by legacy systems, limited operating hours, and slow settlement. Two primary convergence paths are highlighted: * **Path A (CEX to TradFi):** Exemplified by Gate, which has progressed from offering tokenized stocks and CFDs to providing direct, real stock trading (US, Hong Kong, South Korea) within its platform, using USDT. * **Path B (TradFi to Crypto):** Exemplified by Robinhood, which has integrated crypto trading, acquired exchanges like Bitstamp, and is moving traditional assets like stocks onto the blockchain via tokenization and its own Layer 2. Both paths are ultimately competing to become the next-generation, unified financial account—a "super account" where users can seamlessly trade cryptocurrencies, stocks, ETFs, RWA (Real World Assets), and tokenized treasury products in one interface. The growth of RWA and tokenized treasuries (e.g., BlackRock's BUIDL) is presented as the asset-layer fusion, providing stable, yield-bearing assets on-chain and acting as a bridge between the two worlds. In conclusion, the "Wall Street-ization" of crypto is framed as a mutual transformation. Decentralized ideals persist in the protocol layer, while at the application layer, a more efficient, global, and accessible unified capital market is emerging from this convergence. The future competition lies not between crypto exchanges and stockbrokers, but between platforms vying to offer the most comprehensive asset coverage, liquidity, and user experience within a single account.

marsbit15h ago

Gate Research Institute: The 'Wall Street-ization' Wave of Crypto Financial Products – Competition or Integration?

marsbit15h ago

Trading

Spot

Hot Articles

How to Buy CORE

Welcome to HTX.com! We've made purchasing CORE (CORE) simple and convenient. Follow our step-by-step guide to embark on your crypto journey.Step 1: Create Your HTX AccountUse your email or phone number to sign up for a free account on HTX. Experience a hassle-free registration journey and unlock all features.Get My AccountStep 2: Go to Buy Crypto and Choose Your Payment MethodCredit/Debit Card: Use your Visa or Mastercard to buy CORE (CORE) instantly.Balance: Use funds from your HTX account balance to trade seamlessly.Third Parties: We've added popular payment methods such as Google Pay and Apple Pay to enhance convenience.P2P: Trade directly with other users on HTX.Over-the-Counter (OTC): We offer tailor-made services and competitive exchange rates for traders.Step 3: Store Your CORE (CORE)After purchasing your CORE (CORE), store it in your HTX account. Alternatively, you can send it elsewhere via blockchain transfer or use it to trade other cryptocurrencies.Step 4: Trade CORE (CORE)Easily trade CORE (CORE) on HTX's spot market. Simply access your account, select your trading pair, execute your trades, and monitor in real-time. We offer a user-friendly experience for both beginners and seasoned traders.

5.9k Total ViewsPublished 2024.03.29Updated 2026.06.02

How to Buy CORE

Discussions

Welcome to the HTX Community. Here, you can stay informed about the latest platform developments and gain access to professional market insights. Users' opinions on the price of CORE (CORE) are presented below.

活动图片












