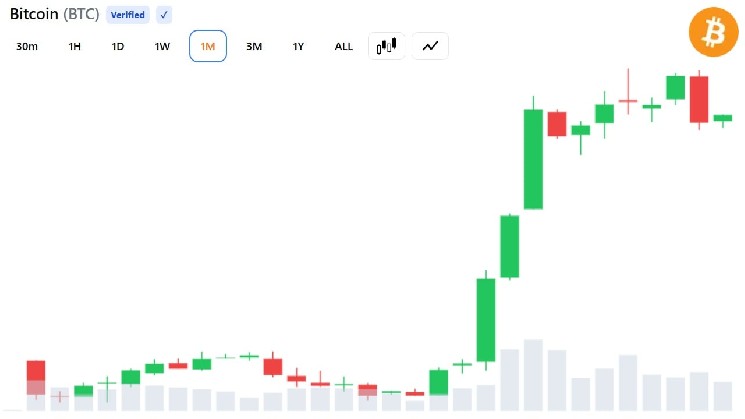
Crypto analyst Rekt Capital noted that significant technical resistance has formed around the $80,000 level on Bitcoin's daily chart, and a hidden bearish divergence between the price and the RSI indicator is visible.
According to the analyst, Bitcoin's lows in February and June 2026 occurred in similar price zones, with the Relative Strength Index (RSI) dropping to near oversold levels in both periods. Following both declines, the Bitcoin price rose again to around $80,000.
Rekt Capital pointed out a substantial difference when comparing current prospects with the rise in May 2026. They stated that although Bitcoin has again climbed to around $80,000, a lower peak has formed at the price level, remaining below the previous high. However, the RSI indicator rose above its previous level during the same period, registering a higher peak.
In technical analysis, when the price forms lower peaks while the RSI achieves higher ones, it is considered a hidden bearish divergence. This pattern may indicate that the current upward momentum is not confirmed by price and that selling pressure could intensify again.
In Rekt Capital's view, this negative technical outlook will persist until Bitcoin breaks through the resistance zone around $80,000 and forms a new, higher peak.
*This is not investment advice.
end-content