Ethereum’s Price Pulls Back Close To $1,900, But Large Holders Remain Unfazed

bitcoinistPublished on 2026-05-28Last updated on 2026-05-28

Abstract

Ethereum's price has declined toward $1,950, a level not seen since March, amid broader bearish pressure in the cryptocurrency market. Despite this downturn, large ETH holders, or "whales," are not selling off their positions. Key metrics indicate whales are accumulating more ETH, with the Whale vs Retail Delta metric turning positive, suggesting renewed institutional confidence. Furthermore, activity in the Ethereum futures market is increasing, with rising Open Interest and long positions, signaling investors are positioning for a potential future rally. Analysts also note that Ethereum's Market Value to Realized Value (MVRV) ratio has fallen below 0.8, a zone historically associated with accumulation and a potential foundation for the next bull market. While ETH price dropped nearly 5% in 24 hours, trading volume increased by over 17%.

With bearish pressure building across the cryptocurrency market, the Ethereum price is steadily dropping toward the $1,950 mark once again, a level last seen in March. Despite the altcoin’s declining price action and general unfavorable market conditions, large ETH holders seem to be holding onto their positions.

What Ethereum Whales Are Doing In This Pullback

Ethereum’s large investors have remained resilient in recent market sessions. While ETH’s price has struggled to sustain strong momentum, these key investors continue to hold on to their positions rather than aggressively reduce their exposure or sell off their coins.

In a waning market environment, the activity of large holders is closely monitored as it typically provides more insight into long-term market conviction and sentiment among institutional investors. This trend is seen in the Ethereum Whale Vs Retail Delta metric, which has flipped toward the upside once again.

As reported by CW, a verified data analyst at the CryptoQuant platform and crypto investor, the crucial metric has now surpassed the 0.5 level and continues to move in an upward direction. When this metric flips upward, it is a sign that whales are regaining influence over the market, reflecting renewed confidence in the asset’s long-term prospects.
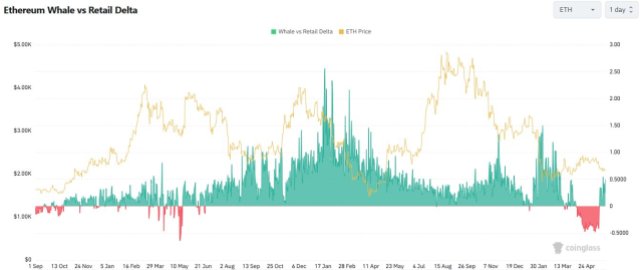
Source: Chart from CW on X

Amid ongoing volatility in ETH’s price action, the large investors have shifted into an accumulation phase as they quietly and rapidly increase their long positions in the altcoin. Should this trend continue over the following days and weeks, it could play a critical role in shaping the altcoin’s next trajectory.

Another aspect that is picking up again is the Ethereum Futures market. CW revealed that movement in the market is steadily increasing, as investors start to lean toward the upside for ETH. Open Interest (OI) has transitioned into an upward direction alongside a persistent rise in long positions.

Investors appear to be taking advantage of the current downside performance of ETH’s price rather than exiting the market in fear. Furthermore, this activity suggests that investors may be positioning for the altcoin’s next major rally.

This Metric Could Support ETH’s Next Move

Bullish momentum is starting to reflect on several key Ethereum metrics even as prices trend downward. Ali Charts, a seasoned crypto investor and data analyst, has outlined a renewed shift, emerging in the ETH market as the Market Value To Realized Value (MVRV) metric declines below the 0.8 level.

However, this bullish development may fade soon. According to Ali Charts, whenever ETH drops below the 0.8 MVRV band, the move is not sustained for very long. Data shows that in the past, this exact zone represented a high-probability macro accumulation window. At the same time, this window could build the ultimate foundation for the next major bull market.

At the time of writing, the ETH price was trading at $1,980, demonstrating a nearly 5% decline in the last 24 hours. However, its trading volume is moving in an opposite direction, rising by more than 17% over the past day.

ETH trading at $1,994 on the 1D chart | Source: ETHUSDT on Tradingview.com

Trending Cryptos

Related Questions

QWhat is the current trend in the Ethereum price according to the article, and why is it significant?

AThe Ethereum price is steadily dropping toward the $1,950 mark, a level last seen in March, due to bearish pressure across the cryptocurrency market. This is significant as it represents a notable pullback.

QHow are large Ethereum investors, or 'whales', behaving during this price pullback?

ALarge Ethereum holders have remained resilient and are holding onto their positions rather than selling off their coins. They have shifted into an accumulation phase, quietly increasing their long positions.

QWhat does the upward movement of the 'Ethereum Whale Vs Retail Delta' metric indicate?

AThe upward movement of the 'Ethereum Whale Vs Retail Delta' metric, surpassing the 0.5 level, is a sign that whales are regaining influence over the market. It reflects renewed confidence in Ethereum's long-term prospects.

QWhat trend is observed in the Ethereum Futures market, as per the article?

AIn the Ethereum Futures market, movement is steadily increasing. Open Interest (OI) has transitioned into an upward direction alongside a persistent rise in long positions, indicating investors are leaning toward the upside for ETH.

QAccording to analyst Ali Charts, what is the potential significance of the ETH MVRV metric dropping below the 0.8 level?

AAccording to Ali Charts, when the ETH Market Value to Realized Value (MVRV) metric drops below the 0.8 level, it represents a high-probability macro accumulation window. Historically, this zone has built the foundation for the next major bull market.

Related Reads

Why Bitcoin Holds Above $64,000 After Fed's Hard Pause

**Bitcoin Stabilizes Near $64,000 Following Hawkish Fed Pause** The cryptocurrency market, led by Bitcoin, remained stable around $64,000 despite a volatile reaction to the latest U.S. Federal Reserve meeting. The Fed paused interest rates but signaled a hawkish stance, with three committee members voting for an increase—the highest dissent since 2016. This limits risk appetite but hasn't triggered panic selling. Key market highlights include Bitcoin ETFs seeing a net inflow of $32.1 million, breaking a streak of outflows, while Ethereum ETFs experienced outflows of $18.65 million. Liquidations affected about 90,000 traders. Technically, Bitcoin finds support around $63,000-$63,500, with major resistance near $66,000. While its price is about 49% below its all-time high, institutional demand via ETFs and the absence of mass capitulation support a potential recovery scenario in the second half of the year. Major altcoins showed mixed movements, with Solana attracting capital while Ethereum faced selling pressure despite strong on-chain metrics like a growing staking queue. Regulatory news took a pause as the U.S. Senate delayed the CLARITY Act vote until at least autumn. For the final trading day of July, U.S. inflation and consumer spending data will be crucial. Bitcoin's key levels to watch are $63,000 support and $66,000 resistance. Sustained ETF inflows and Bitcoin holding above $63,000 are seen as positive signs for a potential market recovery later in the year.

cryptonews.ru1h ago

Why Bitcoin Holds Above $64,000 After Fed's Hard Pause

cryptonews.ru1h ago

Trading

Spot

Hot Articles

Discussions

Welcome to the HTX Community. Here, you can stay informed about the latest platform developments and gain access to professional market insights. Users' opinions on the price of ETH (ETH) are presented below.

活动图片















