Ethereum Struggles Below $2,000 As Volume Dries Up And Bears Dominate

bitcoinistPublished on 2026-03-29Last updated on 2026-03-29

Abstract

Ethereum is struggling below the critical $2,000 support level, trading around $1,985, as declining volume and increased selling pressure indicate bearish control. The breakdown below this key psychological level signals a shift in market structure, turning previous support into resistance. Low buyer interest leaves the market vulnerable, with the next major support at the $1,750 macro trendline. A break below this could lead to a deeper retracement, while reclaiming $2,100 is necessary for a bullish reversal. Despite repeated tests of a key resistance trendline, Ethereum shows weak momentum, with the 200-day EMA far above at $2,758, underscoring its current bearish deviation.

Ethereum continues to struggle below the critical $2,000 level, with price losing momentum as volume fades and selling pressure builds. The lack of strong buyer interest leaves the market vulnerable, allowing bears to maintain control while key support levels come into focus.

$2,000 Breakdown Signals A Shift In Market Structure

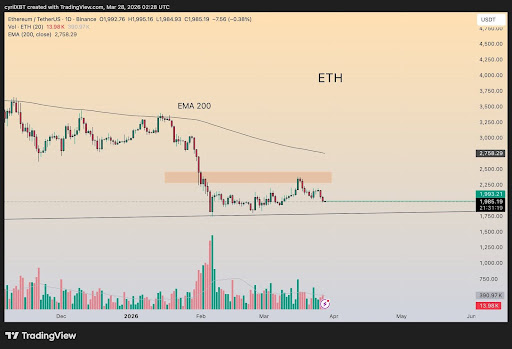
Ethereum has just broken below the $2,000 level, a key zone that has been on watch for weeks. According to CyrilXBT, the price is currently trading around $1,985. This level has acted as a strong pivot for sentiment, and slipping beneath it signals a clear shift in control.

Each time Ethereum tested the $2,000 level, it managed to bounce and maintain strength. However, this time is different, as price has now closed below it, turning former support into potential resistance. That kind of transition often marks a bigger change in market behavior, especially when followed by continued weakness.

Volume has also declined noticeably, suggesting a lack of strong buying interest at this level. Without conviction, the price struggles to find the momentum needed for a meaningful recovery. This type of low-volume environment often leads to slower moves, but it can also precede larger impulsive drops if sellers step in aggressively.
Source: Chart from CyrilXBT on X

Looking ahead, the $1,750 macro trendline stands out as the last major support on the chart, and price is gradually approaching it. A break of that level would open the door to a deeper retracement, while a strong defense could spark a temporary relief bounce. On the upside, the EMA 200 at $2,758 remains far above current levels, emphasizing how much Ethereum has deviated from its broader trend.

A reclaim of $2,100, followed by a strong hold above it, would be necessary to shift the current outlook and signal that buyers are regaining control. Until then, Ethereum remains under pressure, with momentum favoring the downside, making it one of the weakest setups on the watchlist.

Ethereum Breakout Potential: No Certainty

In a recent analysis by Bitcoinsensus, Ethereum is seen pressing against a well-defined trendline that has already been tested multiple times. The repeated rejection from this line highlights its strength as a key resistance zone, where sellers continue to step in and defend control.

Each retest adds more pressure beneath the surface, gradually weakening the level over time. While the structure continues to hold for now, the more price interacts with this resistance, the more fragile it becomes, increasing the probability of a decisive move.

Another attempt could be enough to trigger a breakout if buying momentum steps in with enough strength. However, no outcome is guaranteed at this stage, and the price could easily face another rejection from this zone.

ETH trading at $1,997 on the 1D chart | Source: ETHUSDT on Tradingview.com

Trending Cryptos

Related Questions

QWhat is the current price of Ethereum and why is the $2,000 level significant?

AEthereum is currently trading around $1,985. The $2,000 level is a critical psychological and technical support zone. A break below it signals a shift in market control from buyers to sellers, turning it into potential resistance.

QAccording to the article, what does the declining trading volume indicate for Ethereum's price?

AThe declining trading volume suggests a lack of strong buyer interest and conviction at current levels. This makes the market vulnerable and can lead to slower price moves or precede larger impulsive drops if sellers become more aggressive.

QWhat is identified as the last major support level for Ethereum, and what would a break below it mean?

AThe $1,750 macro trendline is identified as the last major support. A break below this level would open the door to a deeper and more significant price retracement for Ethereum.

QWhat needs to happen for Ethereum's bearish outlook to shift and signal that buyers are regaining control?

AFor the bearish outlook to shift, Ethereum would need to reclaim and hold strongly above the $2,100 level. This would signal that buyers are regaining control and provide a more positive momentum shift.

QHow does the analysis from Bitcoinsensus describe the key resistance trendline Ethereum is testing?

ABitcoinsensus's analysis describes a well-defined resistance trendline that has been tested and rejected from multiple times. Each retest weakens the level, increasing the probability of a decisive breakout, though another rejection is still possible without strong buying momentum.

Related Reads

Why Bitcoin Holds Above $64,000 After Fed's Hard Pause

**Bitcoin Stabilizes Near $64,000 Following Hawkish Fed Pause** The cryptocurrency market, led by Bitcoin, remained stable around $64,000 despite a volatile reaction to the latest U.S. Federal Reserve meeting. The Fed paused interest rates but signaled a hawkish stance, with three committee members voting for an increase—the highest dissent since 2016. This limits risk appetite but hasn't triggered panic selling. Key market highlights include Bitcoin ETFs seeing a net inflow of $32.1 million, breaking a streak of outflows, while Ethereum ETFs experienced outflows of $18.65 million. Liquidations affected about 90,000 traders. Technically, Bitcoin finds support around $63,000-$63,500, with major resistance near $66,000. While its price is about 49% below its all-time high, institutional demand via ETFs and the absence of mass capitulation support a potential recovery scenario in the second half of the year. Major altcoins showed mixed movements, with Solana attracting capital while Ethereum faced selling pressure despite strong on-chain metrics like a growing staking queue. Regulatory news took a pause as the U.S. Senate delayed the CLARITY Act vote until at least autumn. For the final trading day of July, U.S. inflation and consumer spending data will be crucial. Bitcoin's key levels to watch are $63,000 support and $66,000 resistance. Sustained ETF inflows and Bitcoin holding above $63,000 are seen as positive signs for a potential market recovery later in the year.

cryptonews.ru1h ago

Why Bitcoin Holds Above $64,000 After Fed's Hard Pause

cryptonews.ru1h ago

Trading

Spot

Hot Articles

Discussions

Welcome to the HTX Community. Here, you can stay informed about the latest platform developments and gain access to professional market insights. Users' opinions on the price of ETH (ETH) are presented below.

活动图片















