Ethereum slips to $2.2K as ‘extreme fear’ hits – Why THIS level decides next bull run

AmbcryptoPublished on 2026-02-02Last updated on 2026-08-02

Abstract

Why THIS level decides next bull run.

Ethereum faced a tough weekend as its price fell by 17.38% from Saturday’s (the 31st of January) open at $$2,702.

ETH was trading at $2,219 at the time of writing, and the market-wide sentiment was extremely fearful.

Bitcoin [BTC] was down 4.56% in 24 hours and 12.7% in a week, according to CoinMarketCap data. The Fear and Greed index was at an abysmal 15.

Ethereum futures traders have faced $266.53 million in liquidations, with $204.38 million being long. Yet, this might be the time to buy more Ethereun.

Crazy? Perhaps, but the reward is great, and the setup’s invalidation is clearly defined.

Exploring the Ethereum opportunity
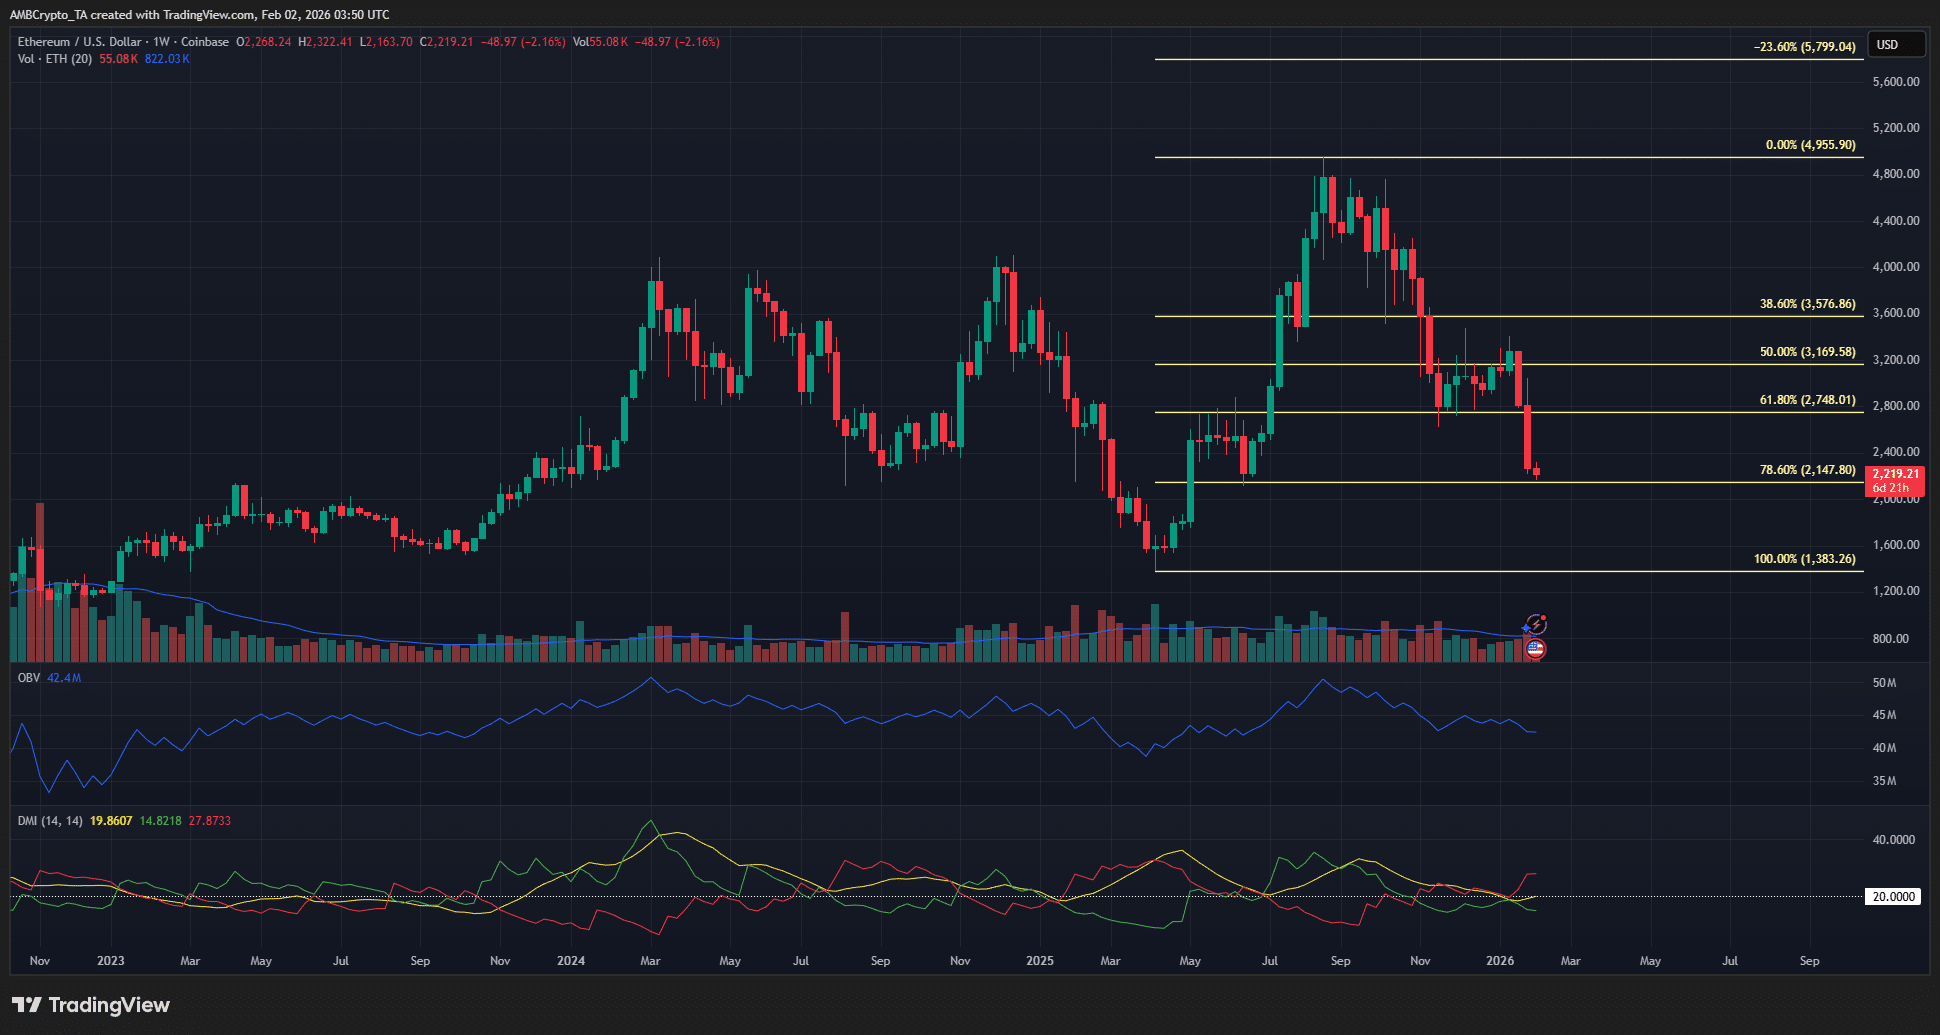
On the weekly chart, Ethereum has a bullish swing structure. This was set in place during the rally from $1,383 to $4,955 in 2025, when digital asset treasuries accumulated billions of dollars worth of ETH.

Institutional investment was still incoming. Bitmine [BMNR] has added 132,813 ETH to its holdings over the past month. It should be noted that their position was facing a 42.5% drawdown.

Going back to the technical perspective, the retracement from $4.9k in recent months has nearly reached the 78.6% retracement level at $2,147.

In the coming days or weeks, a brief dive below this level to hunt down liquidity is expected. A bullish recovery could begin thereafter.

AMBCrypto reported that investors were already treating the drop as a discount.

Is now the right time to buy?
Absolutely!

Provided a potential drop to $1,300 per ETH does not faze you. Long-term holders can look to keep buying more Ethereum.

The weekly chart showed that the swing structure was bullish, and a weekly session close below $1,383 is needed to flip this around.

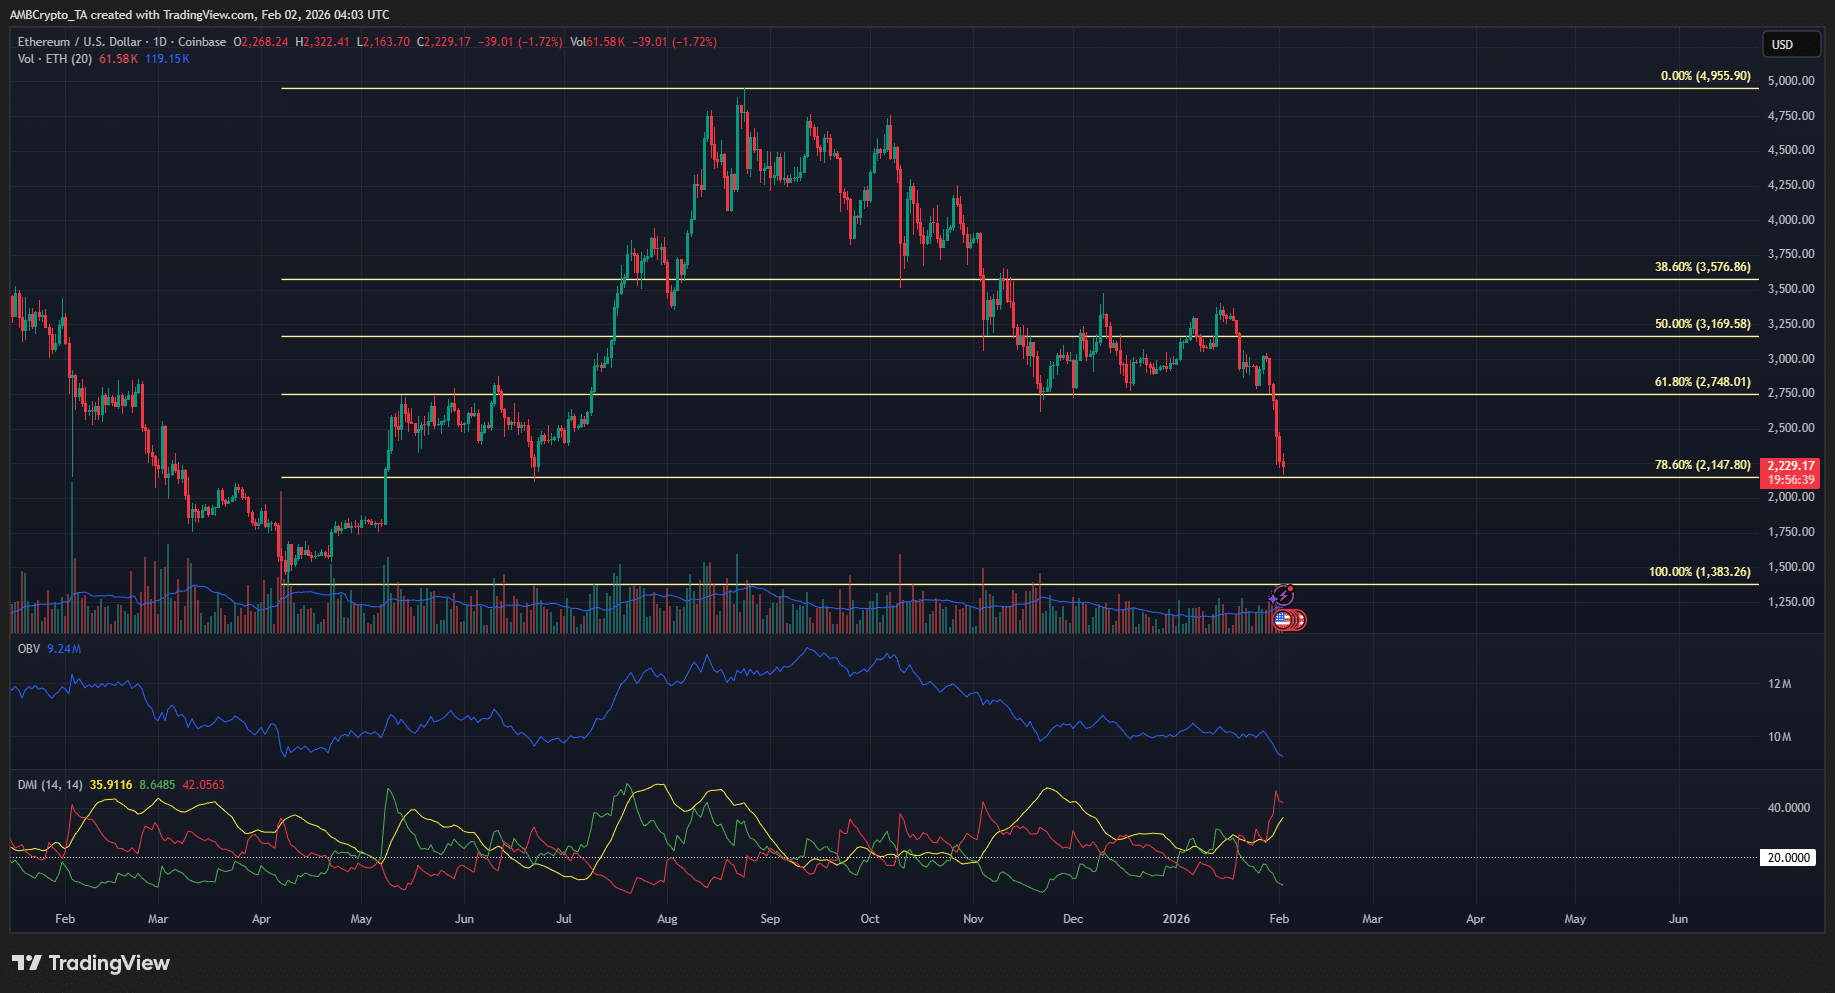
The daily chart showed bears were dominant. The OBV was making new lows, and the DMI signaled a strong downtrend in progress.

Traders’ call to action- Assess risk and wait

Swing traders would want to see bullish strength around $2,000-$2,200 before looking to go long. Catching knives, or trying to time the market bottom, can lead to a bleeding portfolio.

A drop below $2,000 should be taken as an early warning signal. Such a scenario would reflect that bulls had little appetite for a reversal, making a drop toward $1,300 more likely.

Final Thoughts

  • The weekly swing structure of Ethereum was bullish, despite the heavy losses in recent months.
  • Swing traders should wait for signs of strength before looking to buy.

Disclaimer: The information presented does not constitute financial, investment, trading, or other types of advice and is solely the writer’s opinion.


Trending Cryptos

Related Questions

QWhat was the price of Ethereum at the time of writing and how much did it fall from the weekend's open?

AEthereum was trading at $2,219 at the time of writing, having fallen 17.38% from Saturday's open at $2,702.

QWhat is the 'Fear and Greed Index' at, and what does this level signify for the market?

AThe Fear and Greed Index was at 15, which signifies a state of 'extreme fear' in the market.

QAccording to the technical perspective, what is the critical 78.6% retracement level for Ethereum and what is expected to happen around it?

AThe critical 78.6% retracement level is at $2,147. The article expects a brief dive below this level to hunt down liquidity, followed by a potential bullish recovery.

QWhat price level would invalidate the bullish weekly swing structure for Ethereum?

AA weekly session close below $1,383 is needed to invalidate the bullish weekly swing structure.

QWhat advice does the article give to swing traders regarding when to consider going long on Ethereum?

AThe article advises swing traders to wait for signs of bullish strength around the $2,000-$2,200 price range before looking to go long, rather than trying to catch the falling knife and time the market bottom.

Related Reads

Why Bitcoin Holds Above $64,000 After Fed's Hard Pause

**Bitcoin Stabilizes Near $64,000 Following Hawkish Fed Pause** The cryptocurrency market, led by Bitcoin, remained stable around $64,000 despite a volatile reaction to the latest U.S. Federal Reserve meeting. The Fed paused interest rates but signaled a hawkish stance, with three committee members voting for an increase—the highest dissent since 2016. This limits risk appetite but hasn't triggered panic selling. Key market highlights include Bitcoin ETFs seeing a net inflow of $32.1 million, breaking a streak of outflows, while Ethereum ETFs experienced outflows of $18.65 million. Liquidations affected about 90,000 traders. Technically, Bitcoin finds support around $63,000-$63,500, with major resistance near $66,000. While its price is about 49% below its all-time high, institutional demand via ETFs and the absence of mass capitulation support a potential recovery scenario in the second half of the year. Major altcoins showed mixed movements, with Solana attracting capital while Ethereum faced selling pressure despite strong on-chain metrics like a growing staking queue. Regulatory news took a pause as the U.S. Senate delayed the CLARITY Act vote until at least autumn. For the final trading day of July, U.S. inflation and consumer spending data will be crucial. Bitcoin's key levels to watch are $63,000 support and $66,000 resistance. Sustained ETF inflows and Bitcoin holding above $63,000 are seen as positive signs for a potential market recovery later in the year.

cryptonews.ru1h ago

Why Bitcoin Holds Above $64,000 After Fed's Hard Pause

cryptonews.ru1h ago

Trading

Spot

Hot Articles

Discussions

Welcome to the HTX Community. Here, you can stay informed about the latest platform developments and gain access to professional market insights. Users' opinions on the price of ETH (ETH) are presented below.

活动图片














