Ethereum Shows Signs Of Strength With Stronger Network Activity Supporting Growth

bitcoinistPublished on 2026-05-14Last updated on 2026-05-14

Abstract

Despite a slight price pullback, Ethereum's fundamentals show strength, driven by robust network activity and transaction growth. The altcoin has broken out of a multi-year consolidation phase, suggesting potential for significant upward movement. Over 7.33 million ETH (6% of supply) is locked on corporate balance sheets, and Ethereum's inflation rate is now lower than Bitcoin's post-Merge. Network performance is surging, with transaction volumes on the mainnet and Layer 2 solutions reaching all-time highs. Ethereum maintains a dominant 55-60% share of the Total Value Locked (TVL) in DeFi since mid-2022, reinforced by deep collateral markets and proven resilience. It hosts 50% of all stablecoin market capitalization and over 60% of tokenized real-world assets, indicating strong institutional trust and sticky capital. Experts note the fundamentals are aligning with the positive technical chart setup, strengthening investor conviction in Ethereum's long-term value.

While the price of Ethereum may have slightly pulled back, the underlying structure and fundamentals continue to show signs of strength. At the same time, the ETH network is demonstrating robust performance as transaction activity sees a steady increase across the blockchain.

Growing Network Strength Pushes Ethereum Back Into Focus

Ethereum’s recent upward momentum in the past few days is not only seen in its price action. This renewed strength is being observed across the ETH ecosystem as the network’s performance surges, which is triggering fresh momentum in the market.

During the period, there has been rising transaction activity, stronger on-chain engagement, and continued growth in key sectors that appear to be strengthening investors’ conviction in the network’s long-term value.

After examining the ETH chart in the monthly time frame, Leon Waidmann, a market expert and head of research at Lisk, revealed that the altcoin is currently exhibiting a trend that has caught the attention of the market. The chart shows a three-year sideways consolidation in a clean range supported by a breakout. Specifically, the momentum indicator at the bottom just broke out of its multi-year base.

ETH has been ranging since 2023, and building energy at the base of the structure. After a period of building strength, the altcoin has broken above the multi-year resistance, which has created a classic accumulation before a major move.
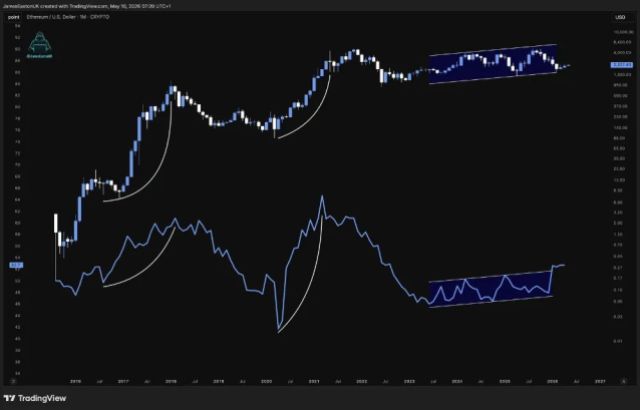
Source: Chart from Leon Waidmann on X

Consolidation phases are sometimes a positive reaction as they can precede upside movement. Waidmann noted that the longer the consolidation phase, the bigger the move out of it will be. What makes this period interesting is the increased network performance that is coinciding with the current momentum.

As stated by the expert, over 7.33 million ETH, representing 6% of all ETH supply, are locked on corporate balance sheets. Furthermore, inflation across the ETH ecosystem is currently lower than that of Bitcoin since the introduction of the Merge update. Other significant achievements include the surge in transactions on the ETH mainnet and layer 2 solutions, reaching new all-time highs. “The fundamentals are catching up, and the chart is setting up,” Waidmann added.

ETH Dominating DeFi And Lending

Etherealize has shared a recent report from Galaxy Research regarding Ethereum. In the report, the platform’s VP Research noted that ETH’s TVL market share has held remarkably steady at roughly 55% to 60% since mid-2022. The ETH network is witnessing notable liquidity, reinforcing its dominance in lending and DeFi.

This is due to the depth of its collateral markets, oracle infrastructure, and surviving multiple market crashes. Such development leads to the creation of a trust premium that newer chains cannot quickly replicate, particularly for the largest allocators whose risk tolerance is the lowest.

Also, stablecoin issuance on the network has skyrocketed to 50% of all stablecoin market cap, and over 60% of all tokenized real-world assets are issued on ETH. According to the platform, this is possibly some of the stickiest capital on Ethereum because institutional RWA issuers select a chain after months of legal examination, custodian integration, and compliance sign-off.

ETH trading at $2,301 on the 1D chart | Source: ETHUSDT on Tradingview.com

Trending Cryptos

Related Questions

QDespite a slight price pullback, what shows signs of strength for Ethereum according to the article?

AThe underlying structure and fundamentals of Ethereum, particularly the robust network performance and steady increase in transaction activity, show signs of strength.

QWhat key on-chain metrics are strengthening investor conviction in Ethereum's long-term value?

ARising transaction activity, stronger on-chain engagement, and continued growth in key sectors are strengthening investor conviction.

QWhat did analyst Leon Waidmann note about Ethereum's multi-year consolidation phase on the monthly chart?

AHe noted that the longer the consolidation phase, the bigger the move out of it will be, describing it as a classic accumulation before a major move.

QWhat is Ethereum's approximate TVL (Total Value Locked) market share in DeFi since mid-2022, as cited in the Galaxy Research report?

AEthereum's TVL market share has held remarkably steady at roughly 55% to 60% since mid-2022.

QWhat specific achievements highlight Ethereum's dominance in stablecoins and tokenized real-world assets (RWAs)?

AStablecoin issuance on Ethereum is 50% of the total market cap, and over 60% of all tokenized real-world assets are issued on the network.

Related Reads

Why Bitcoin Holds Above $64,000 After Fed's Hard Pause

**Bitcoin Stabilizes Near $64,000 Following Hawkish Fed Pause** The cryptocurrency market, led by Bitcoin, remained stable around $64,000 despite a volatile reaction to the latest U.S. Federal Reserve meeting. The Fed paused interest rates but signaled a hawkish stance, with three committee members voting for an increase—the highest dissent since 2016. This limits risk appetite but hasn't triggered panic selling. Key market highlights include Bitcoin ETFs seeing a net inflow of $32.1 million, breaking a streak of outflows, while Ethereum ETFs experienced outflows of $18.65 million. Liquidations affected about 90,000 traders. Technically, Bitcoin finds support around $63,000-$63,500, with major resistance near $66,000. While its price is about 49% below its all-time high, institutional demand via ETFs and the absence of mass capitulation support a potential recovery scenario in the second half of the year. Major altcoins showed mixed movements, with Solana attracting capital while Ethereum faced selling pressure despite strong on-chain metrics like a growing staking queue. Regulatory news took a pause as the U.S. Senate delayed the CLARITY Act vote until at least autumn. For the final trading day of July, U.S. inflation and consumer spending data will be crucial. Bitcoin's key levels to watch are $63,000 support and $66,000 resistance. Sustained ETF inflows and Bitcoin holding above $63,000 are seen as positive signs for a potential market recovery later in the year.

cryptonews.ru1h ago

Why Bitcoin Holds Above $64,000 After Fed's Hard Pause

cryptonews.ru1h ago

Trading

Spot

Hot Articles

Discussions

Welcome to the HTX Community. Here, you can stay informed about the latest platform developments and gain access to professional market insights. Users' opinions on the price of ETH (ETH) are presented below.

活动图片















