Ethereum shows early accumulation signals – Can ETH’s demand sustain a breakout?

ambcryptoPublished on 2026-04-01Last updated on 2026-04-01

Abstract

Ethereum is showing early signs of accumulation as it trades near $2,130, approximately 11% below its Realized Price of $2,349. This narrow gap reduces loss-driven selling, with the NUPL at -0.04 indicating mild unrealized losses rather than full capitulation. The MVRV Ratio of 0.86 suggests the average holder remains about 14% underwater, limiting panic selling and signaling a late-stage correction. A rising Taker Buy/Sell Ratio near 1.13 across exchanges points to increasing buyer aggression, reminiscent of the pre-rally conditions in April-May 2025. While short-term price action shows low conviction, the convergence of these metrics suggests accumulation is underway, with limited downside risk barring new shocks, setting the stage for a potential sustained recovery.

Ethereum [ETH] is moving through a quiet but decisive phase, where price and holder behavior begin to converge. At the time of writing, ETH traded near $2,130, about 11% below its $2,349 Realized Price, placing most holders close to breakeven.

Source: Glassnode

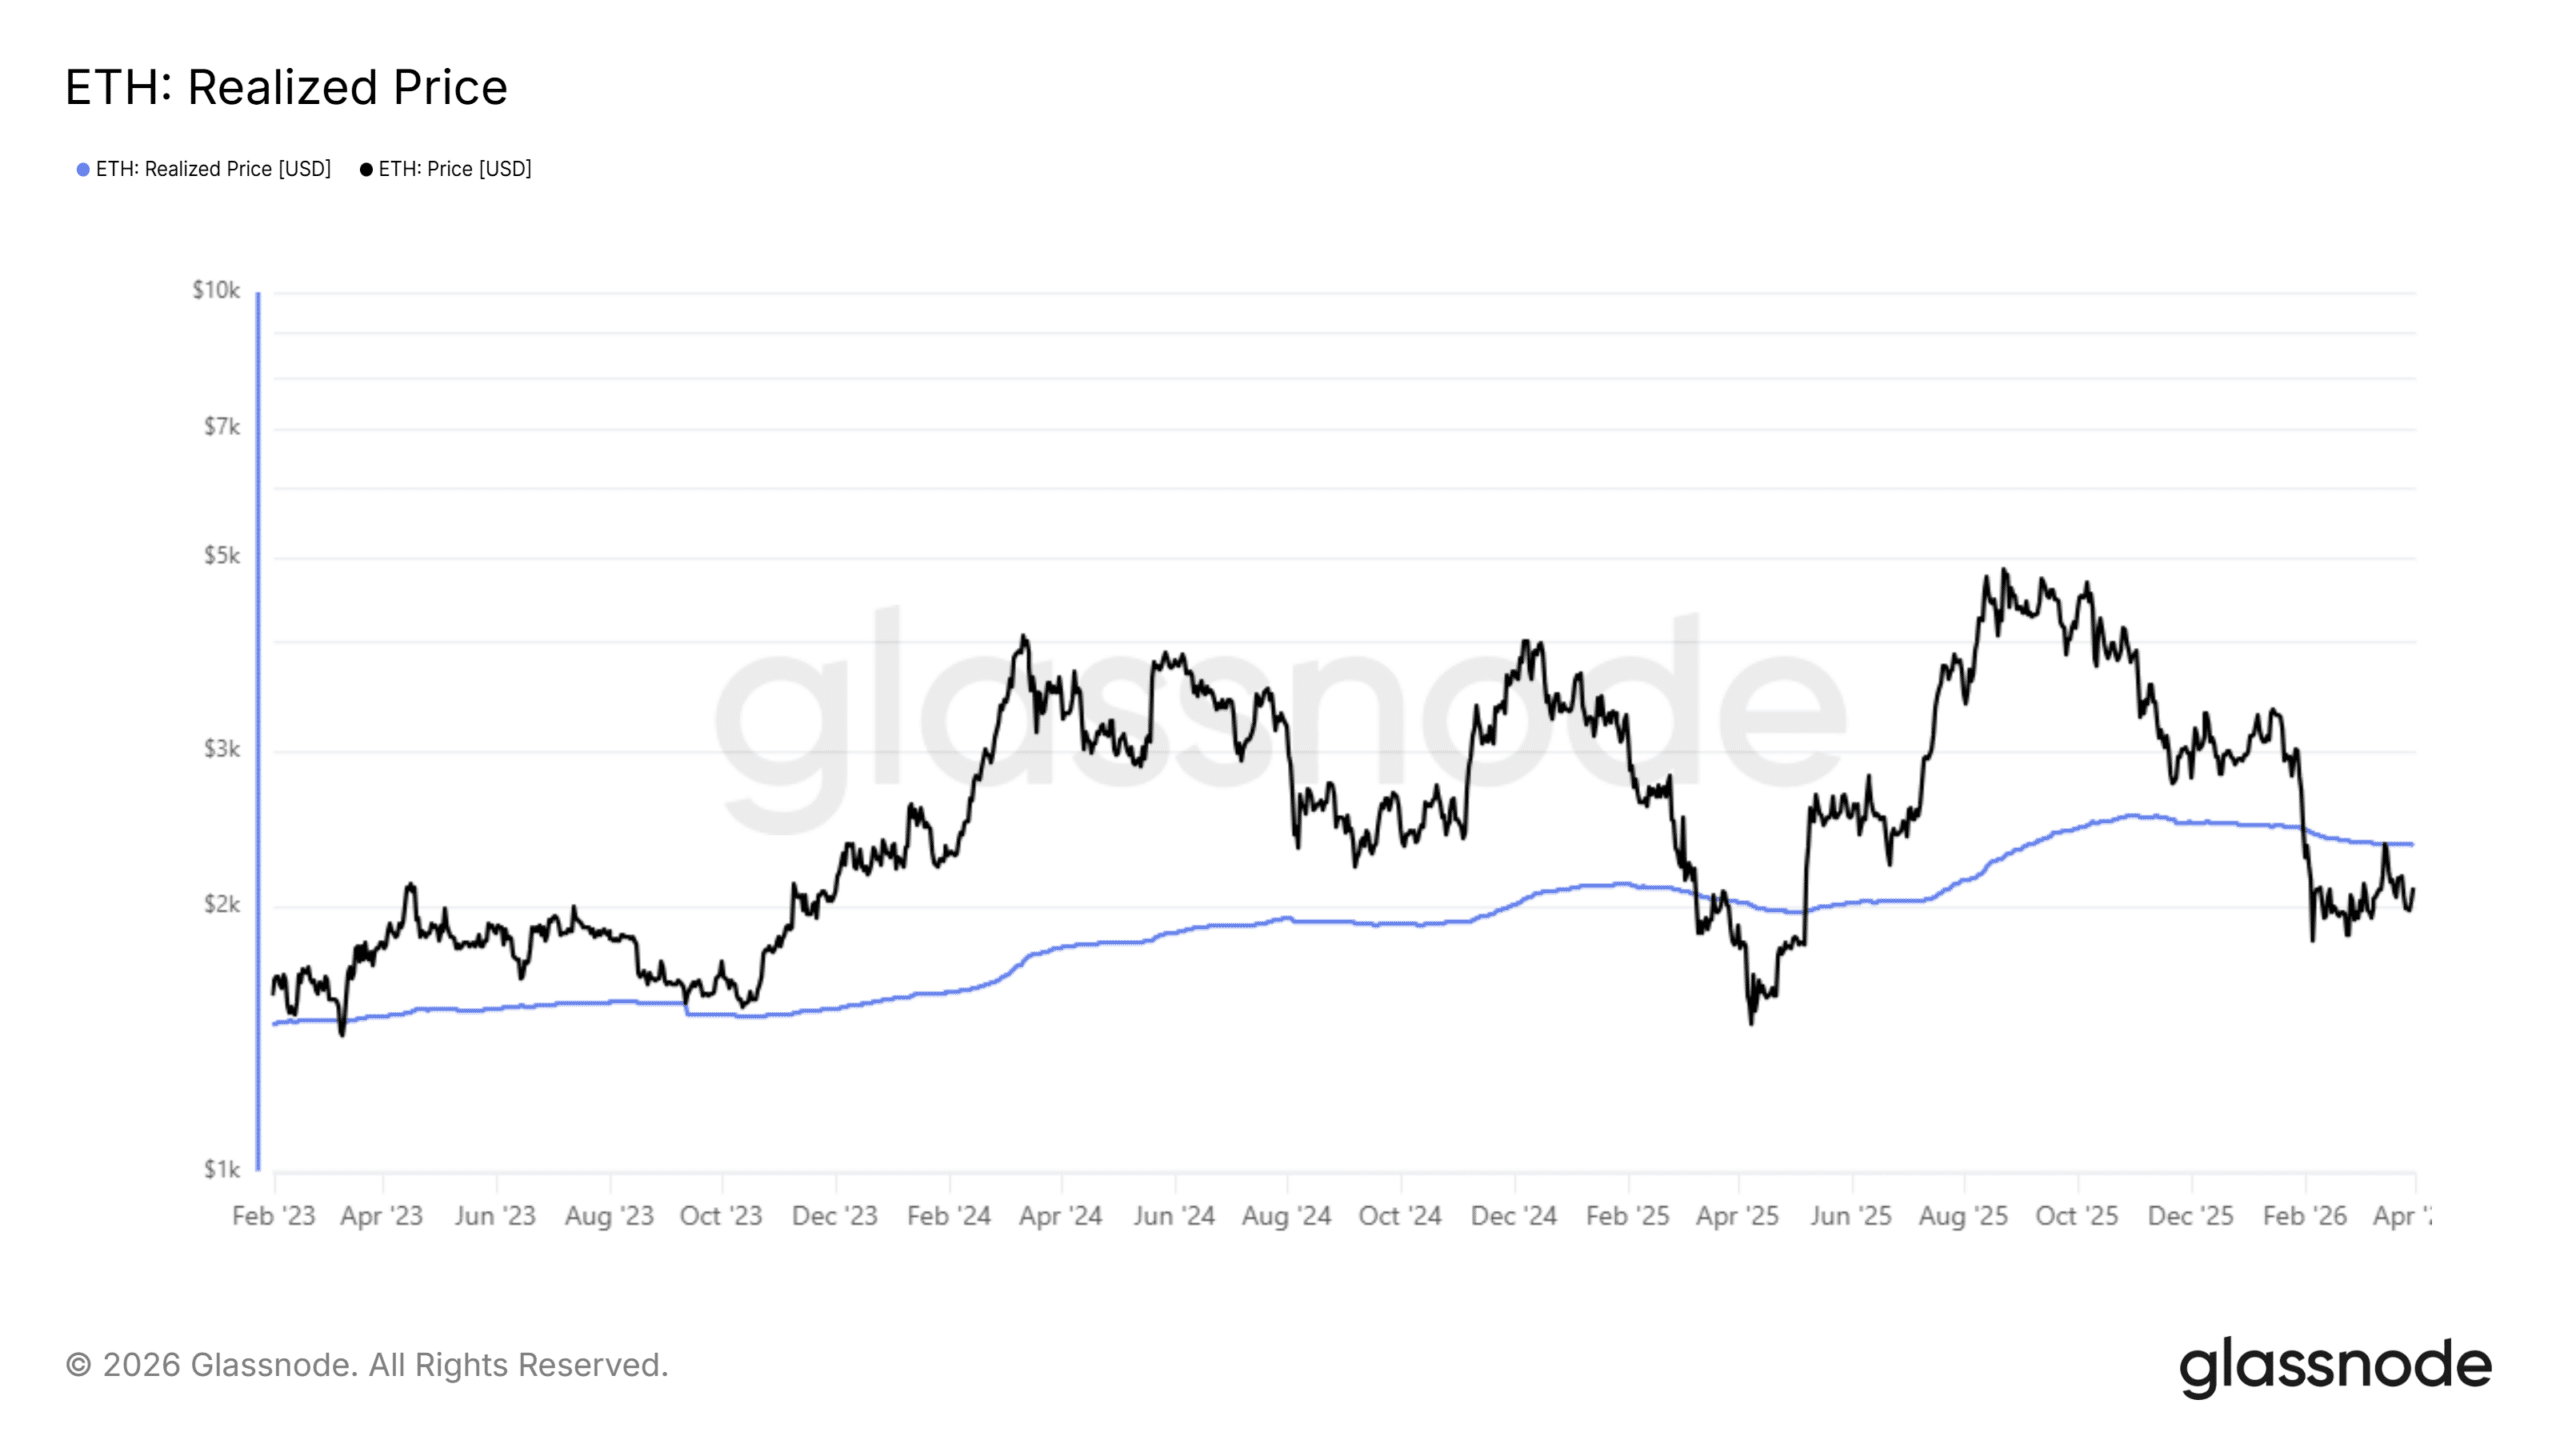
This narrowing gap reduces loss-driven selling, since fewer participants face pressure to exit at a loss. Meanwhile, the NUPL at -0.04 confirms mild Unrealized Losses rather than full capitulation.

Selling pressure is easing, while the market enters a decision phase between accumulation and further decline.

Short-term moves, with a +0.55% daily gain and a -3.13% weekly drop, reflect low conviction. This implies Ethereum is stabilizing, where holding this level may attract buyers, while failure risks renewed downside pressure.

Ethereum MVRV signals late-stage correction zone

As Ethereum holds near breakeven levels, valuation metrics begin to explain why selling pressure is fading and what may come next.

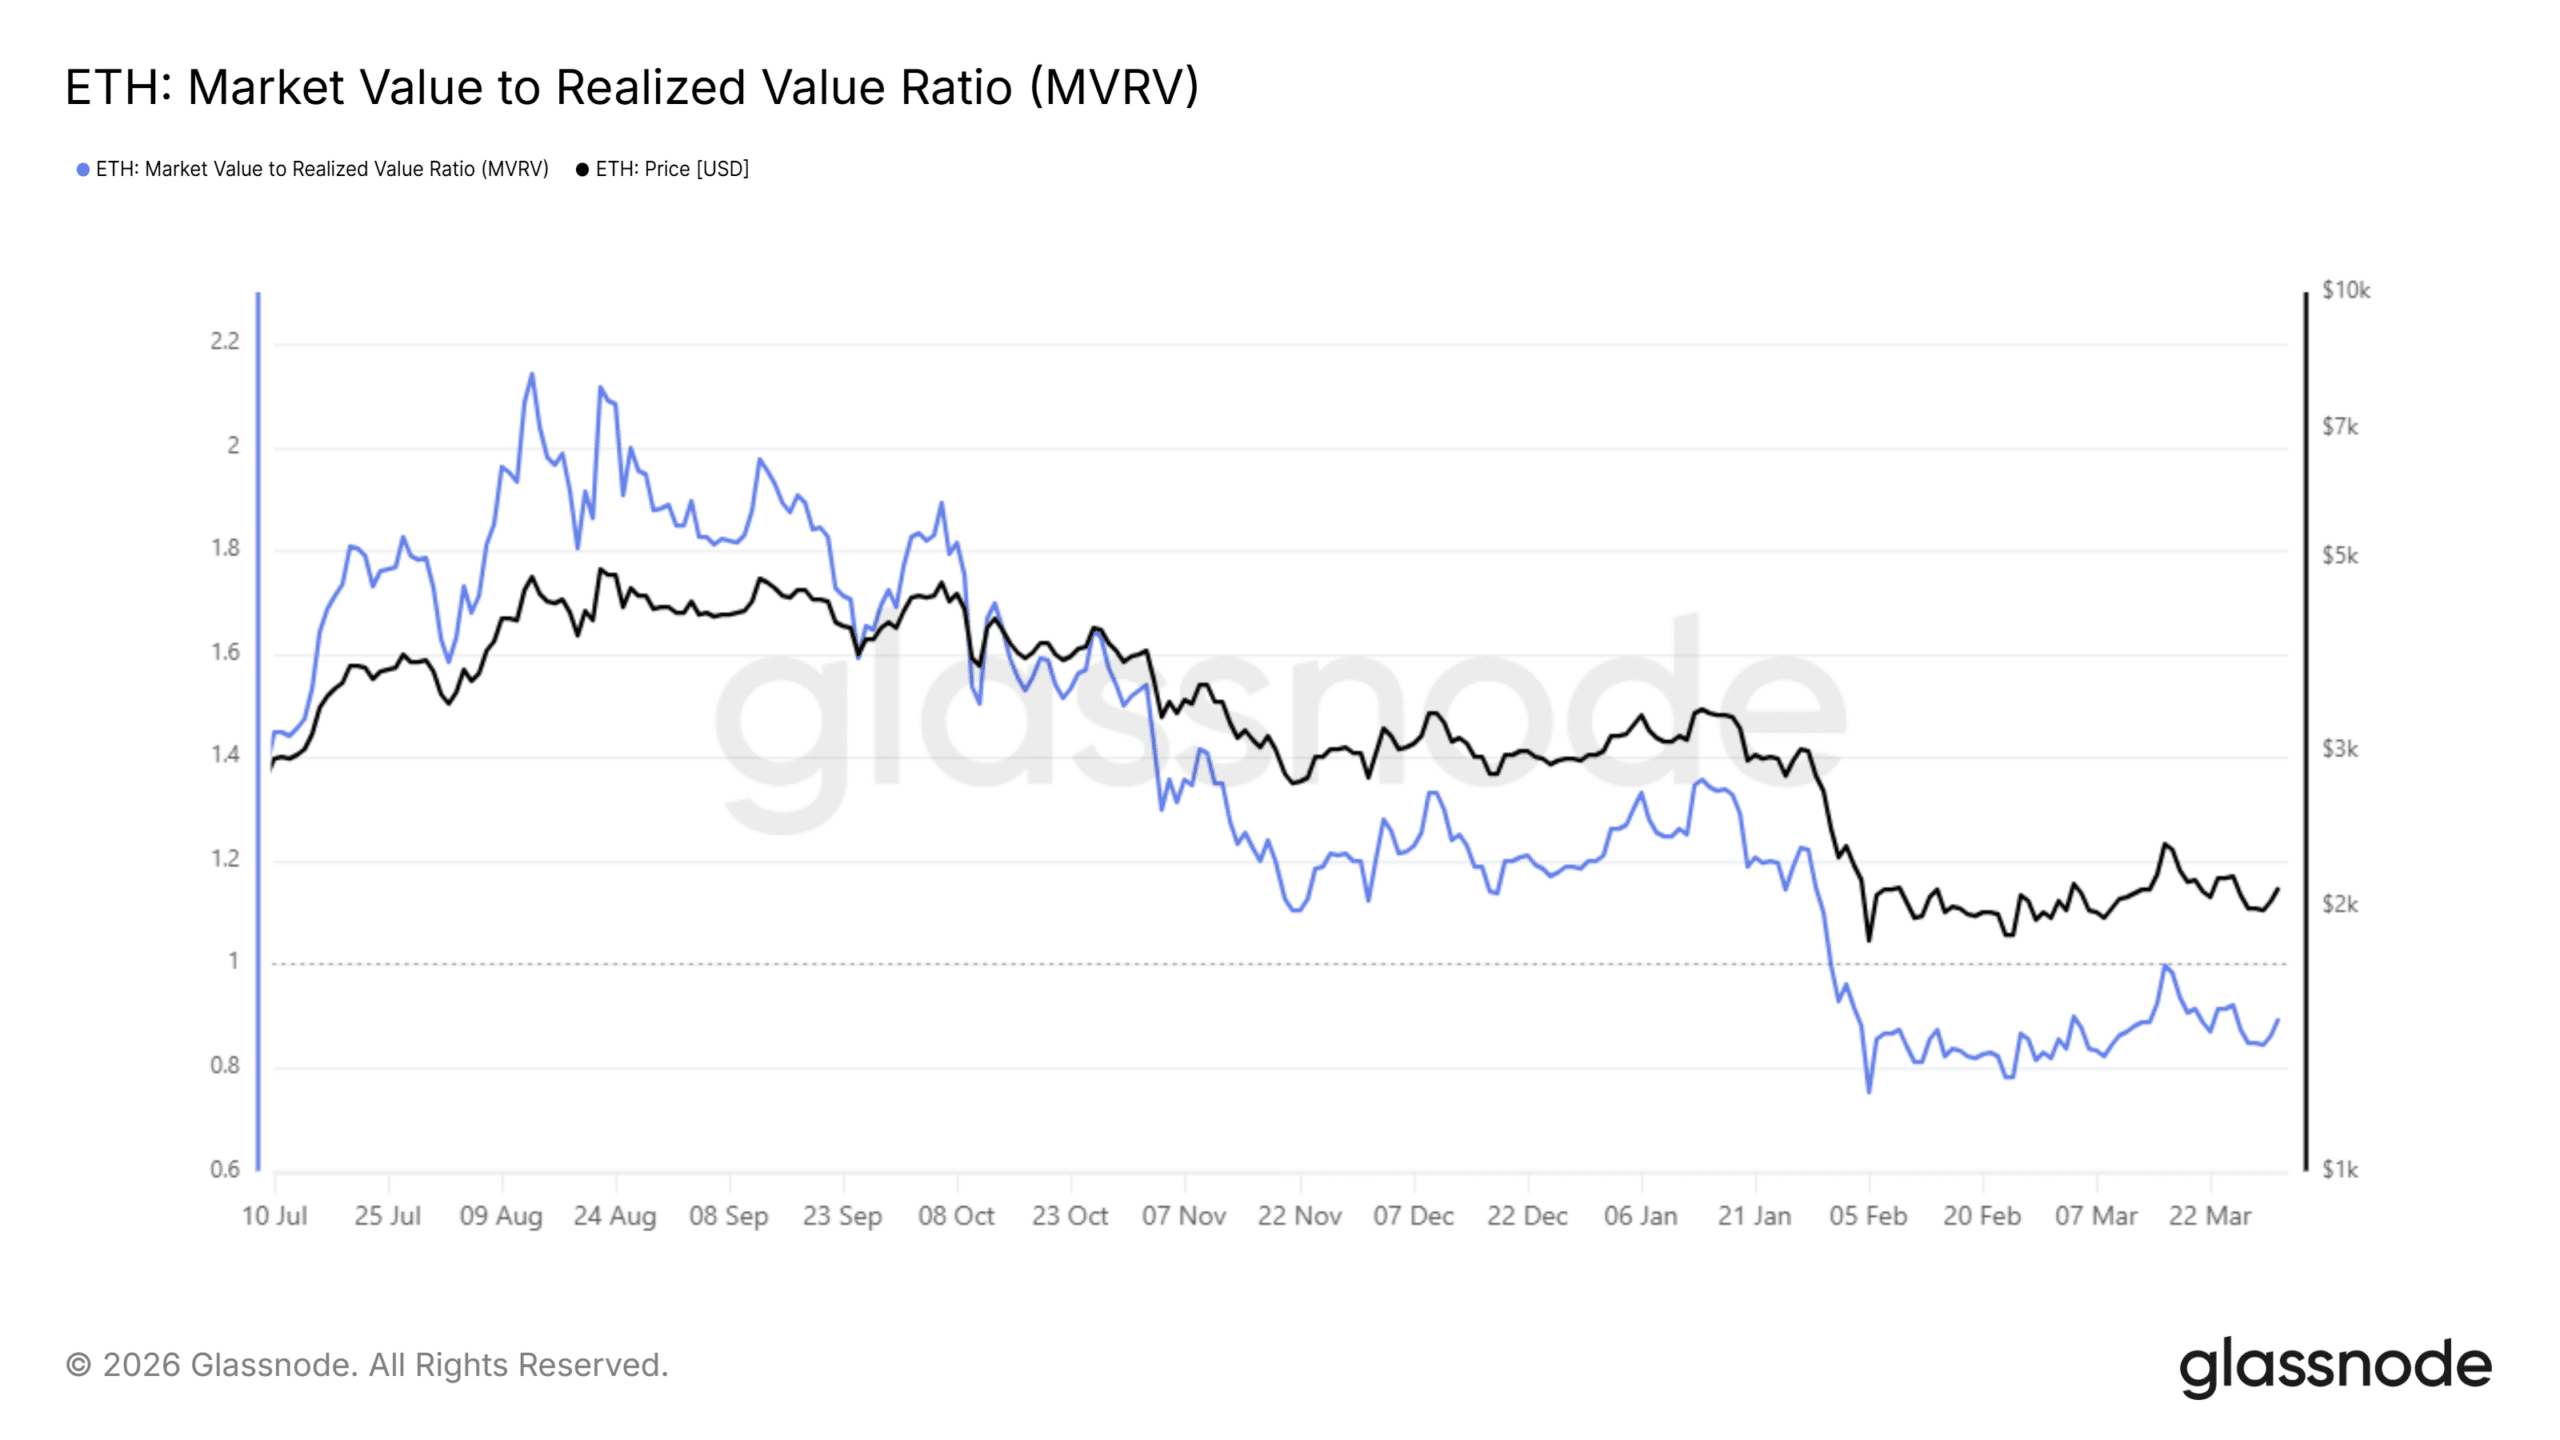
The MVRV Ratio sits around 0.86, meaning the average holder remains roughly 14% underwater, which keeps sentiment cautious but reduces panic selling.

Source: Glassnode

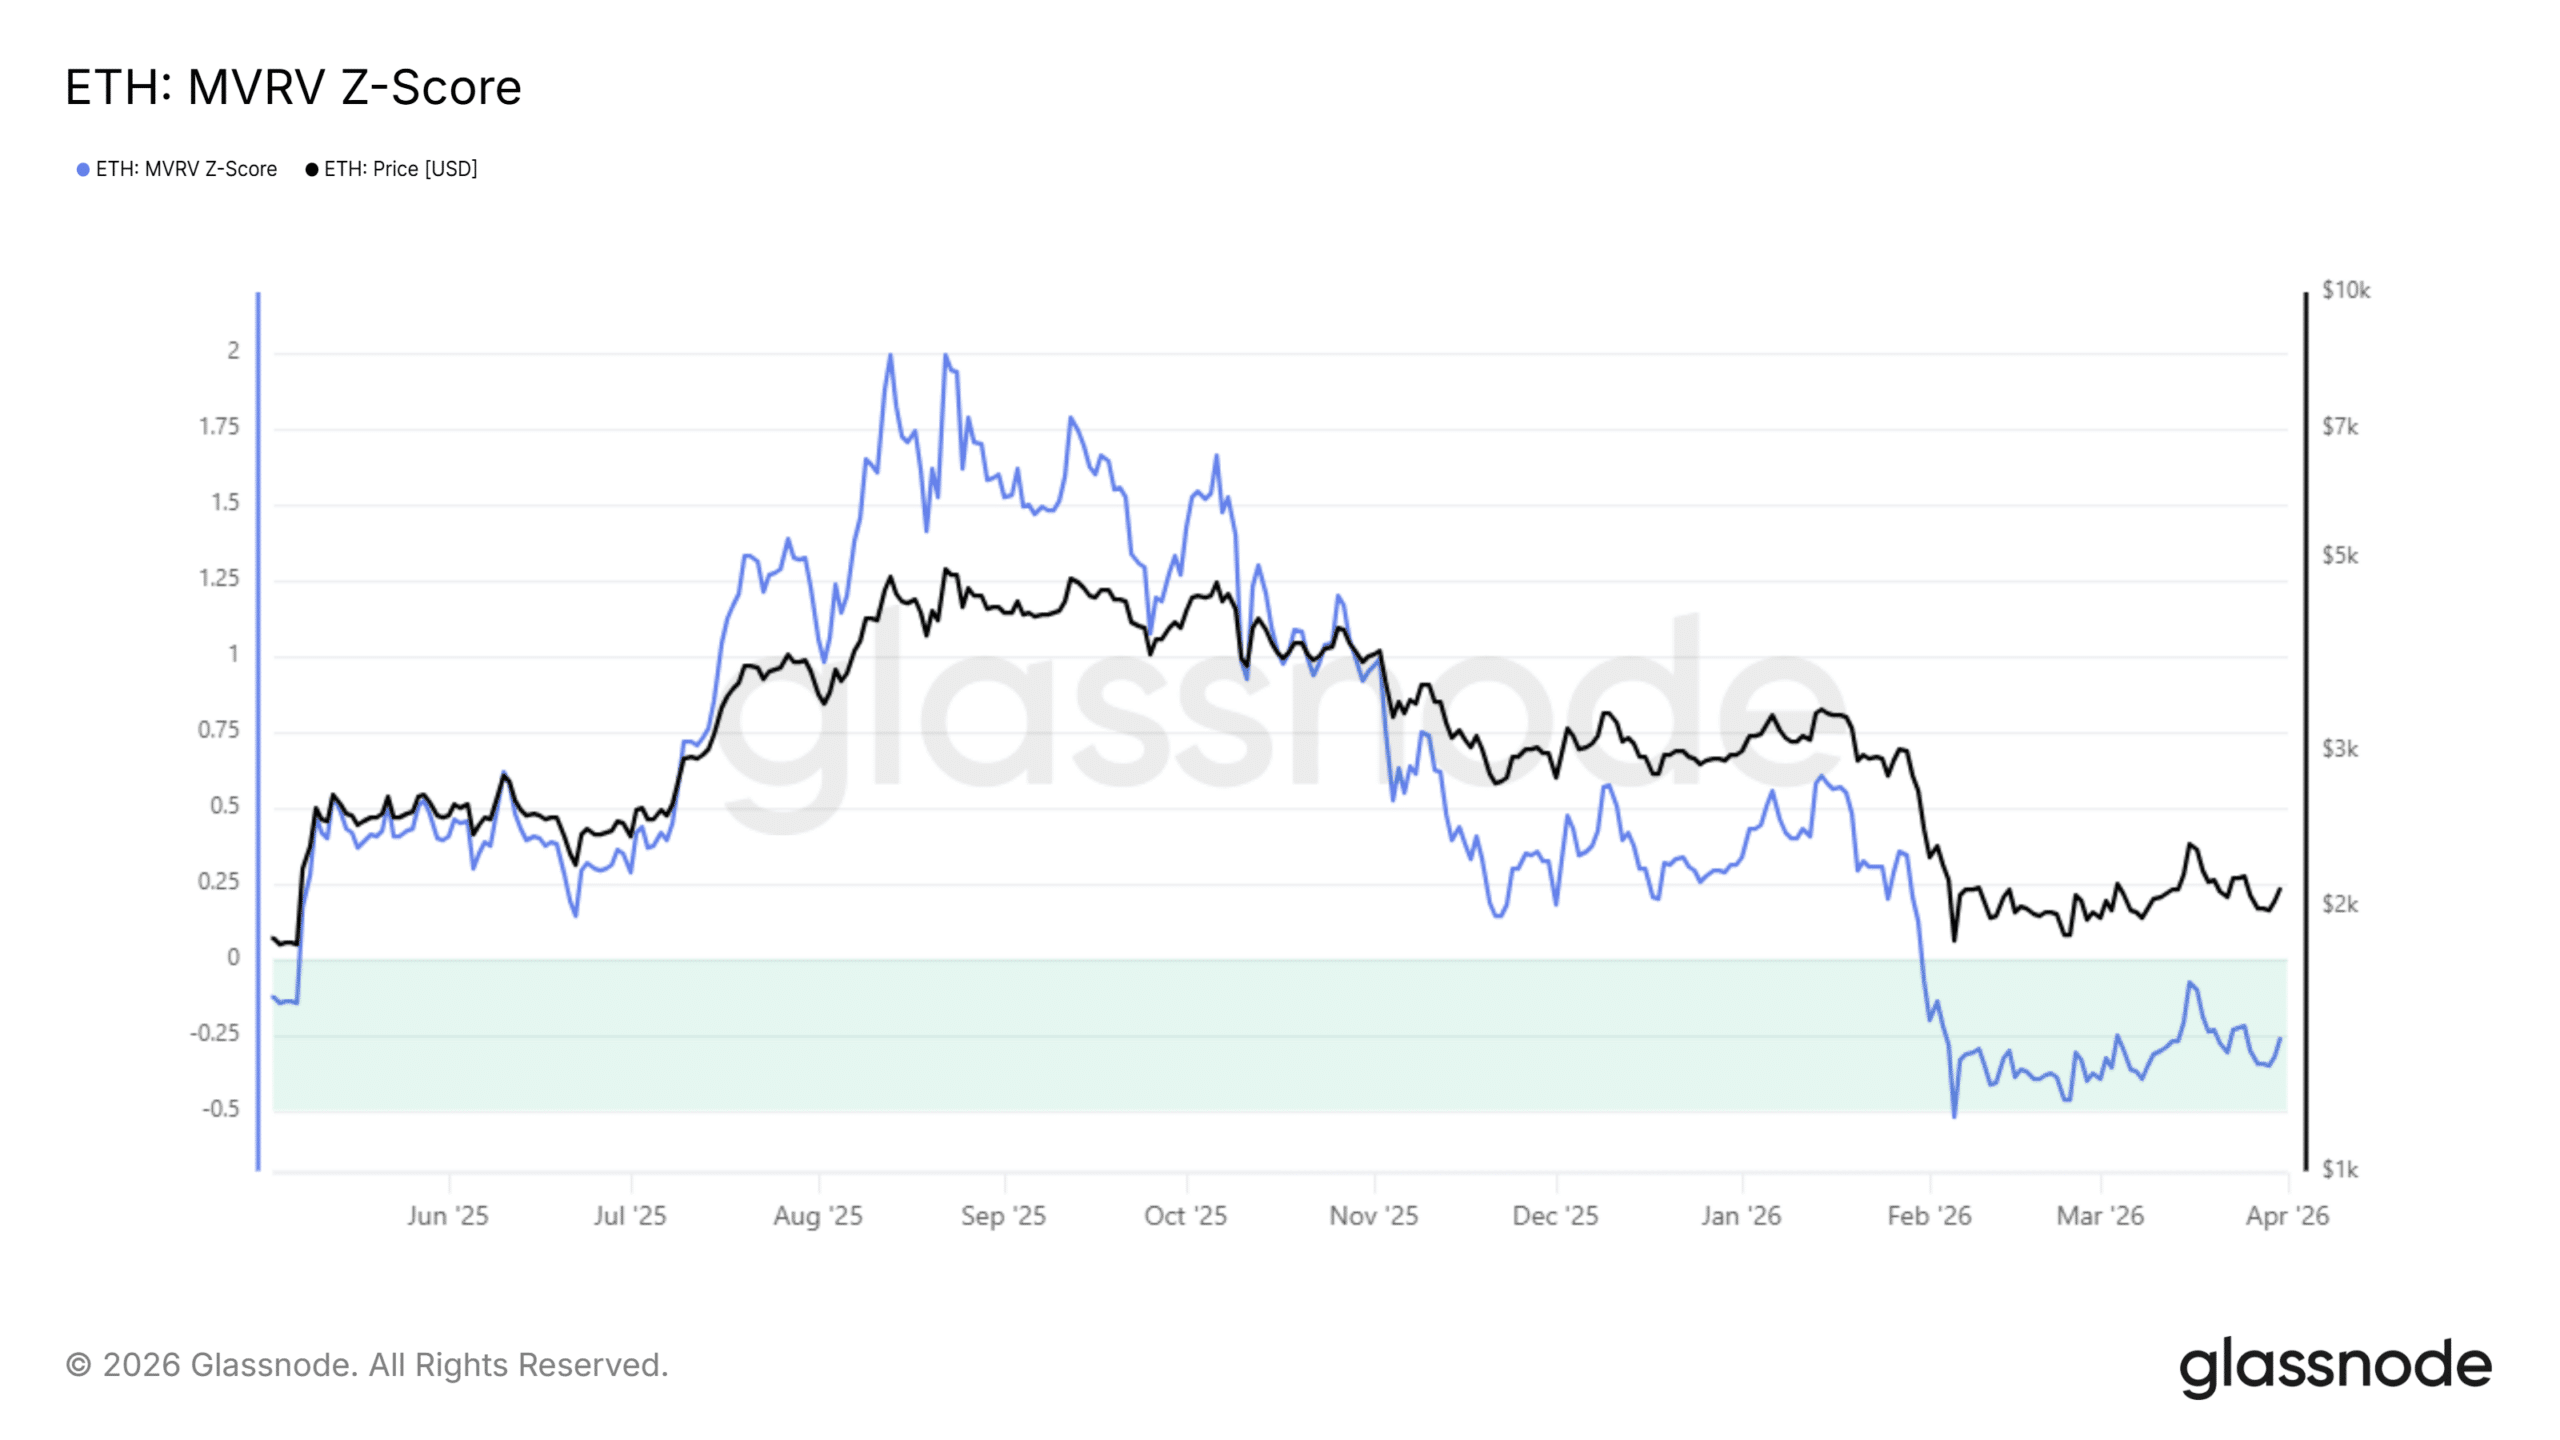
This happens because most losses have already been realized, leaving fewer weak hands to exit. Meanwhile, the MVRV Z-Score stays slightly negative, near -0.25 to -0.30, reinforcing that price trades below fair value.

Source: Glassnode

This shift changes market behavior, as sellers lose urgency while buyers start positioning gradually. The market is no longer driven by forced exits but by selective accumulation.

In fact, this implies that the downside is limited without new shocks, while slow demand rebuild can support a base before any sustained recovery.

ETH taker flow signals early accumulation

As Ethereum’s undervaluation limits further downside, order flow now reveals how demand is rebuilding beneath the surface.

The Taker Buy/Sell Ratio is trending upward across all exchanges, recently pushing near 1.13, which shows buyers are increasingly lifting offers.

Source: CryptoQuant

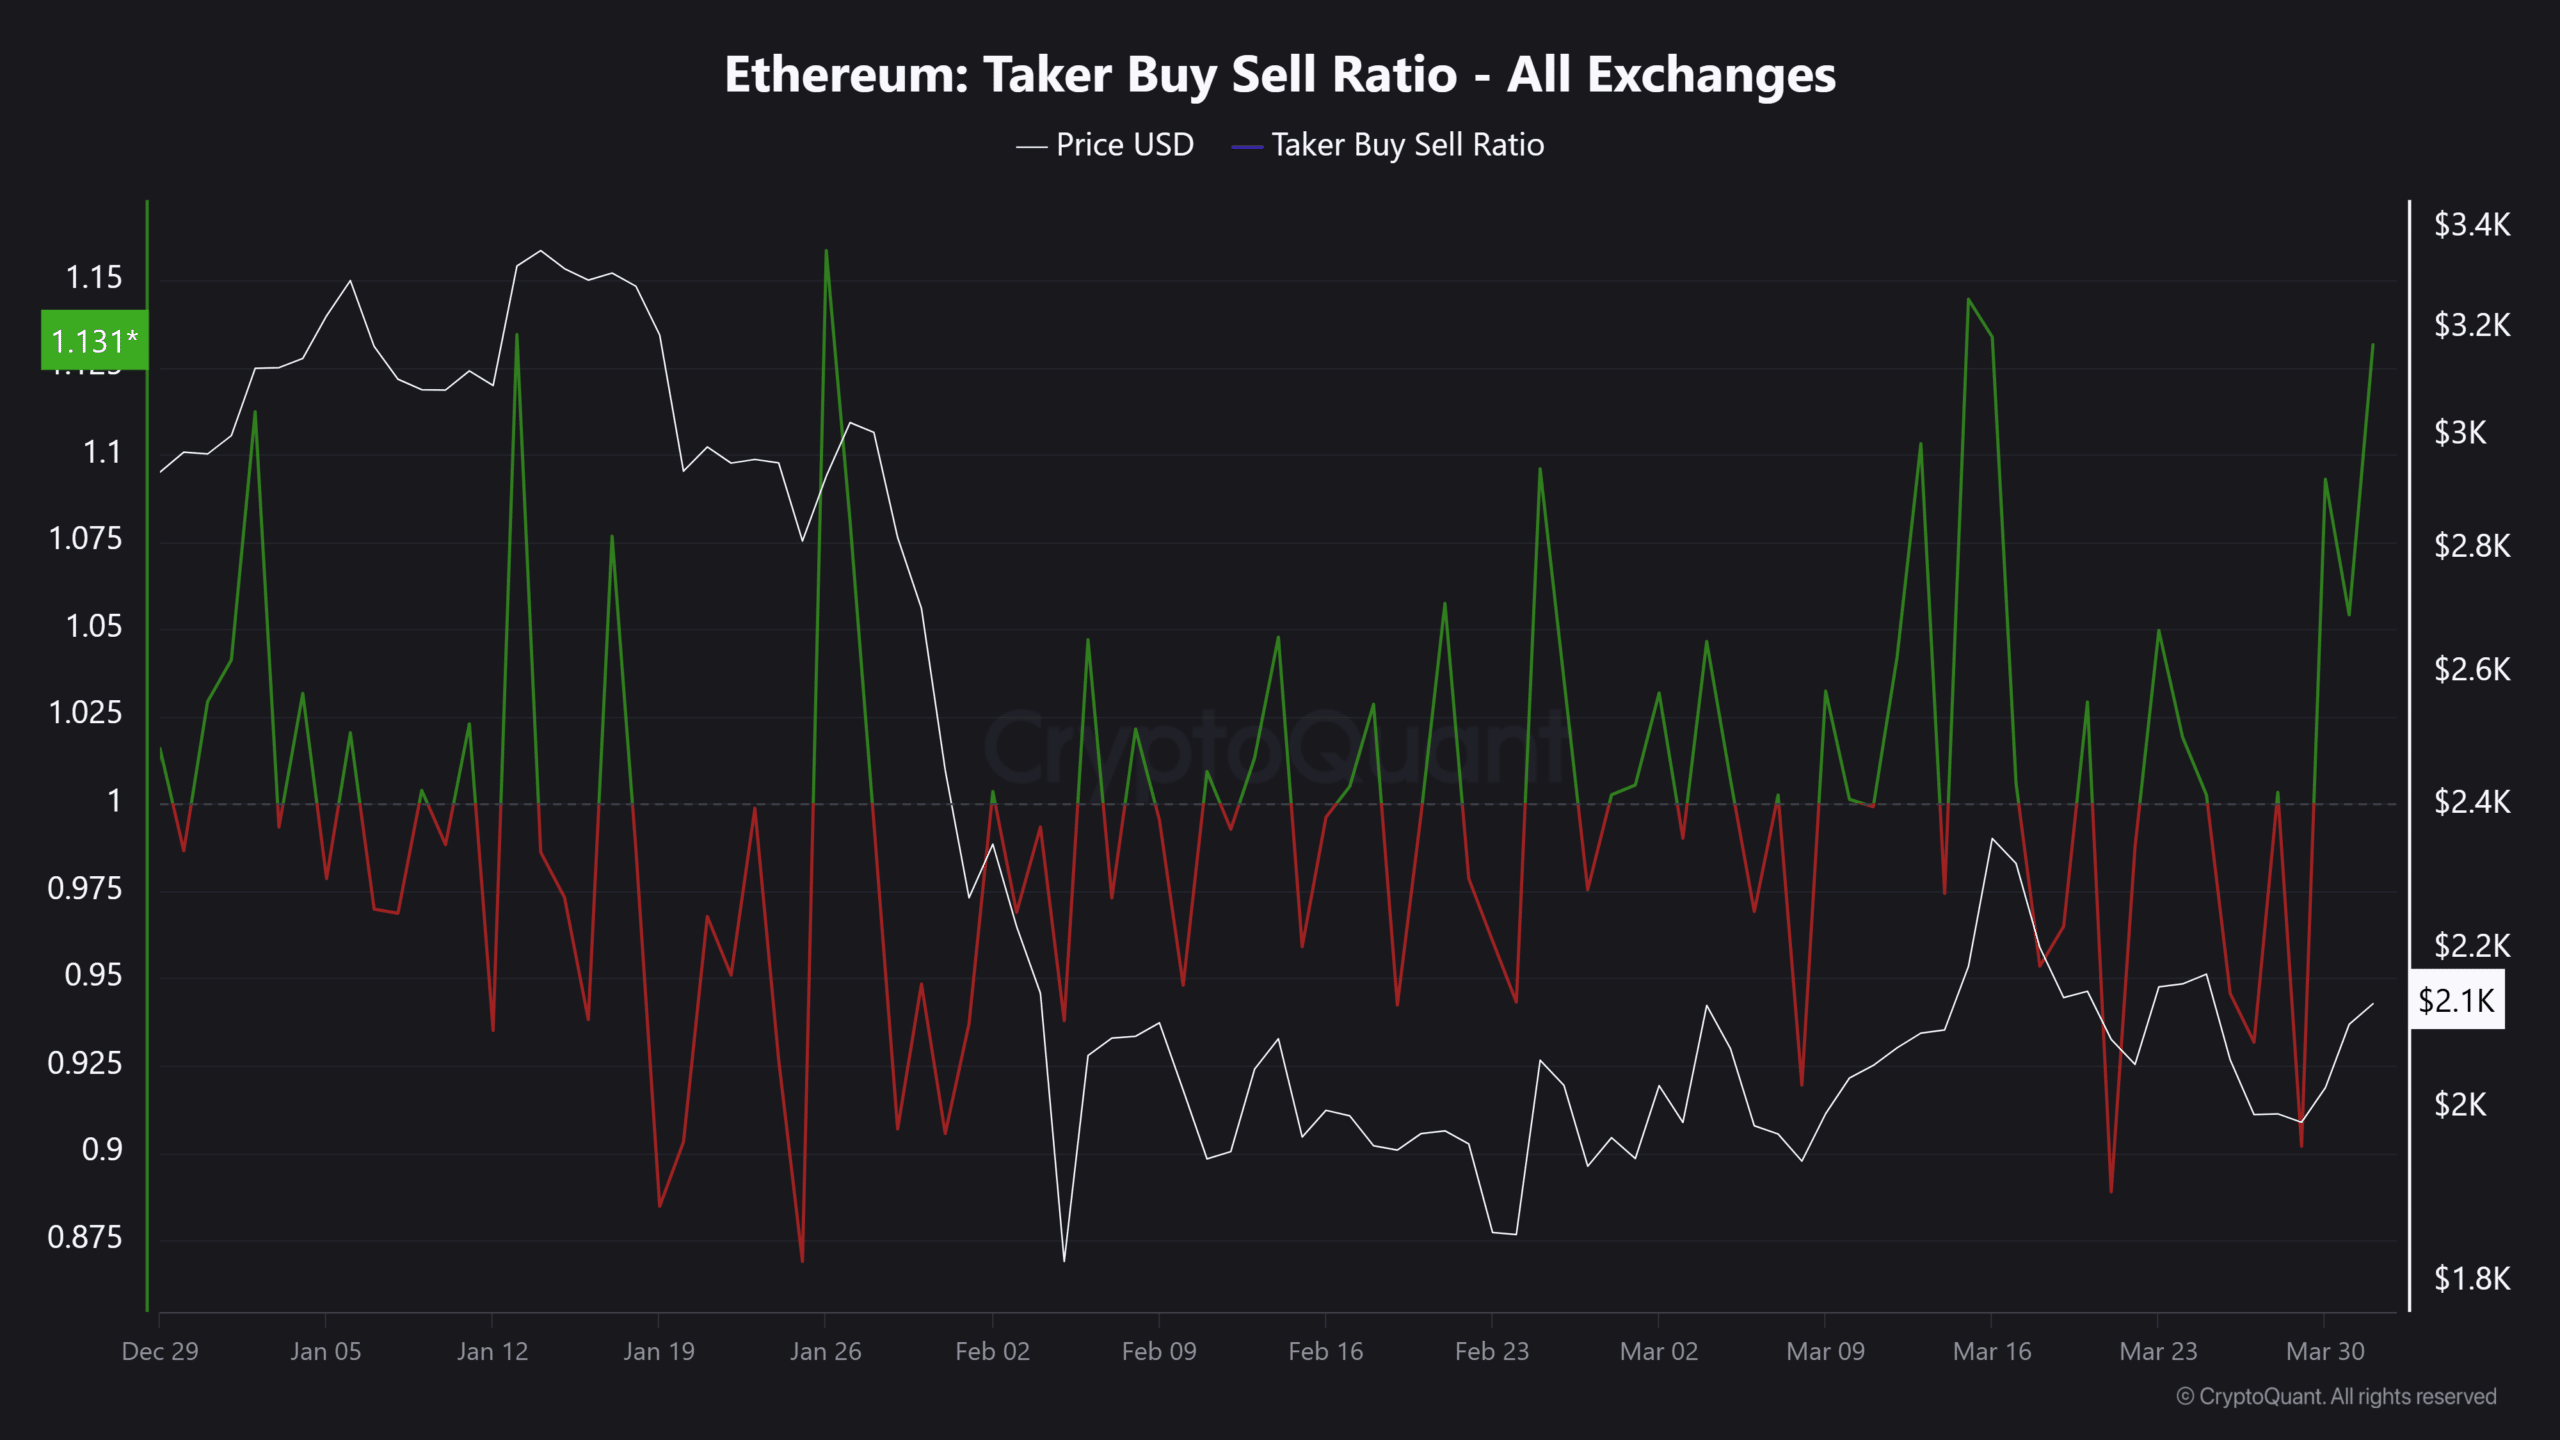
This structure mirrors the setup seen before the April–May 2025 rally, hinting at early demand buildup. As this develops, repeated spikes above 1.0 confirm sustained taker-side aggression rather than passive positioning.

Meanwhile, price remains near $2,100, showing demand is emerging without immediate expansion. This shift occurs while MVRV holds near 0.86, keeping ETH undervalued.

This interaction signals accumulation in progress, where consistent buying pressure may gradually translate into a stronger directional move.


Final Summary

  • Ethereum’s compression near Realized Price and MVRV at 0.86 signals reduced selling pressure and early-stage accumulation conditions.
  • The rising Taker Buy Ratio above 1.0 shows growing demand, but the price remains range-bound until stronger conviction emerges.

Related Questions

QWhat is Ethereum's current trading price and how does it compare to its Realized Price?

AEthereum is currently trading near $2,130, which is approximately 11% below its Realized Price of $2,349.

QWhat does the NUPL value of -0.04 indicate about the market?

AThe NUPL (Net Unrealized Profit/Loss) value of -0.04 confirms that the market is experiencing mild Unrealized Losses rather than full capitulation.

QWhat is the significance of the MVRV Ratio sitting at 0.86 for Ethereum?

AAn MVRV Ratio of 0.86 means the average holder is roughly 14% underwater, which keeps market sentiment cautious but reduces panic selling, indicating the asset is undervalued.

QWhat does a Taker Buy/Sell Ratio above 1.0, specifically near 1.13, signal for ETH?

AA Taker Buy/Sell Ratio trending upward and near 1.13 indicates that buyers are increasingly lifting offers, showing early demand buildup and accumulation.

QAccording to the article, what are the two key conditions signaling reduced selling pressure and early accumulation for Ethereum?

AThe two key conditions are: 1) Ethereum's price compression near its Realized Price with an MVRV of 0.86, and 2) a rising Taker Buy Ratio consistently above 1.0.

Related Reads

The Value Distribution of Stablecoins

**Summary: The Value Distribution of Stablecoins** The article argues that stablecoins are evolving from mere trading tools into broader channels for dollar access. It divides the stablecoin ecosystem into four layers to analyze how value is distributed: 1. **Issuance Layer:** Mints stablecoins, holds reserve assets, and captures the spread between reserve yield and user costs (e.g., Tether, Circle). This layer currently earns the largest profit margin. 2. **Infrastructure Layer:** Connects stablecoins to the traditional financial system, handling fiat on/off-ramps, banking integration, compliance (KYC/AML), and asset management (e.g., Bridge, BVNK). This is the "unglamorous" but critical work, building the essential bridges between crypto and real-world finance. 3. **Acquiring/Distribution Layer:** Integrates stablecoins into merchant systems, manages payment flows, and provides enterprise financial software (e.g., Stripe, Coinbase). They act as the access point for businesses. 4. **Application Layer:** The end-users and businesses that ultimately use stablecoins for payments, settlements, or as a store of value. They benefit from convenience but have little pricing power. The core thesis is that while the issuance layer currently dominates profits, the often-overlooked **infrastructure layer holds significant long-term potential**. The real challenge and barrier to mass adoption is not the on-chain transfer of stablecoins (which is simple), but the complex "last mile" integration into existing business workflows, banking systems, and regulatory frameworks across different countries. Companies in this layer are currently in a "land grab" phase, investing heavily to build networks, secure bank partnerships, and establish compliance pathways. While their position is currently pressured by the profitable issuers above and distribution platforms below, the article suggests that if stablecoins become a default financial rail for businesses, the infrastructure providers who have done the hard work of integration will ultimately gain strong pricing power and become entrenched, essential players.

marsbit5h ago

The Value Distribution of Stablecoins

marsbit5h ago

The Value Distribution of Stablecoins

The Value Distribution of Stablecoins The article argues that stablecoins are evolving from a mere trading tool into a broad "dollar channel." It analyzes the industry's value chain through four layers: 1. **Issuance Layer (e.g., Tether, Circle):** The top layer that mints stablecoins, holds reserve assets, and captures the thickest interest rate spread. 2. **Infrastructure Layer (e.g., Bridge, BVNK):** Connects stablecoins to the traditional financial system, handling critical but complex "dirty work" like fiat on/off-ramps, banking integration, compliance (KYC/AML), and cross-border settlement. 3. **Acquiring/Distribution Layer (e.g., Stripe, Coinbase):** Embeds stablecoins into merchant systems, manages payment flows, and integrates with enterprise software. 4. **Application Layer:** End-users and businesses that ultimately use stablecoins for payments, settlement, or storing value. The author posits that while the issuance layer currently captures the most profit, the most overlooked and potentially critical layer is infrastructure. The core challenge for stablecoin adoption isn't the on-chain transfer (which is simple), but bridging the gap between blockchain and the real-world financial system. This involves solving practical problems for businesses: fiat conversion, reconciliation, tax handling, and user onboarding. Infrastructure companies are currently in a difficult "land-grab" phase—building networks, securing banking relationships, and achieving compliance country-by-country. They face pressure from both the profitable issuance layer above and distribution platforms below. However, the author suggests this layer is building a crucial moat. Once stablecoins become a default business rail, the infrastructure players who have done the hard work of integration may gain significant, durable value and pricing power.

链捕手5h ago

The Value Distribution of Stablecoins

链捕手5h ago

Trading

Spot
Futures

Hot Articles

Discussions

Welcome to the HTX Community. Here, you can stay informed about the latest platform developments and gain access to professional market insights. Users' opinions on the price of ETH (ETH) are presented below.

活动图片