Ethereum Shows Early Accumulation Signals As Binance Buy Pressure Intensifies

bitcoinistPublished on 2026-01-03Last updated on 2026-01-03

Abstract

Ethereum has surpassed the $3,000 level, offering short-term relief after a period of consolidation. On-chain data indicates early accumulation signals, with Binance’s Taker Buy/Sell Ratio reaching 1.005—its highest since July—suggesting growing bullish sentiment among derivatives traders. This increase in aggressive buy orders reflects early positioning rather than reaction to strong upward momentum. However, derivatives-driven optimism alone is insufficient for a sustained rally. Confirmation from stronger spot demand, higher resistance breaks, and on-chain activity is critical to validate a trend reversal. Without broader market support, derivatives-led price moves may fade.

Ethereum has managed to push above the psychologically important $3,000 level, offering a brief sense of relief after weeks of compression and indecision. While this move marks a constructive short-term development, price action remains far from the technical thresholds required to fully reestablish a broader uptrend.

Against this backdrop, on-chain and derivatives data are beginning to show subtle but notable changes. A CryptoQuant analysis reveals that Ethereum’s 14-day moving average of the Taker Buy/Sell Ratio on Binance has climbed to 1.005, its highest reading since July. A ratio above 1 indicates that aggressive market buy orders are outweighing sell orders, pointing to growing bullish intent among derivatives traders.

The report explains that ETH remains significantly below its prior cycle highs, meaning this increase in aggressive buying is not a reaction to strong upside momentum. Instead, it suggests early positioning or accumulation behavior, where market participants are entering ahead of a potential directional move rather than chasing price.

Still, derivatives-driven optimism alone is not sufficient to confirm a trend reversal. For Ethereum to transition from recovery to sustained upside, this improving aggression must be accompanied by stronger spot demand and a decisive reclaim of higher resistance levels.

Derivatives Aggression Builds, but Confirmation Remains Critical

The analysis adds that, historically, sustained periods in which Ethereum’s Taker Buy/Sell Ratio remains above 1—particularly when reinforced by a rising moving average—have often aligned with phases of increasing bullish volatility or early attempts at trend reversals.

This behavior reflects a growing sense of urgency among buyers who are willing to execute at market prices rather than wait for pullbacks, a dynamic typically associated with improving sentiment and shifting expectations.
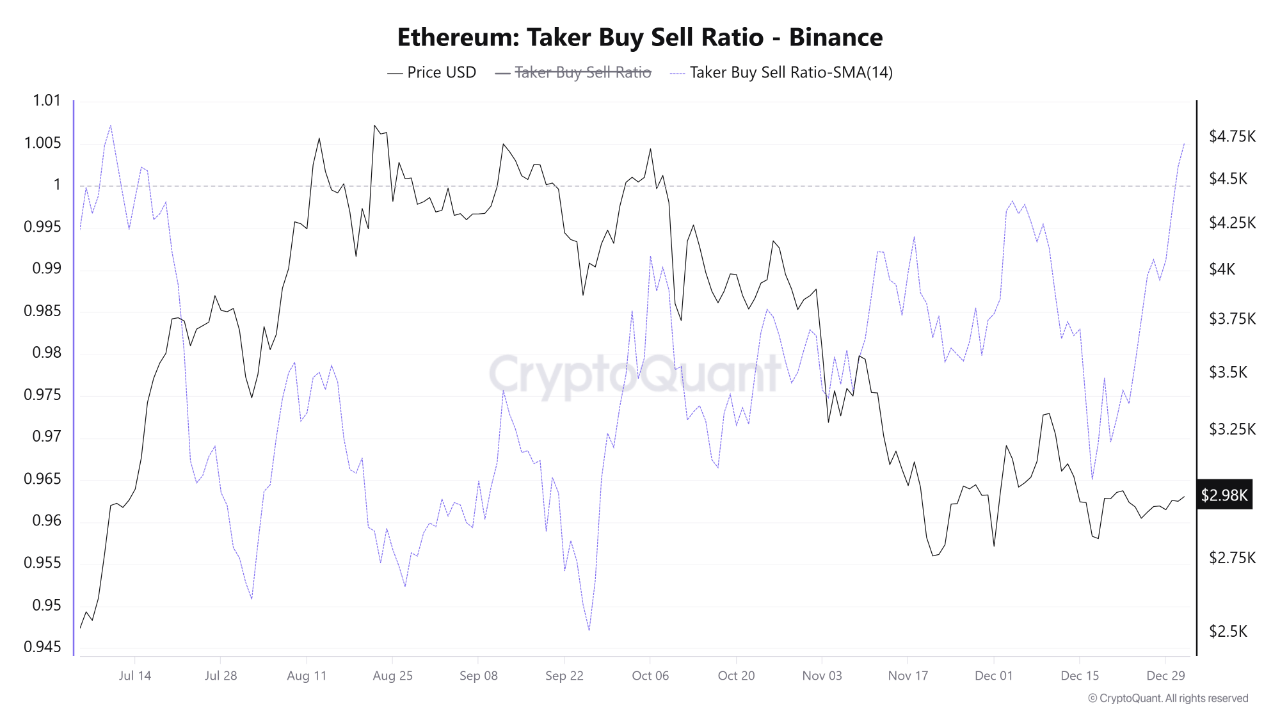
Ethereum Taker Buy Sell Ratio | Source: CryptoQuant

However, this signal carries important caveats. The Taker Buy/Sell Ratio is primarily a derivatives-focused metric, and elevated buy pressure in leveraged markets does not automatically translate into a durable rally.

Without confirmation from the spot market—such as rising spot volumes, net exchange outflows, or sustained on-chain accumulation—price reactions driven by derivatives activity can fade quickly. In past instances, leverage-heavy positioning has produced brief upside moves that were later unwound when real capital inflows failed to materialize.

At present, the structure suggests that aggressive buying pressure is indeed building within Ethereum’s derivatives market. This increases the probability of a recovery attempt, particularly if traders continue to position proactively rather than reactively.

Still, confirmation will depend on price follow-through above key resistance levels and alignment with broader indicators across spot demand, on-chain activity, and overall market liquidity.


Trending Cryptos

Related Questions

QWhat does a Taker Buy/Sell Ratio above 1 indicate on Binance's derivatives market for Ethereum?

AA Taker Buy/Sell Ratio above 1 indicates that aggressive market buy orders are outweighing sell orders, pointing to growing bullish intent among derivatives traders.

QAccording to the CryptoQuant analysis, what is the significance of Ethereum's current aggressive buying pressure?

AThe aggressive buying pressure suggests early positioning or accumulation behavior, where market participants are entering ahead of a potential directional move rather than chasing price, as ETH remains significantly below its prior cycle highs.

QWhat additional confirmation is needed for Ethereum to transition from recovery to sustained upside beyond derivatives-driven optimism?

AFor a sustained upside, the improving aggression in derivatives must be accompanied by stronger spot demand, such as rising spot volumes, net exchange outflows, or sustained on-chain accumulation, and a decisive reclaim of higher resistance levels.

QWhat historical pattern is associated with sustained periods of Ethereum's Taker Buy/Sell Ratio remaining above 1?

AHistorically, sustained periods where Ethereum's Taker Buy/Sell Ratio remains above 1—especially with a rising moving average—have often aligned with phases of increasing bullish volatility or early attempts at trend reversals.

QWhy can derivatives-driven price reactions fade quickly without confirmation from the spot market?

AWithout confirmation from the spot market, price reactions driven by derivatives activity can fade quickly because leverage-heavy positioning may produce brief upside moves that unwind when real capital inflows fail to materialize.

Related Reads

Why Bitcoin Holds Above $64,000 After Fed's Hard Pause

**Bitcoin Stabilizes Near $64,000 Following Hawkish Fed Pause** The cryptocurrency market, led by Bitcoin, remained stable around $64,000 despite a volatile reaction to the latest U.S. Federal Reserve meeting. The Fed paused interest rates but signaled a hawkish stance, with three committee members voting for an increase—the highest dissent since 2016. This limits risk appetite but hasn't triggered panic selling. Key market highlights include Bitcoin ETFs seeing a net inflow of $32.1 million, breaking a streak of outflows, while Ethereum ETFs experienced outflows of $18.65 million. Liquidations affected about 90,000 traders. Technically, Bitcoin finds support around $63,000-$63,500, with major resistance near $66,000. While its price is about 49% below its all-time high, institutional demand via ETFs and the absence of mass capitulation support a potential recovery scenario in the second half of the year. Major altcoins showed mixed movements, with Solana attracting capital while Ethereum faced selling pressure despite strong on-chain metrics like a growing staking queue. Regulatory news took a pause as the U.S. Senate delayed the CLARITY Act vote until at least autumn. For the final trading day of July, U.S. inflation and consumer spending data will be crucial. Bitcoin's key levels to watch are $63,000 support and $66,000 resistance. Sustained ETF inflows and Bitcoin holding above $63,000 are seen as positive signs for a potential market recovery later in the year.

cryptonews.ru8m ago

Why Bitcoin Holds Above $64,000 After Fed's Hard Pause

cryptonews.ru8m ago

Trading

Spot

Hot Articles

Discussions

Welcome to the HTX Community. Here, you can stay informed about the latest platform developments and gain access to professional market insights. Users' opinions on the price of ETH (ETH) are presented below.

活动图片