Ethereum Shortfall Says Price Is Headed Lower Unless This Happens

bitcoinistPublished on 2026-05-09Last updated on 2026-05-09

Abstract

Ethereum's price rebound is facing a key technical test after rising with the broader crypto market. Analysis of its daily chart reveals ETH has been trading within a rising channel since February 2026. While forming higher lows, it has consistently failed to reach the channel's upper boundary around $2,520, stalling near $2,420—a roughly 6% shortfall indicating weakening momentum. Furthermore, the 200-day EMA remains above the current price. In contrast, Bitcoin has cleanly reached its own channel high. The critical level for ETH is a confirmed breakout above $2,420, turning it into support to reach the $2,520 channel top. Without this, Ethereum risks further underperformance versus Bitcoin. At publication, ETH was trading at $2,284.

Ethereum has moved higher with the broader crypto market this week, but its rebound is now facing a technical test that may decide whether the move has real strength or only a reflection of Bitcoin’s momentum.

A recent technical outlook points to a shortfall on the ETH daily candlestick chart, as the price continues to stall below the upper end of its rising channel despite repeated attempts to extend the rally.

Ethereum’s Rally Is Showing A Shortfall

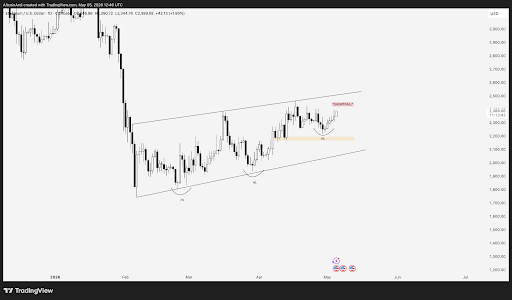
Technical analysis of the Ethereum daily candlestick timeframe chart shows that Ethereum has been trading inside a rising channel since February 2026. This is a structure that, in theory, should allow bulls to progressively push the price toward its upper boundary.

The structure has produced a sequence of higher lows, which is usually a good sign. However, the problem is that ETH has not matched that strength on the upper side of the pattern, at least in May.

According to a crypto analyst that goes by the name Ardi on the social media platform X, the channel’s upper boundary currently is around $2,520, but ETH’s recent advances have repeatedly stalled around $2,420. That leaves the price about 6% below the channel high, creating a shortfall.

Source: Chart from Ardi on X

The daily structure is also not fully bullish. While ETH has reclaimed its short- and medium-term moving averages, the 200-day EMA is still above the current price, meaning the recovery is still incomplete.

The concern becomes more serious because Bitcoin has already achieved what Ethereum has not. The Bitcoin price has reached the upper side of its own channel structure to create a higher high around $81,000, meaning Bitcoin has been leading the market rally more cleanly.

The Level Ethereum Must Reclaim

Based on this analysis, the bearish shortfall view does not become invalid simply because Ethereum is trading above recent lows. According to crypto analyst Ardi, the real test now is whether the ETH price can move through $2,420 and turn that area into support.

Price action on the daily chart is asking for a confirmation move. A breakout above $2,420 would be this confirmation move, as it would mean that buyers are absorbing supply at the top of the current range. Furthermore, a breakout above $2,420 would also see Ethereum reaching the upper boundary of its channel, which is currently sitting around $2,520.

On the other hand, a continuation rally from Bitcoin would produce only a weak response from ETH. The relationship between Bitcoin and Ethereum has been inconsistent, with Ethereum underperforming Bitcoin so far this year. At the time of writing, ETH is trading at $2,284, down by 1.9% in the past 24 hours.

ETH trading at $2,283 on the 1D chart | Source: ETHUSDT on Tradingview.com

Related Questions

QWhat does the technical analysis of Ethereum's daily candlestick chart reveal about its recent price movement?

AThe technical analysis shows that Ethereum has been trading inside a rising channel since February 2026. While it has formed a sequence of higher lows, its advances have repeatedly stalled around $2,420, failing to reach the channel's upper boundary near $2,520. This creates a 'shortfall' of about 6%.

QAccording to analyst Ardi, what price level must Ethereum reclaim to potentially confirm a stronger bullish move?

AAccording to analyst Ardi, Ethereum must break through and turn the $2,420 price level into support. This move would confirm buyer strength by absorbing supply at the top of the current range and could allow the price to reach the channel's upper boundary near $2,520.

QHow does Bitcoin's performance compare to Ethereum's within their respective channel structures, according to the article?

ABitcoin has already achieved what Ethereum has not. While Ethereum faces a shortfall, Bitcoin's price has reached the upper side of its own channel structure to create a higher high around $81,000. This indicates Bitcoin has been leading the market rally more cleanly.

QWhat is the significance of Ethereum's 200-day Exponential Moving Average (EMA) in the current analysis?

AThe 200-day EMA is still above Ethereum's current price. This indicates that, despite reclaiming its short- and medium-term moving averages, the recovery is still incomplete from a longer-term technical perspective, adding to the cautious outlook.

QWhat is the author's overall concern regarding Ethereum's rally based on the technical 'shortfall' and its relationship with Bitcoin?

AThe overall concern is that Ethereum's rally lacks real independent strength and may only be a reflection of Bitcoin's momentum. The technical shortfall, failure to break resistance, and Ethereum's historical underperformance against Bitcoin this year suggest its price is headed lower unless it can decisively reclaim the $2,420 level.

Related Reads

STRC Breaks Below $95: Why Does It Continue to Depeg? Is There Default Risk?

"STRC Falls Below $95: Why the Persistent Depegging and Is There Default Risk?" The article discusses the recent decline in the price of STRC, a perpetual preferred stock issued by Strategy (MSTR) designed to trade around a $100 par value. As of publication, STRC traded at $94.65, raising market concerns. STRC is described as a high-yield cash flow product, offering an 11.50% annual dividend paid monthly. Its "preferred" status grants it priority over common stock for dividends and in liquidation. Key reasons cited for the price depegging include: 1. **Bitcoin's Price Drop:** MSTR's assets are heavily tied to Bitcoin (BTC), which fell over 21% from its recent high, pressuring all Strategy-related products. 2. **Competitive Pressure:** Rival Strive Asset Management's similar product, SATA, offers daily dividends and has maintained its $100 par value with a ~13% yield. In response, Strategy has proposed changing STRC's dividend frequency from monthly to bi-weekly, pending shareholder vote. 3. **Technical Selling:** A break below $100 may have triggered algorithmic selling and stop-losses, exacerbating the decline. Regarding default risk, the analysis suggests it is currently low. Strategy founder Michael Saylor confirmed the June 2026 dividend rate remains at 11.50% with no cuts or suspensions. The company's massive reserve of 843,706 BTC provides a significant backstop for its obligations. Industry opinions are mixed. Some analysts view the BTC holdings as reliable support for dividends, while critics like Peter Schiff warn of potential dividend cuts leading to price crashes and lawsuits. Others highlight inflation risk and the company's ability to reduce dividends without a formal default. In summary, STRC's drop is attributed to BTC volatility, competition, and technical factors. While immediate default risk appears contained, the product faces challenges from market conditions and competitive dynamics.

marsbit4m ago

STRC Breaks Below $95: Why Does It Continue to Depeg? Is There Default Risk?

marsbit4m ago

AI Trading Cools, South Korean Stocks Plunge 1.8%, Spot Gold Rises 1%, Bitcoin Dives

A sell-off in AI-related stocks, triggered by Broadcom's disappointing earnings forecast, sent shockwaves through global markets. South Korea's KOSPI led Asia's decline, plunging 1.8% as the risks from concentrated chip stock gains and surging leveraged investments came to the fore. The tech-heavy Nasdaq 100 futures fell 0.5% following Broadcom's 14% after-hours plunge, which signaled a slower-than-expected transition to AI clients. This pullback extended Wall Street's weakness, halting the S&P 500's nine-day rally amid hawkish Fed signals and renewed Middle East tensions. South Korean authorities convened an emergency meeting, pledging "immediate measures" against market volatility and warning of record-high stock margin debt. The adjustment rippled across assets: Bitcoin fell to around $64,000, its lowest since February, while safe-haven gold rose 1% on bargain hunting. Oil prices dipped on Middle East ceasefire news. Market analysts noted the sell-off was driven by profit-taking after massive gains, particularly in chip stocks like Samsung and SK Hynix, which now dominate the KOSPI. Wall Street banks are divided on Korea's outlook, with Goldman Sachs raising its target while Citigroup and others warn of overvaluation and a potential bubble. Bridgewater's Ray Dalio noted that great technological shifts often create bubbles. Meanwhile, Fed officials' hints at potential future rate hikes added to the cautious mood ahead of key U.S. jobs data.

华尔街日报30m ago

AI Trading Cools, South Korean Stocks Plunge 1.8%, Spot Gold Rises 1%, Bitcoin Dives

华尔街日报30m ago

Seeking Alpha's Hot Article: Why Might the U.S. Stock Market Crash in June?

In a recent Seeking Alpha article, financial professor and analyst Damir Tokic argues that the US stock market may be poised for a significant crash in June 2026. The core thesis centers on a "mega-bubble" in equities, particularly within the technology sector, which has driven the S&P 500 to near-record valuations, with a Shiller P/E ratio exceeding 40—a level comparable to the 2000 dot-com bubble. Tokic identifies two primary catalysts for a potential collapse. First, he points to unsustainable market exuberance fueled by what he terms the "Trump Stimulus"—massive AI capital expenditure by tech giants, which he believes is politically driven and cannot last. Second, and more urgently, he highlights the escalating Iran war as a critical threat. The ongoing closure of the Strait of Hormuz has created a severe global energy supply crunch. Strategic petroleum reserves are projected to hit critically low operational levels by June, potentially causing oil prices to spike above $200 per barrel and triggering a severe, supply-driven inflationary shock. This scenario, Tokic warns, would force the Federal Reserve's hand. Despite currently maintaining a dovish bias, the Fed would likely be compelled to officially pivot to a hawkish stance at its June FOMC meeting to combat soaring inflation and bond yields. He contends that such a shift—or even a failure to act, which would destroy Fed credibility—could be the trigger that punctures the market bubble. The resulting downturn, he concludes, could rival the bear markets of 2000 and 2008, advising investors to prepare for a major correction.

marsbit52m ago

Seeking Alpha's Hot Article: Why Might the U.S. Stock Market Crash in June?

marsbit52m ago

AI PC Battle: Bet on the Toll Booth, Not the Camp

**Title:** The AI PC Battle: Don't Bet on Sides, Bet on the Tollbooth **Summary:** The AI PC competition is moving beyond simple "x86 vs. Arm" narratives. The core investment thesis should focus on identifying which players can sustain margins, cash flow, and pricing power throughout the upgrade cycle, rather than backing a particular architecture. The opportunity is analyzed in three layers: 1. **The Advanced Foundry Tollbooth:** TSMC is positioned to collect "tolls" regardless of which chip designer wins, due to its dominant ~70% share in advanced semiconductor manufacturing, which is essential for high-end AI PC chips. 2. **Compute & Platform Spillover:** AMD represents an offensive in the x86 CPU+GPU space, while NVIDIA leverages its GPU and CUDA software stack dominance. Both benefit from the demand for increased local AI compute. 3. **Architecture Diffusion & Turnaround Plays:** ARM and Intel offer potential for significant upside (elasticity), but investments here require stricter discipline due to higher execution risks and competitive challenges. The industry is transitioning from concept to shipment validation. While short-term forecasts for AI PC adoption have been revised down slightly due to tariffs and procurement delays, the long-term trend towards AI becoming a standard PC feature remains intact. The key driver for upgrade cycles will be whether compelling enterprise applications (e.g., privacy-sensitive computing, low-latency inference) emerge beyond consumer-focused features like meeting summarization. Investment strategy should prioritize companies with platform-level advantages and recurring revenue streams. TSMC offers high certainty as the foundational tollbooth. AMD presents a strong offensive play within the established ecosystem. ARM and Intel are higher-risk, higher-potential-reward turnaround bets. The report cautions against chasing short-term hype and emphasizes a disciplined, long-term approach focused on buying ecosystem strength and cash-flow certainty after market enthusiasm subsides. **Key Risks:** Underwhelming AI PC applications slowing upgrade cycles; slow improvement in Windows on Arm compatibility; macro/tariff impacts on PC demand; potential advanced node supply-demand mismatches affecting TSMC; high overall AI sector valuations making stocks vulnerable to a risk-off shift in markets.

marsbit1h ago

AI PC Battle: Bet on the Toll Booth, Not the Camp

marsbit1h ago

Trading

Spot
Futures

Hot Articles

Discussions

Welcome to the HTX Community. Here, you can stay informed about the latest platform developments and gain access to professional market insights. Users' opinions on the price of ETH (ETH) are presented below.

活动图片