Ethereum Remains Under Pressure as Price Consolidates Near $2,000

TheNewsCryptoPublished on 2026-02-10Last updated on 2026-02-10

Abstract

Ethereum (ETH) is trading near $2,012, down 4.40%, after failing to sustain a recovery above $2,140. The price is consolidating near $2,000, with the broader trend remaining bearish as it trades below all major moving averages. Key support lies at $1,950, followed by the $1,800–$1,700 zone, while resistance is near $2,140 and $2,200. Momentum indicators like RSI and MACD signal continued bearish pressure. Despite analyst Tom Lee's optimistic outlook, technical weakness persists. Meanwhile, the Ethereum Foundation is supporting initiatives to enhance security, and developers are planning upgrades to improve network efficiency.

Ethereum (ETH) is trading near $2,012 on Tuesday after extending recent losses. The latest daily candle shows a 4.40% decline, with price ranging between a high of $2,144.98 and a low of $1,995.65. The move reflects continued pressure following a volatile week for the asset.

Last week, Ethereum dropped sharply to the $1,700 area before staging a recovery. The rebound pushed the price back toward $2,140, but buying interest faded near that level. ETH failed to hold above $2,100, and selling pressure returned, driving the price back toward the $2,000 zone, where it is currently consolidating.

On the ETH/USDT daily chart, Ethereum remains in a downward trend. Price continues to form lower highs and lower lows and is trading below all major moving averages. The 50-day MA is near $2,858, the 100-day MA near $2,983, and the 200-day MA around $3,590, keeping the broader structure bearish. These levels represent key resistance zones if price attempts another recovery.
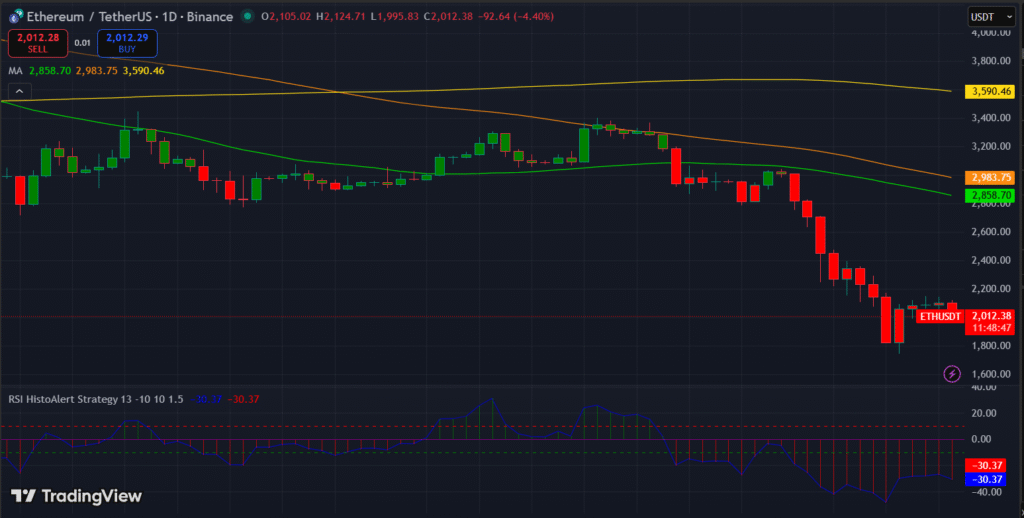
Looking further, the momentum indicators also remain weak. The RSI histogram is currently near -30, indicating bearish momentum and suggesting the market is closer to oversold conditions. The MACD remains in negative territory, with no bullish crossover in place, pointing to continued downside risk despite the recent slowdown in selling.

On the downside, $1,950 is acting as immediate support, followed by the $1,800–$1,700 area from last week’s low. On the upside, resistance is seen near $2,140, followed by $2,200.

Analyst Views and Network Developments on Ethereum

Beyond price action, Fundstrat’s Tom Lee stated that Ethereum could recover “as fast as it fell,” though the comment has drawn mixed reactions as some analysts point to current technical weakness.

Separately, the Ethereum Foundation has backed SEAL, an initiative aimed at reducing losses from wallet drainers targeting users. In addition, Ethereum developers are planning a major upgrade using zero-knowledge proofs to improve block validation efficiency.

Overall, Ethereum’s price action shows consolidation near $2,000 after a failed recovery, with broader direction still dependent on whether support can hold and momentum improves.


TagsAltcoinCrypto MarketETHETHEREUM

Trending Cryptos

Related Questions

QWhat is the current trading price of Ethereum and what was its recent daily decline percentage?

AEthereum is currently trading near $2,012 after a recent daily decline of 4.40%.

QWhat are the key resistance levels for Ethereum according to the daily chart analysis?

AThe key resistance levels are near $2,140, followed by $2,200, with the major moving averages (50-day at $2,858, 100-day at $2,983, and 200-day at $3,590) acting as significant resistance zones.

QWhat do the momentum indicators (RSI and MACD) suggest about Ethereum's current market condition?

AThe RSI histogram is near -30, indicating bearish momentum and approaching oversold conditions. The MACD remains in negative territory with no bullish crossover, pointing to continued downside risk.

QWhat initiative has the Ethereum Foundation backed to address security concerns?

AThe Ethereum Foundation has backed SEAL, an initiative aimed at reducing losses from wallet drainers that target users.

QWhat major technical upgrade are Ethereum developers planning to implement?

AEthereum developers are planning a major upgrade using zero-knowledge proofs to improve block validation efficiency.

Related Reads

Why Bitcoin Holds Above $64,000 After Fed's Hard Pause

**Bitcoin Stabilizes Near $64,000 Following Hawkish Fed Pause** The cryptocurrency market, led by Bitcoin, remained stable around $64,000 despite a volatile reaction to the latest U.S. Federal Reserve meeting. The Fed paused interest rates but signaled a hawkish stance, with three committee members voting for an increase—the highest dissent since 2016. This limits risk appetite but hasn't triggered panic selling. Key market highlights include Bitcoin ETFs seeing a net inflow of $32.1 million, breaking a streak of outflows, while Ethereum ETFs experienced outflows of $18.65 million. Liquidations affected about 90,000 traders. Technically, Bitcoin finds support around $63,000-$63,500, with major resistance near $66,000. While its price is about 49% below its all-time high, institutional demand via ETFs and the absence of mass capitulation support a potential recovery scenario in the second half of the year. Major altcoins showed mixed movements, with Solana attracting capital while Ethereum faced selling pressure despite strong on-chain metrics like a growing staking queue. Regulatory news took a pause as the U.S. Senate delayed the CLARITY Act vote until at least autumn. For the final trading day of July, U.S. inflation and consumer spending data will be crucial. Bitcoin's key levels to watch are $63,000 support and $66,000 resistance. Sustained ETF inflows and Bitcoin holding above $63,000 are seen as positive signs for a potential market recovery later in the year.

cryptonews.ru17m ago

Why Bitcoin Holds Above $64,000 After Fed's Hard Pause

cryptonews.ru17m ago

Trading

Spot

Hot Articles

Discussions

Welcome to the HTX Community. Here, you can stay informed about the latest platform developments and gain access to professional market insights. Users' opinions on the price of ETH (ETH) are presented below.

活动图片