Bitcoin and Ethereum are showing renewed momentum after recovering and rising by more than 7% in the past week. As bearish trends slowly reverse, a crypto analyst has shared a detailed analysis of the ETH/BTC chart, predicting the trading pair’s next moves. The analysis highlights key upside targets and identifies a specific sell zone, signaling when traders may consider taking profits.
Ethereum Approaches Key Sell Zone Against Bitcoin
Crypto market technician John Carter has illustrated a bullish setup for the ETH/BTC pair in one of his latest chart analyses on X. According to Carter, Ethereum is reaching a critical decision point against Bitcoin, with price hovering near an important technical level within a Broadening Wedge pattern. The setup points to a potential breakout, highlighting a clearly defined resistance zone where selling pressure is expected to emerge.
Notably, Carter has stated that Ethereum is currently approaching the upper boundary of the long-term Broadening Wedge on the weekly chart. This structure has guided Ethereum’s performance relative to BTC for several years, with prices expanding between widening trendlines.
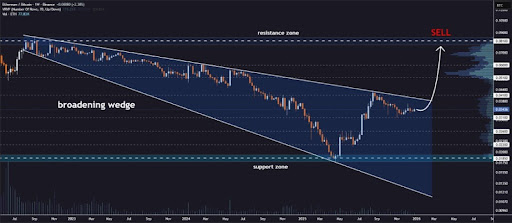
Recently, ETH/BTC bounced from the lower support zone of the Broadening Wedge, confirming that buyers are defending that level. The rebound from support was sharp and well defined, and after touching the lower boundary of the wedge, the pair launched a strong recovery leg. This upward move pushed the price back into the upper half of the wedge, setting ETH/BTC on a direct path toward resistance.
According to Carter, ETH/BTC is now completing its final phase of consolidation within the wedge. As a result, breakout signals are emerging as price tightens near resistance, and the trading pair holds higher lows. If ETH/BTC confirms a breakout above the wedge’s upper boundary, Carter predicts that it will climb to an initial target of $0.041, aligning with a previous consolidation area.
Beyond that, price could advance upward $0.051 and $0.060. The final upside target has been set at $0.081, which overlaps with the broader resistance zone on the chart. The analyst marks this resistance as a sell zone, showing when traders can begin taking profit.
Analyst Outlines Critical Support Levels For ETH/BTC
In his analysis, Carter also identified several support zones that could act as key defense levels if Ethereum faces a pullback against Bitcoin. The first major support zone lies near the upper boundary of the Broadening Wedge pattern, around $0.031. Below that, the analyst has pinpointed another support level at $0.026.
If the price falls below $0.026, the next notable support is around $0.022, representing a roughly 35% decline from current levels above $0.034. In the event of an even deeper correction, Carter forecasts that ETH/BTC could drop to $0.0185, a level marked on the chart as the Broadening Wedge’s “support zone.” Any move below this support would likely push ETH/BTC toward the lower boundary of the wedge, which extends down to $0.010.


