Ethereum has regained bullish momentum following a sharp recovery from recent lows, putting the second-largest cryptocurrency within striking distance of the crucial $2,000 milestone. Buyers have been gradually lifting prices over the past several sessions, reflecting stronger market confidence.
Technical Recovery Strengthens Bullish Outlook
Ethereum is currently trading around $1,968 after rallying from a swing low near $1,510. The rally has already pushed the asset above both the 20-day and 50-day Exponential Moving Averages (EMAs), signaling a shift in short-term momentum in favor of buyers.
However, the next challenge lies near the 100-day EMA around $1,934 and the psychological resistance at $2,000. A decisive move above these levels could fuel additional buying pressure. Consequently, Ethereum may target the $2,050 to $2,100 region before testing the 200-day EMA near $2,181.
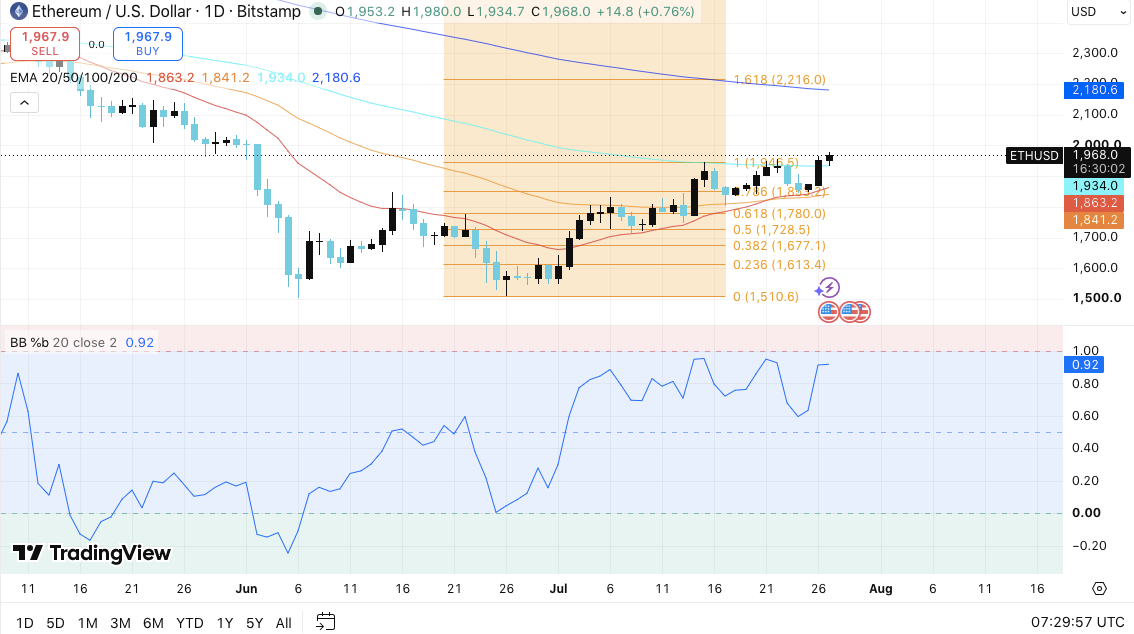
Momentum indicators also support the recovery. The Bollinger Band %B indicator remains close to the upper band, indicating that buyers are still in control of the trend. However, a strong rally could also lead to temporary profit-taking before new upward steps appear.
Related: Bitcoin Price Forecast: Is Bitcoin's Resistance Band About to Break or Be Rejected for a Sixth Time?
If sellers regain control, immediate support will be around $1,934. Additional buying interest may emerge near the 20-day EMA at $1,863. Below that, $1,780 and $1,728 remain key zones that could stabilize any deeper correction.
Open Interest Signals Traders Are Returning
Derivatives activity has also started to improve following a significant cool-down from previous highs. Ethereum's open interest has recently recovered to approximately $27.77 billion, reflecting renewed participation by futures traders.
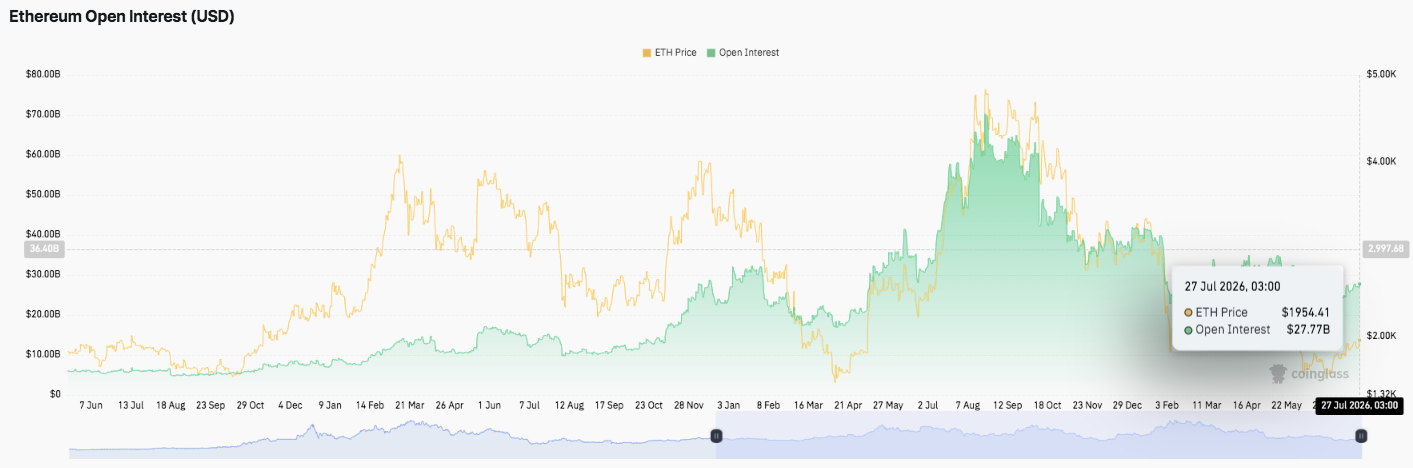
Earlier this year, open interest surged above $60 billion amid Ethereum's aggressive rally. This expansion highlighted a rise in speculative activity and increased leverage in the market. However, the subsequent correction triggered massive liquidations and reduced traders' risk exposure.
The recent increase suggests investors have begun to rebuild their positions. Nevertheless, current levels remain significantly below the previous peak. Thus, traders appear to favor a more measured approach rather than aggressive risk-taking.
Exchange Flows Point to Gradual Accumulation
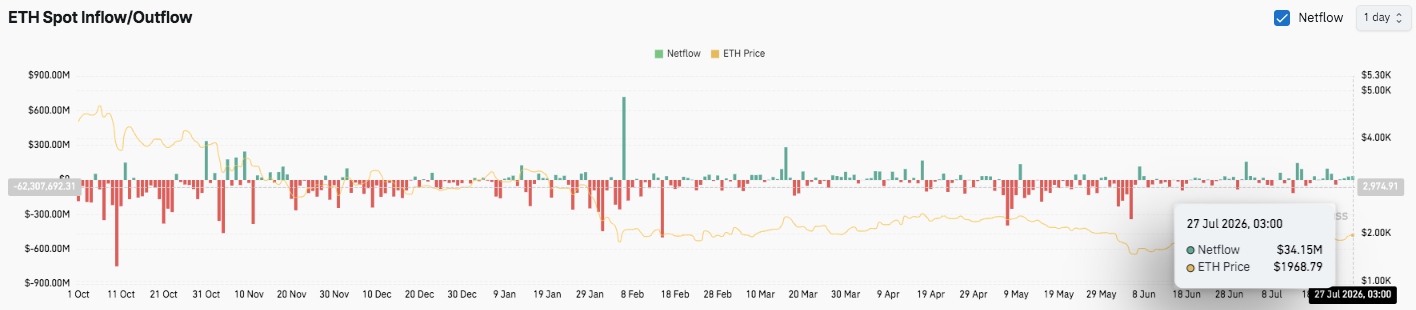
Spot exchange data also paints a constructive picture. Recent inflows and outflows have remained relatively balanced, suggesting neither buyers nor sellers currently dominate market activity.
Previous periods recorded significant exchange outflows exceeding $300 million, while one notable inflow spike briefly surpassed $700 million, indicating strong institutional demand. Since then, overall net flows have softened as investors adopted a more cautious stance.
Related: Cardano Price Forecast: Can ADA Overcome $0.20 Amid Ark Invest vs. Hoskinson Clash Over Its Relevance?
The latest data shows a net inflow of approximately $34.15 million as Ethereum trades around $1,968. Improving inflows often signal growing accumulation. Moreover, sustained positive net flows could strengthen the case for further upside if demand continues to grow.
Ethereum Price Technical Forecast
Key levels remain critical as Ethereum approaches the psychological $2,000 barrier:
Upside Levels: $2,000 remains the first barrier for a breakout, followed by $2,050–$2,100. A sustained move above these levels could open the door to the 200-day EMA near $2,181, confirming a broader trend reversal.
Downside Levels: Initial support is at $1,934 (100-day EMA), followed by the 20-day EMA at $1,863. If selling pressure intensifies, the next key demand zones become the 61.8% Fibonacci level at $1,780 and the 50% Fibonacci retracement at $1,728.
Resistance Ceiling: The 200-day EMA at $2,181 remains the most significant technical barrier. A decisive close above it would solidify Ethereum's medium-term bullish structure and further shift market sentiment in favor of buyers.
Ethereum's technical configuration continues to improve after reclaiming short-term moving averages. Rising open interest and gradually strengthening spot inflows suggest renewed investor participation, although traders remain cautious following recent volatility.
Will Ethereum Rise?
Ethereum's near-term prospects hinge on whether bulls can secure a foothold above $2,000. A confirmed breakout could attract additional momentum buyers and propel the price toward $2,100, and eventually $2,181. Furthermore, improving derivatives activity and positive exchange flows support the case for continued accumulation.
Related: Espresso Price Forecast: Bullish Momentum Builds as ESP Aims for $0.1208 After 42% Weekly Rally
However, a failure to overcome the $2,000 resistance could lead to a healthy pullback to $1,934 or $1,863, where buyers will need to defend support to preserve the current recovery. For now, Ethereum remains in a favorable technical position, with momentum leaning upward as long as key support levels hold.




















