Ethereum Open Interest Breaks October 9 Threshold: Traders Return Post-Shakeout

bitcoinistPublished on 2026-01-15Last updated on 2026-01-15

Abstract

Ethereum is showing tentative signs of recovery after weeks of downside pressure, but faces significant resistance near the $3,400 level. A key development is the rise in open interest on Binance, reaching approximately $8.6 billion—the highest since October 9. This indicates traders are returning and rebuilding positions at relatively lower prices, suggesting renewed appetite for leverage and potential medium-term upside expectations. However, this also increases price sensitivity to sudden moves. While the market shows signs of stabilization with higher lows, a decisive break above $3,400 is needed to confirm a broader recovery. Failure to overcome this resistance could lead to renewed volatility or decline.

Ethereum is showing tentative signs of relief after weeks of downside pressure, but the recovery remains fragile. The price is currently struggling to push decisively above the $3,400 level, a zone that has repeatedly acted as resistance during recent attempts to rebound. While short-term sentiment has improved alongside broader market stabilization, risks remain elevated. Several analysts warn that Ethereum could still face further declines in the coming weeks if momentum fades and macro or liquidity conditions deteriorate again.

Adding complexity to the picture, derivatives data suggest a renewed buildup of risk. A report from Arab Chain highlights that Ethereum’s open interest on Binance has climbed to approximately $8.6 billion, its highest level since October 9.
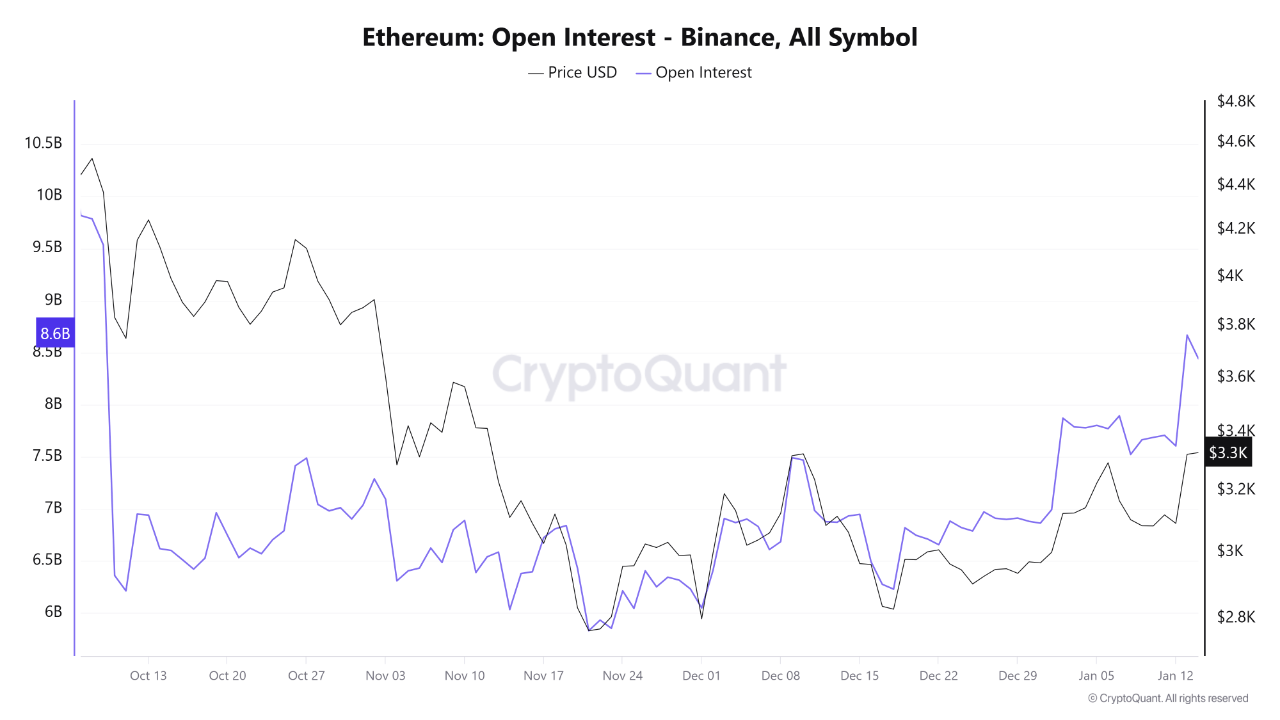
Ethereum Open Interest | Source: CryptoQuant

This marks a notable shift after a prolonged period of contraction following the sharp liquidation event in October, when open interest collapsed from above $10 billion to below $7 billion in a matter of days. That episode flushed excessive leverage from the market and forced traders into a defensive stance.

The current rise in open interest signals that traders are gradually returning and rebuilding positions at lower price levels. However, this also increases the price’s sensitivity to sudden moves.

Ethereum is currently testing a key structural resistance zone around $3,400, and the latest derivatives data adds important context to this price behavior. According to the CryptoQuant report by Arab Chain, the rise in open interest on Binance reflects renewed activity in the derivatives market and a clear return of traders’ appetite for leverage. This is a notable shift from the defensive posture seen after the October liquidation wave.

What stands out is that this increase in open interest is occurring while ETH trades near the $3,300–$3,400 area, well below its previous cycle highs. This suggests that traders are not chasing price at extremes, but instead building positions at relatively discounted levels. Historically, this type of positioning often reflects expectations of a medium-term upside move rather than short-term speculation.

At the same time, the fact that open interest has reached its highest level since October 9 without returning to prior overheated extremes points to a more balanced recovery. If this growth is driven by steady inflows rather than aggressive leverage, it supports the idea of a healthier market structure forming after the post-liquidation contraction phase.

However, risks remain asymmetric near resistance. A continued and rapid expansion in open interest while price stalls below $3,400 could increase vulnerability to sharp volatility. For Ethereum to sustain momentum, price and open interest must remain aligned, confirming that confidence is rebuilding rather than overstretching.

Ethereum price action on the daily chart shows a market attempting to recover, but still constrained by heavy structural resistance near the $3,400 region. After a sharp decline from the October highs, ETH established a local bottom below $2,900 and has since been forming higher lows, suggesting short-term stabilization rather than a confirmed trend reversal.
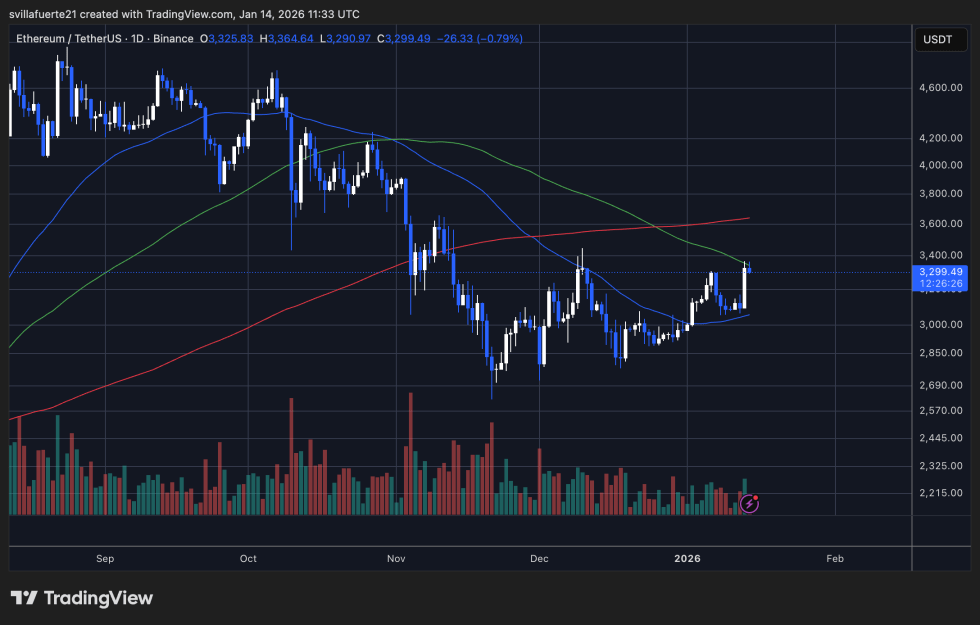
ETH is trying to push above resistance | Source: ETHUSDT chart on TradingView

Price is currently trading near $3,300, where multiple technical factors converge. The descending 200-day moving average and prior horizontal support-turned-resistance are capping upside momentum. Each rally into this zone has met selling pressure, highlighting that this area remains a critical supply region. The inability to reclaim $3,400 decisively keeps the broader structure neutral-to-bearish.

On the downside, the rising short-term moving average and recent higher lows around $3,000–$3,050 provide initial support. As long as ETH holds above this range, the market maintains a constructive consolidation structure rather than resuming the prior impulsive downtrend. Volume has remained moderate during the recovery, indicating controlled participation rather than aggressive speculative buying.

ETH is compressing between rising short-term support and declining long-term resistance. This type of price behavior often precedes a directional move. A clean daily close above $3,400 would signal a shift in market control and open the door for a broader recovery.

Featured image from ChatGPT, chart from TradingView.com

Trending Cryptos

Related Questions

QWhat is the significance of Ethereum's open interest reaching $8.6 billion on Binance?

AIt marks the highest level of open interest since October 9, signaling a renewed buildup of risk and the return of traders rebuilding positions at lower price levels after the sharp liquidation event in October.

QWhat key price level is Ethereum currently struggling to break above, and why is it significant?

AEthereum is struggling to decisively break above the $3,400 level, which is a key structural resistance zone that has repeatedly acted as a supply region, capping upside momentum and keeping the broader market structure neutral-to-bearish.

QHow does the current increase in open interest differ from the market conditions prior to the October liquidation event?

AUnlike the overheated conditions prior to October when open interest was above $10 billion, the current increase is occurring at relatively discounted price levels and is seen as a more balanced recovery driven by steady inflow rather than aggressive leverage, suggesting a healthier market structure.

QWhat does the formation of 'higher lows' on the price chart indicate for Ethereum's short-term trend?

AThe formation of higher lows suggests short-term stabilization and a constructive consolidation structure, indicating that the market is attempting to recover rather than resuming the prior impulsive downtrend, as long as it holds above the $3,000–$3,050 support range.

QWhat are the potential risks associated with the current rise in open interest while the price remains below $3,400?

AA continued and rapid expansion in open interest while the price stalls below key resistance could increase Ethereum's vulnerability to sharp volatility and sudden price moves, as it heightens the market's sensitivity to leverage-driven fluctuations.

Related Reads

Unlocking $100 Million in Liquidity? Pump.fun's New Policy Tests the 5-Minute Pump Technique

Pump.fun, a popular meme coin launchpad, has introduced a new standard mechanism called BOOST. It aims to address a significant capital efficiency issue: when a newly launched token graduates from its initial bonding curve to a liquidity pool (LP), roughly 20% of its liquidity becomes permanently locked as "dead liquidity," estimated to waste over $100 million annually. Instead of locking these funds permanently, BOOST repurposes them. Upon a token's migration, approximately 20% of the settlement funds (e.g., 17.6 SOL or ~$2516 USDC) are used to buy back the token on the open market over a 5-minute period via a Time-Weighted Average Price (TWAP) mechanism. All purchased tokens are immediately burned. This creates a brief, systematic buy pressure immediately after migration, potentially generating a short-term price surge ("pump") while permanently reducing the token's circulating supply. The goal is to enhance the immediate post-launch trading experience, potentially increasing trader retention and sustainable protocol revenue, which funds ongoing token buybacks. However, concerns exist that this artificial 5-minute boost could lower the barrier for launching low-quality tokens and lead to steeper price crashes once the buy pressure stops, if followed by large sell-offs. The feature automatically applies to tokens migrating after July 21, 2024, but not to previously migrated tokens or those launched via the Mayhem AI Agent lab.

marsbit3m ago

Unlocking $100 Million in Liquidity? Pump.fun's New Policy Tests the 5-Minute Pump Technique

marsbit3m ago

Podcast Notes | Conversation with GSR Asset Management Head: To Determine if This Crypto Rally is Real, Just Watch the Lending Rates on Aave

Podcast Summary: Dialogue with GSR's Head of Asset Management: To Determine if This Crypto Rally is Real, Just Check Lending Rates on Aave Andy Baehr, Managing Director of Asset Management at GSR, discusses the current crypto market, characterizing it as stuck in a state of "ambivalence" with short-lived, unsustainable rallies. He outlines a simple framework: the market moves between "ambivalence" and "conviction" (sustained upward momentum). Currently, every rally resembles a single-stage rocket booster that quickly fizzles out. Baehr identifies three key signals to watch: 1) DeFi lending rates, 2) the potential passage of the CLARITY Act, and 3) the market forming a consensus on the "Fed hawkish peak." He emphasizes that the most immediate indicator for the sustainability of the recent CPI-triggered rally is the USDC borrowing rate on Aave, currently around 3.75%—close to U.S. Treasury yields. The absence of a credit spread indicates low leverage demand and a lack of market energy. He explains that a healthy, sustained rally requires layered buying pressure. Last year's rally progressed from an ETH short squeeze to crypto-native trader influx and finally to ETF inflows. Currently, this structure is missing. Other potential structural buyers like Digital Asset Treasury (DAT) companies are absent, and ETF flows have proven transient. Baehr notes that while small-cap crypto tokens outperformed large caps in Q2—a potential sign of capitation in major assets—capital is also flowing to more exciting opportunities like AI stocks and tech IPOs, leaving crypto sidelined. Regarding DeFi, he highlights that platforms like Aave provide a clear, real-time signal of leverage demand through their supply/demand-driven interest rates. A significant, sustained rate increase would signal genuine market conviction. He also observes the quiet emergence of fixed-income-like products and vaults in DeFi. On regulation, the probability of the CLARITY Act passing before the August 7th deadline has dropped linearly from 75% to below 40% on Polymarket. Baehr suggests its passage would be treated as a bullish surprise, a potent driver for price movement. However, political hurdles, including ethical clause debates and disclosures about the First Family's crypto profits, remain significant obstacles. Ultimately, the market awaits clarity on the Fed's terminal rate under Chair Warsh. Until the "Fed Solstice"—the point where the market collectively understands the peak of hawkish policy—sustained conviction will be difficult to achieve.

marsbit34m ago

Podcast Notes | Conversation with GSR Asset Management Head: To Determine if This Crypto Rally is Real, Just Watch the Lending Rates on Aave

marsbit34m ago

Trading

Spot

Hot Articles

Discussions

Welcome to the HTX Community. Here, you can stay informed about the latest platform developments and gain access to professional market insights. Users' opinions on the price of ETH (ETH) are presented below.

活动图片