Ethereum In Limbo As Muted On-Chain Flows Reflect Market Indecision

bitcoinistPublished on 2025-12-27Last updated on 2025-12-27

Abstract

Ethereum is trading below $3,000, struggling to reclaim key levels amid deteriorating market confidence. Analysts expecting a continued downtrend cite a persistent lack of demand and momentum. On-chain data reveals a prolonged period of price compression around $2,800, indicating widespread market indecision. Layer-2 activity, particularly Arbitrum netflows, remains subdued, reflecting that larger participants are staying inactive rather than committing capital. This stagnation suggests a buildup of latent energy, often preceding a sharp directional move. Technically, ETH remains in a bearish structure with key resistance near $3,300–$3,600. A break below $2,800 could accelerate losses, while reclaiming $3,200–$3,300 is needed to shift momentum.

Ethereum is trading below the $3,000 mark as it attempts to push higher and reclaim key structural levels needed to signal the start of a recovery. So far, those efforts have failed. Price remains capped by persistent resistance, and market confidence continues to deteriorate.

While short-term bounces have emerged, most analysts and investors expect the broader downtrend to continue, arguing that Ethereum lacks the demand and momentum required to sustain a meaningful reversal. Sentiment has turned deeply pessimistic, with traders increasingly positioned for further downside rather than recovery.

On-chain and technical data reinforce this cautious outlook. A recent CryptoQuant report shows that after Ethereum’s steep decline from its $4,800 peak, the price has become trapped in a narrow range centered around the $2,800 level for nearly a month. This zone has effectively turned into a state of market purgatory. Bulls have been unable to generate the conviction needed to reclaim higher highs, while bears have repeatedly failed to force a decisive breakdown below support.

The result is a prolonged phase of volatility compression. Price action has tightened, signaling widespread indecision among market participants and a lack of directional commitment. Historically, such compression often precedes a sharp move, but the direction remains uncertain.

Muted Layer-2 Flows Reflect Ethereum’s Stalemate

A recent report from CryptoOnchain highlights that Ethereum’s price stagnation is being closely mirrored by on-chain behavior. Weekly ETH netflows on Arbitrum, one of Ethereum’s most important Layer-2 networks and a common proxy for smart-money positioning and DeFi activity, remain subdued and highly choppy.

Rather than showing a clear inflow or outflow trend, the data reflects a market operating without strong conviction, reinforcing the idea that larger participants are choosing to remain on the sidelines.

This lack of directional flow suggests that capital is not aggressively entering or exiting the ecosystem. Instead, investors appear to be waiting for clearer macroeconomic signals or a definitive shift in market structure before committing.

In previous cycles, sustained expansions in Arbitrum netflows have often coincided with periods of renewed risk appetite or decisive trend changes. The current inactivity stands in sharp contrast to those environments.

The alignment between compressed price action around key support levels and dormant on-chain activity points to a buildup of latent energy within the market. Ethereum is effectively coiling. While this equilibrium can persist for extended periods, it rarely resolves quietly. When the balance breaks, moves tend to be swift and forceful.

Arbitrum netflow is now a critical metric to watch. A sudden and sustained expansion in flows could act as an early signal that this prolonged phase of indecision is nearing its resolution, potentially setting the direction for Ethereum’s next major move.
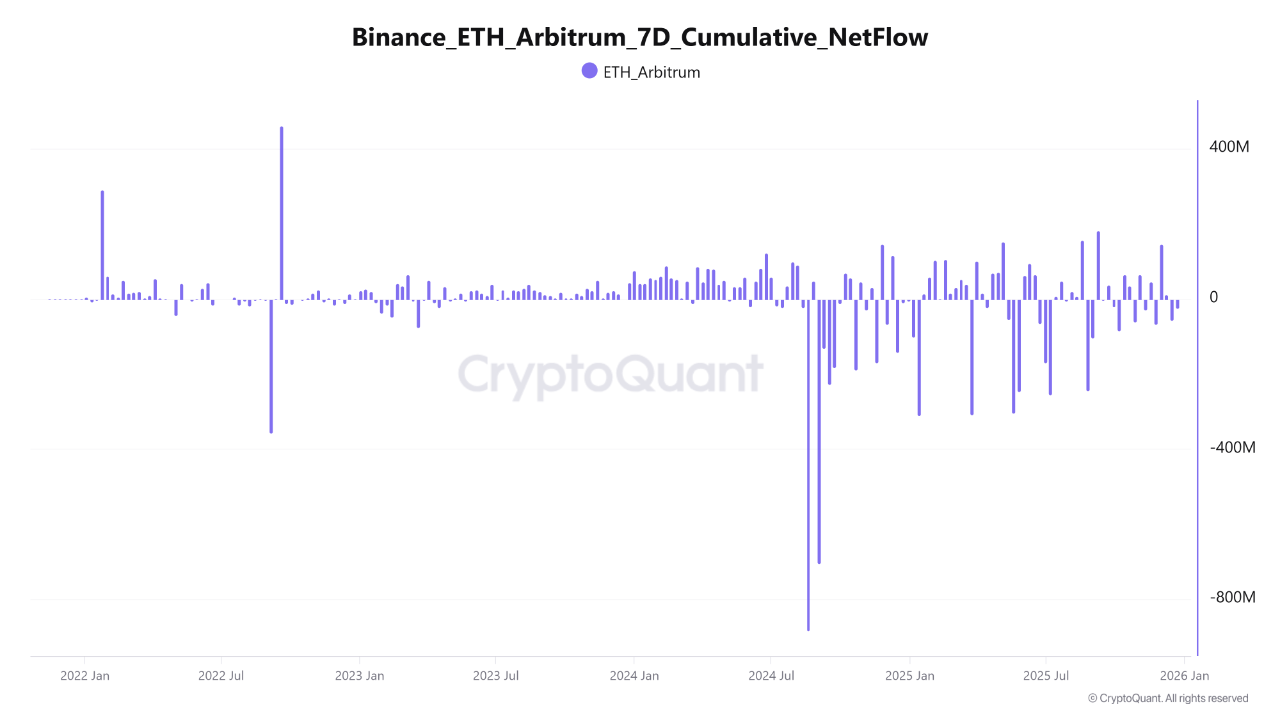
Binance Ethereum Arbitrum 7D Cumulative NetFlow | Source: CryptoQuant

Ethereum Stabilizes Near $3,000 as Downtrend Pressure Persists

Ethereum is trading near the $2,970 level on the daily chart, attempting to stabilize after an extended decline from the $4,800 highs recorded earlier this cycle. While recent candles show modest recovery attempts, the broader structure remains fragile. ETH continues to print lower highs and lower lows, signaling that bearish momentum has not yet been invalidated despite short-term relief bounces.
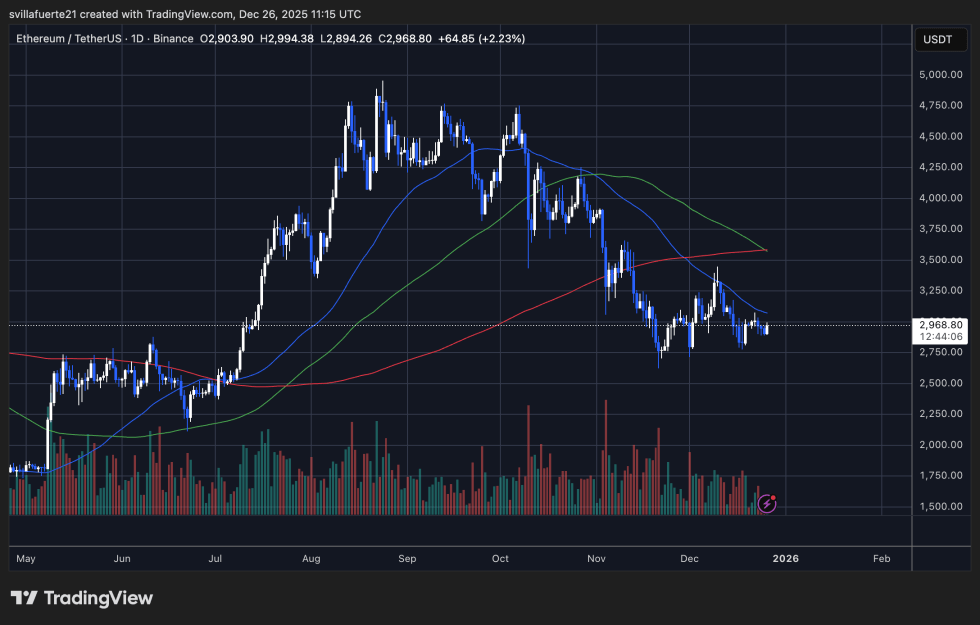
ETH testing critical resistance | Source: ETHUSDT chart on TradingView

Technically, price remains below its key daily moving averages. The faster moving average has rolled over sharply and is acting as immediate resistance, while the 111-day and 200-day simple moving averages converge in the $3,300–$3,600 range. This cluster forms a heavy overhead supply zone, limiting the probability of a sustained upside move unless volume and momentum expand meaningfully.

The recent bounce from the $2,800–$2,900 area has helped Ethereum avoid a deeper breakdown for now. However, this move has occurred on relatively muted volume, suggesting a lack of conviction from buyers. In contrast, the initial leg lower was accompanied by strong selling pressure, reinforcing the idea that the dominant trend remains to the downside.

From a structural standpoint, the $2,800 level remains critical support. A decisive break below this zone would likely accelerate losses and confirm bearish continuation. Conversely, for Ethereum to shift momentum, price must reclaim $3,200–$3,300 and hold above its declining daily averages.

Featured image from ChatGPT, chart from TradingView.com

Trending Cryptos

Related Questions

QWhat is the current price range Ethereum is trading in, and why is it described as 'market purgatory'?

AEthereum is trading in a narrow range centered around the $2,800 level, which is described as 'market purgatory' because bulls have been unable to generate the conviction to push prices higher, while bears have repeatedly failed to force a decisive breakdown below support, resulting in a prolonged phase of indecision.

QAccording to the CryptoOnchain report, what does the subdued and choppy weekly ETH netflows on Arbitrum indicate about the market?

AThe subdued and choppy weekly ETH netflows on Arbitrum indicate a market operating without strong conviction, suggesting that larger participants are choosing to remain on the sidelines and that capital is not aggressively entering or exiting the ecosystem.

QWhat are the key technical resistance levels that Ethereum needs to reclaim to signal a potential shift in momentum?

AFor Ethereum to shift momentum, the price must reclaim the $3,200–$3,300 level and hold above its declining daily moving averages, which converge in the $3,300–$3,600 range and form a heavy overhead supply zone.

QWhat is the significance of the $2,800 support level for Ethereum's price structure?

AThe $2,800 level is a critical support zone. A decisive break below it would likely accelerate losses and confirm bearish continuation, while holding above it has so far prevented a deeper breakdown.

QHow does the article characterize the current market sentiment towards Ethereum, and what is the general expectation among analysts?

AThe article characterizes the current market sentiment as deeply pessimistic, with traders increasingly positioned for further downside. Most analysts and investors expect the broader downtrend to continue, arguing that Ethereum lacks the demand and momentum required for a sustained reversal.

Related Reads

As Consensus Accelerates, What Are Young Investors Betting On?

Title: As Consensus Forms Faster, What Are Young Investors Betting On? In the rapid evolution of tech investment, a new generation of young investors is navigating a landscape where AI, robotics, commercial aerospace, and quantum computing are advancing simultaneously. Traditional investment logic based on financial models is giving way to a need for deep technical understanding and the ability to act before industry consensus forms. An analysis of trends from the "WAIC FUTURE TECH" list of young investment leaders reveals key shifts in focus. The first major trend is the movement of AI from the digital screen into the physical world. Investment is shifting from large language models and chatbots towards embodied AI, robotics, AI hardware, and edge computing. While demonstrations generate excitement, the real challenge lies in achieving scalable, reliable, and cost-effective delivery in complex real-world environments like factories and logistics. Success depends not just on algorithms but on the integration of sensors, actuators, and control systems. Second, the competitive focus for large models is moving beyond raw capability toward building an "intelligence flywheel." The goal is to create self-reinforcing systems where user interaction generates data, improving the model, which in turn enhances the user experience and attracts more engagement. Companies that successfully embed AI into workflows to create these closed-loop systems can build lasting value that isn't easily erased by the next model upgrade. Third, facing a potential bottleneck in high-quality human-generated data, investors are looking at new underlying technologies. Reinforcement learning and self-play, as demonstrated by AlphaGo Zero, offer paths for AI to generate its own experience. Scientific foundation models, which aim to build general AI capabilities for fields like life sciences and materials discovery, represent a non-consensus direction that could unlock new frontiers of knowledge and data. Finally, in deep-tech areas like quantum computing, commercial aerospace, and space-based infrastructure, patient capital is essential. These fields have long, uncertain development and validation cycles involving complex engineering, supply chains, and regulations. Investment here requires a long-term view, focusing on foundational team capabilities and the eventual emergence of market demand, even if commercial returns are distant. Collectively, these trends illustrate how young investors are adapting to a new era. They are learning to make earlier, technically-informed judgments, balance hype with real-world viability, and provide the patient capital needed to build the deep-tech foundations of the future.

marsbit27m ago

As Consensus Accelerates, What Are Young Investors Betting On?

marsbit27m ago

Can Japan Buy Growth with AI? Will the Bond Market Believe It?

Japan's cabinet has introduced the 2026 Basic Policy on Economic and Fiscal Management and Reform, shifting its primary fiscal target. The new framework moves away from the traditional annual primary balance goal and instead prioritizes a stable reduction of the debt-to-GDP ratio. This change is tied to a strategy of increased "responsible proactive fiscal" spending, aiming to boost long-term growth through investments in strategic sectors like AI, semiconductors, energy, and robotics. The government estimates total public and private investment in 62 key technologies could exceed 370 trillion yen by 2040. The market reaction has been mixed and cautious. While equity markets may respond to policy signals, bond markets are focused on fiscal credibility. Concerns center on whether the weakening of the clear primary balance anchor could lead to looser fiscal discipline. If investors doubt that these strategic investments will generate sufficient productivity gains, tax revenue, and nominal growth to outpace rising interest costs, they may demand higher yields on Japanese Government Bonds (JGBs). Recent volatility in the yen and JGB yields, with the 10-year yield briefly reaching 2.9%, reflects this skepticism. The success of this new framework hinges on two factors: whether Japan can achieve a nominal growth rate consistently higher than its long-term interest rates, and whether future budgets demonstrate disciplined control over bond issuance. The government's narrative is that strategic investment is essential to break Japan's cycle of low growth, aging, and labor shortages. However, the bond market will continuously assess the credibility of this plan, pricing the risk that it may represent fiscal expansion rather than a viable growth strategy.

marsbit1h ago

Can Japan Buy Growth with AI? Will the Bond Market Believe It?

marsbit1h ago

Misjudged A-Shares: Resilience, Expectations, and Confidence

China's A-share market recently faced selling pressure, especially in tech sectors, initially triggered by a global tech sell-off that began in South Korea. However, the article argues this is a case of "mistaken injury" and highlights the market's underlying resilience. This resilience stems from three main pillars: **1) Tech Sector Fundamentals:** Unlike Korea's market dominated by a few memory chip stocks, China's tech sector is diversified across computing, communications, electronics, and semiconductors, supported by dual narratives of global AI supply chains and domestic substitution. Core areas like optical modules and fiber optics continue to show strong earnings growth. **2) "National Team" Support:** State-backed institutions and large corporations have made significant market purchases and announced buybacks, providing liquidity and signaling confidence. This is seen as a stabilizing policy signal, often associated with market bottoms. **3) Broader Market Pillars:** Other major sectors are showing endogenous recovery momentum. Consumer stocks benefit from stabilizing CPI and signs of sector recovery (e.g., liquor price hikes). Cyclical sectors like aluminum have high earnings, potential price increases due to tight supply, and low valuations. The financial sector offers stable dividends and low valuations. The conclusion is that the sell-off was driven by external contagion, not a collapse in fundamentals. With strong policy support and recovering momentum across key sectors, the A-share market possesses the toughness to regain stability.

marsbit1h ago

Misjudged A-Shares: Resilience, Expectations, and Confidence

marsbit1h ago

Trading

Spot

Hot Articles

Discussions

Welcome to the HTX Community. Here, you can stay informed about the latest platform developments and gain access to professional market insights. Users' opinions on the price of ETH (ETH) are presented below.

活动图片















