Ethereum Bears Keep Control As ETH Rejects Trendline Resistance

bitcoinistPublished on 2026-06-21Last updated on 2026-06-21

Abstract

Ethereum's (ETH) recent price rebound is still viewed as unconvincing by some analysts, with technical analysis indicating continued bearish control. ETH has failed to break above a key falling trendline and a horizontal resistance zone, forming a pattern of lower highs and lower lows. This rejection at a confluence of resistances strengthens the bearish case. The critical support zone to watch is between $1,350 and $1,500. A breakdown below this area would signal significant weakness. Currently, ETH is trapped between this support and the dominant falling resistance, keeping the market in a compressed technical state. Ethereum's struggle is also significant for the broader altcoin market, as it often sets the tone for risk appetite. The analysis concludes that bulls require a decisive break above the identified resistance before any talk of a sustained reversal is warranted.

Ethereum’s latest rebound has not yet convinced all analysts that the downtrend is over. A June 20 TradingView idea from TheSignalyst argued that ETH remains bearish after continuing to trade below a falling red trendline and printing a sequence of lower highs and lower lows.
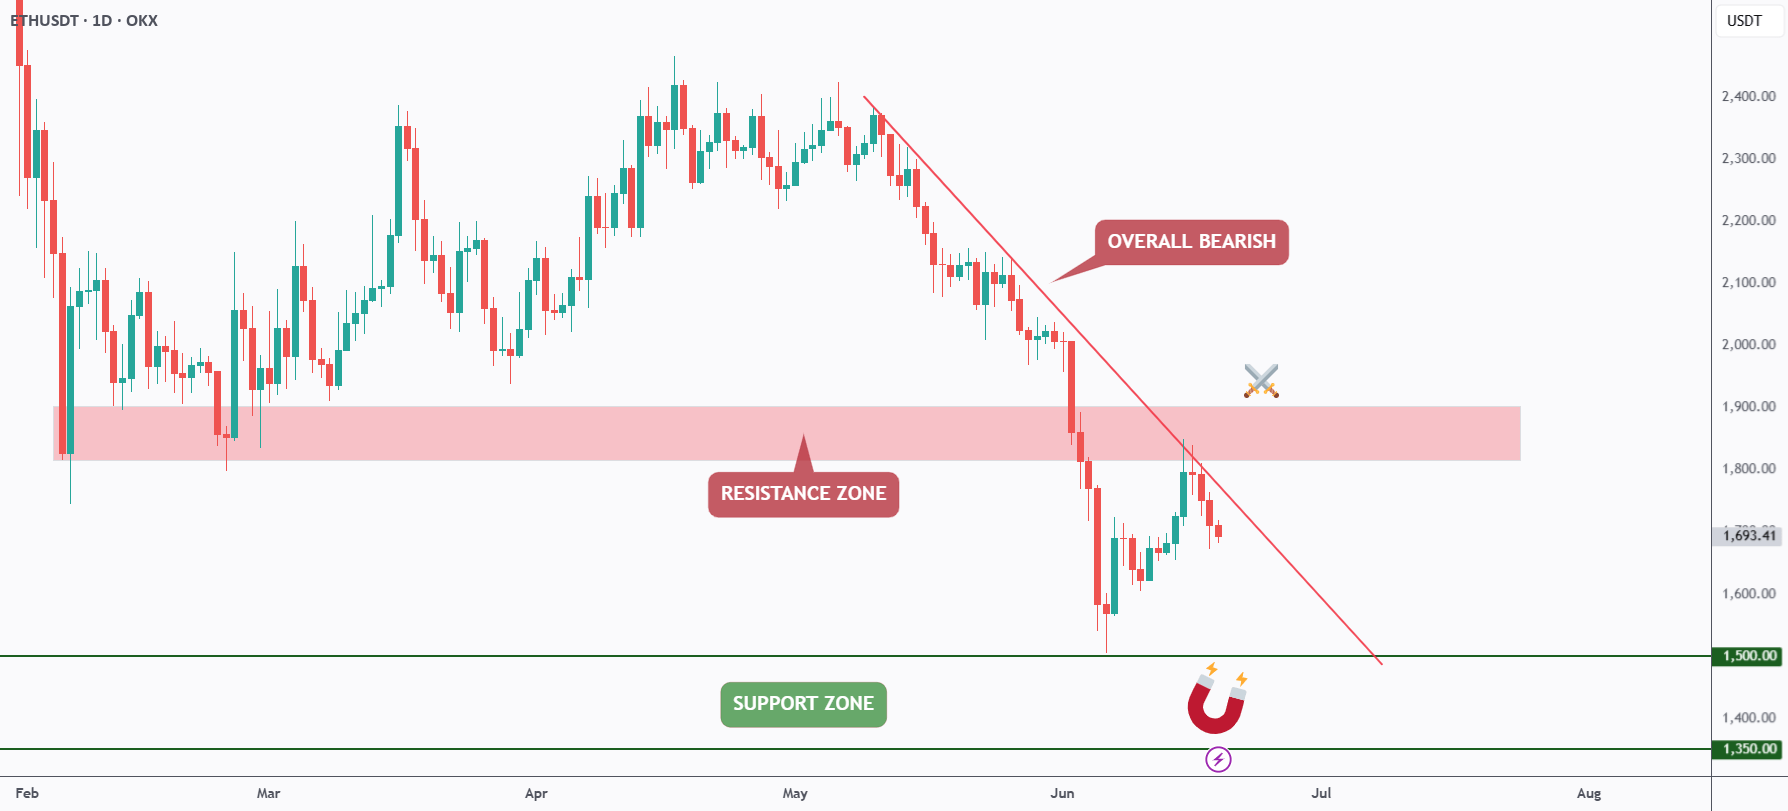
TradingView chart referenced in this analysis

The analyst’s chart shows ETH rejecting a confluence area made up of the falling trendline and a horizontal structure zone. That matters because confluence resistance can attract sellers more aggressively than a single isolated level. When price fails at both diagonal and structural resistance, traders often treat the move as confirmation that bears are still defending control.

Support Zone Still Defines The Downside Risk

The important support area, according to the idea, sits between $1,350 and $1,500. That gives traders a clear zone to watch if the rejection continues. A controlled pullback into that range could produce another reaction, but a decisive break below it would make the broader ETH structure look much weaker.

For now, ETH is caught between a support zone that has mattered before and a falling trendline that keeps capping rebounds. Until one of those areas gives way, the market remains technically compressed.

Why This Setup Matters Beyond ETH

Ethereum’s chart also matters for the wider altcoin market. When ETH struggles against the dollar, risk appetite across DeFi and smaller-cap crypto assets often weakens with it. That does not mean every altcoin follows ETH tick-for-tick, but Ethereum remains the benchmark for much of the smart-contract market.

TheSignalyst’s setup is therefore a warning that the recent rebound still has work to do. Bulls need a clean break above resistance before the market can talk seriously about a stronger reversal.

This report is based on information from TradingView TheSignalyst.

This article was written by the News Desk and edited by Samuel Rae.

Trending Cryptos

Related Questions

QAccording to the TradingView idea from TheSignalyst, why is Ethereum (ETH) considered to remain bearish?

AETH is considered bearish because it continues to trade below a falling red trendline and has printed a sequence of lower highs and lower lows, failing to break above a confluence area of resistance.

QWhat key support zone for ETH is identified in the analysis, and what would a break below it signify?

AThe key support zone identified is between $1,350 and $1,500. A decisive break below this support range would make the broader ETH price structure look much weaker, indicating increased downside risk.

QWhat is the significance of the confluence resistance area mentioned in the article?

AThe confluence resistance area, formed by the falling trendline and a horizontal structure zone, is significant because such combined resistance can attract sellers more aggressively than a single level. Price failing there confirms that bears are still defending control of the market.

QWhy does Ethereum's price action matter for the broader altcoin market according to the article?

AEthereum's price action matters for the broader altcoin market because when ETH struggles against the dollar, risk appetite across DeFi and smaller-cap crypto assets often weakens alongside it. Ethereum serves as a key benchmark for much of the smart-contract market.

QWhat do bulls need to achieve for the market to consider a stronger reversal, based on the analyst's conclusion?

ABased on the analyst's conclusion, bulls need to achieve a clean break above the identified resistance (the confluence of the falling trendline and horizontal structure zone) before the market can talk seriously about a stronger reversal.

Related Reads

Global Stock Market's Storm Center: South Korea's Stock Market De-leveraging Is Largely Complete

Storm's Eye: South Korean Market De-leveraging Nears Completion The recent sharp correction in South Korean equities, with the KOSPI index dropping 32% from its June high, has been a key trigger for global tech stock volatility. The core driver was not a fundamental shift but a forced de-leveraging process within the market's unique structure, which is now largely complete. Two main leverage channels amplified the sell-off: 1. **Leveraged ETFs:** Their size, proportionally four times larger than in the U.S., peaked near $50 billion. Their mandatory daily rebalancing mechanism created a vicious cycle of "price drop → forced selling → further drop." Approximately 75% of this excess has been unwound, shrinking to $26 billion, with regulatory curbs now blocking new inflows. 2. **Hedge Fund Leverage:** Using swaps to magnify exposure, hedge funds saw their net long positioning fall by over 50% from peak levels. The most intense phase of this institutional de-leveraging is over. In contrast, **retail margin debt** poses minimal systemic risk. At 0.5% of market cap, it is far lower than in the U.S. or China, lacks automatic triggers, and is concentrated in smaller stocks. The conclusion: the high-leverage structures most prone to "chain-reaction selling" have been substantially cleared. The market is transitioning from a liquidity-driven crash to one priced more on fundamentals. The article argues that the AI trend—centered on Korean memory chips—remains intact. This episode represents a painful but necessary clearing of crowded trades, not the end of the AI revolution. For investors, the key question is conviction in the long-term AI direction; if the trend is real, current volatility is a cost of entry, not a terminal risk.

链捕手1h ago

Global Stock Market's Storm Center: South Korea's Stock Market De-leveraging Is Largely Complete

链捕手1h ago

Trading

Spot

Hot Articles

Discussions

Welcome to the HTX Community. Here, you can stay informed about the latest platform developments and gain access to professional market insights. Users' opinions on the price of ETH (ETH) are presented below.

活动图片