The price performance of Ethereum was disappointing for most of May, as the bears seemed to be in full control. It doesn’t seem like much will change for the “King of Altcoins” in the new month, which appears to be a mere continuation of the established downward trend. According to a popular analyst on the social media platform X, the Ethereum price could be on its way down to around $1,850.
Is ETH Price Stuck In A Descending Channel?
Crypto analyst Burak Kesmeci took to the X platform to share his projection for the Ethereum price over the coming days. The market pundit posited that the second-largest cryptocurrency could decline toward the $1,822-$1,850 range if it fails to break the $2,033 resistance in the next few days.
This bearish outlook is premised on the fact that sellers have been in a dominant position in the short term and for much of the past month. This dominance is evident in the formation of a descending channel on the four-hour timeframe of the Ethereum price chart.
A descending channel is a technical analysis chart pattern characterized by two major trendlines: the upper boundary connecting the lower highs and the lower line connecting the lower lows. This chart formation is often correlated to a bearish structure, with the upper trendline acting as resistance and the lower boundary as the price floor.
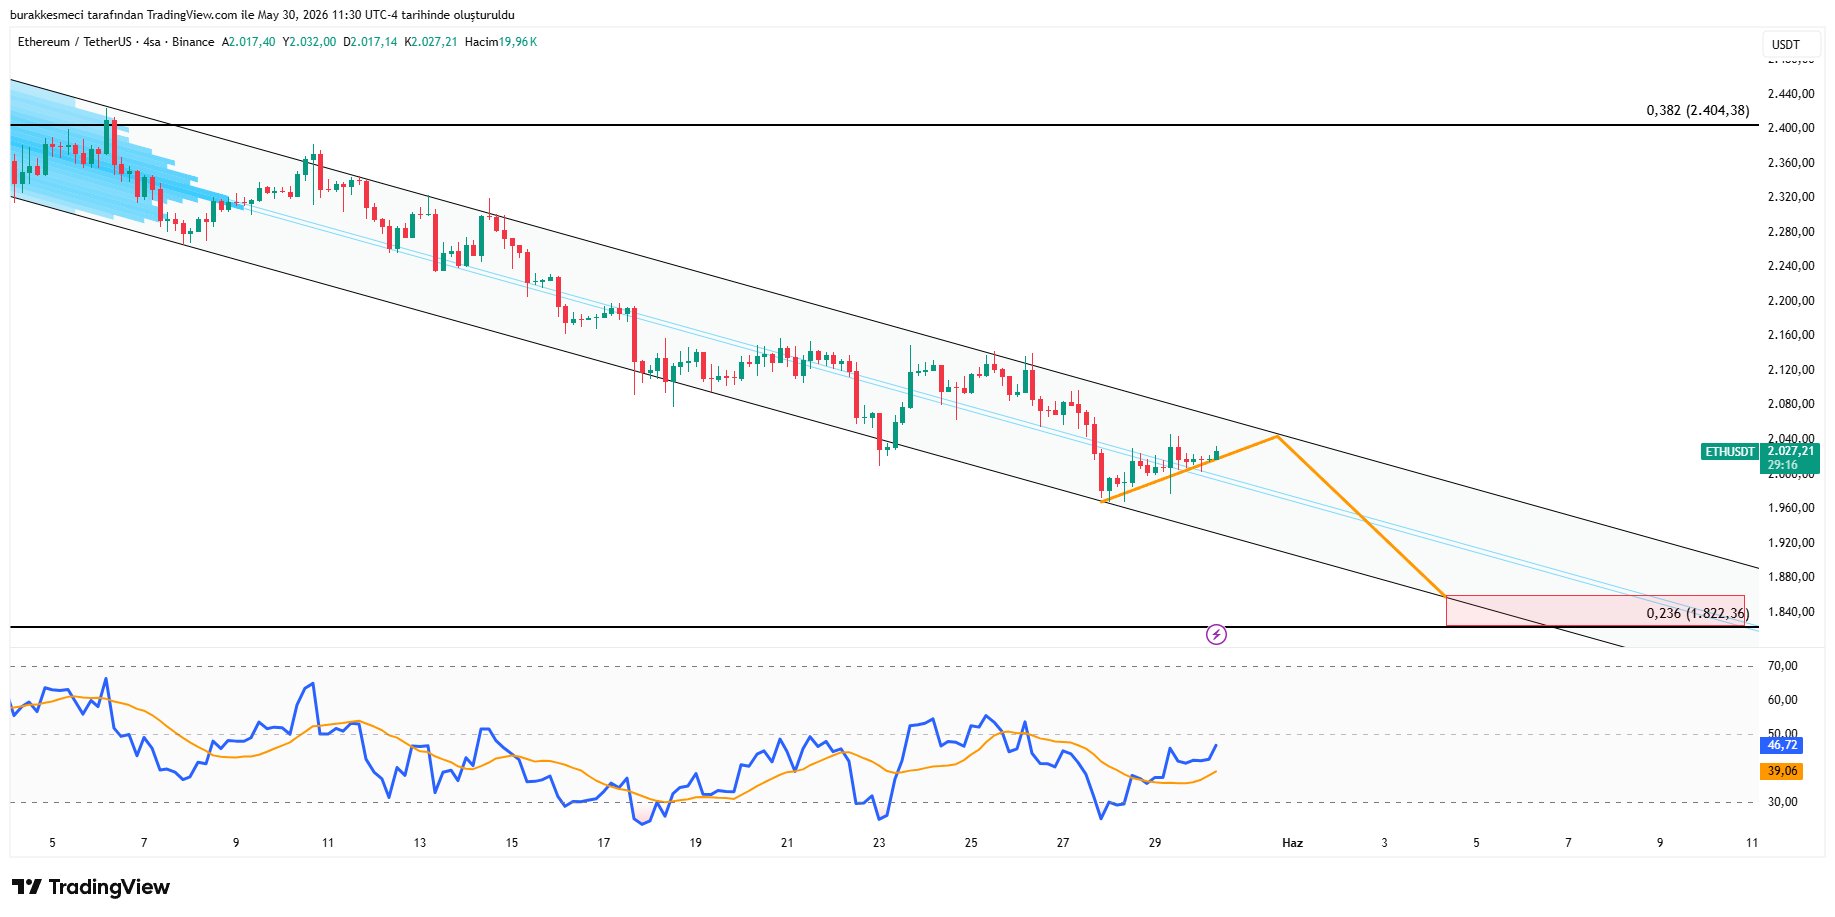
Source: @burak_kesmeci on X
According to Kesmeci, the persistence of the Ethereum price within the descending channel and the weak price momentum suggest that a downward move is on the cards. The crypto analyst highlighted that ETH could drop to the $1,822 – $1,850 range, so long as the overhead resistance at the upper boundary of $2,033 (Fibonacci 0.5) holds.
However, there is also the flipside scenario in which the price of Ethereum could break out toward $2,400 if the $2.033 resistance is breached. However, the decline toward the $1,850 region seems more likely, especially given current demand conditions.
Ethereum ETFs Post $241 Million In Outflows Over The Past Week
This dwindling demand in the Ethereum market is evident in rising spot ETF outflows, which climbed above $241 million over the past week. This past week’s record marked the third consecutive week with significant net outflows for the spot ETH exchange-traded funds.
The Ethereum price action over the past three weeks has been a fair reflection of this pessimistic market condition. According to CoinGecko data, the second-largest cryptocurrency has lost nearly 15% of its value in the last three weeks.
As of this writing, the price of ETH stands at around $2,023, with no significant change in the past 24 hours.

The price of ETH on the daily timeframe | Source: ETHUSDT chart on TradingView


