Ethereum Bearish Sentiment Intensifies As Taker Buy Sell Ratio Drops

bitcoinistPublished on 2026-02-15Last updated on 2026-02-15

Abstract

Ethereum's recent modest price recovery is overshadowed by a broader bearish structure, according to on-chain analysis. A key metric, the Taker Buy Sell Ratio on Binance, has plummeted to 0.97—its lowest level since November 2025. This indicates that aggressive sellers are dominating the futures market, signaling a significant shift in trader sentiment rather than a temporary reaction. While this doesn't guarantee an immediate sell-off, it suggests bears are more likely to profit in the short term. The market remains highly unstable; a sell-off could occur if spot demand fails to absorb the selling pressure, but a short squeeze is also a possibility if demand suddenly returns. Ethereum's price, at $2,085 at the time of writing, could move in either direction with high momentum.

Ethereum price might have experienced some modest recovery late last week. However, the popular altcoin still reflects a broader bearish structure. Interestingly, a recent on-chain evaluation has surfaced, which paints a dark picture for Ethereum’s mid-term future, as opposed to imagined sustained relief.

Taker Buy Sell Ratio Plummets To November 2025 Lows

In a recent post on QuickTake, market analyst CryptoOnchain reveals that Ethereum derivatives traders are currently being dominated by aggressive sellers as indicated by the Ethereum: Taker Buy Sell Ratio on Binance, smoothed over with the 30-day moving average.

For context, this metric measures whether aggressive market buyers or aggressive sellers are dominating the ETH futures market, and specifically on Binance (the world’s leading cryptocurrency exchange by trading volume). When the Taker Buy Sell ratio drops below the 1.00 threshold, it is a sign that taker sell volume is more than the taker buy volume.

Basically, this means that there are more aggressive sellers than there are buyers. On the other hand, sustained readings above 1.00 signal that the futures market is currently being dominated by aggressive buyers.

CryptoOnchain points out in his post that the metric’s readings currently sit around the 0.97 level, indicating that Ethereum’s current price action is being driven more by aggressive selling pressure. The 0.97 zone, interestingly, is the lowest since November, 2025. CryptoOnchain explains that this reveals a bigger sentiment shift among Ethereum futures traders over the past month, rather than being a temporary reaction to price action.
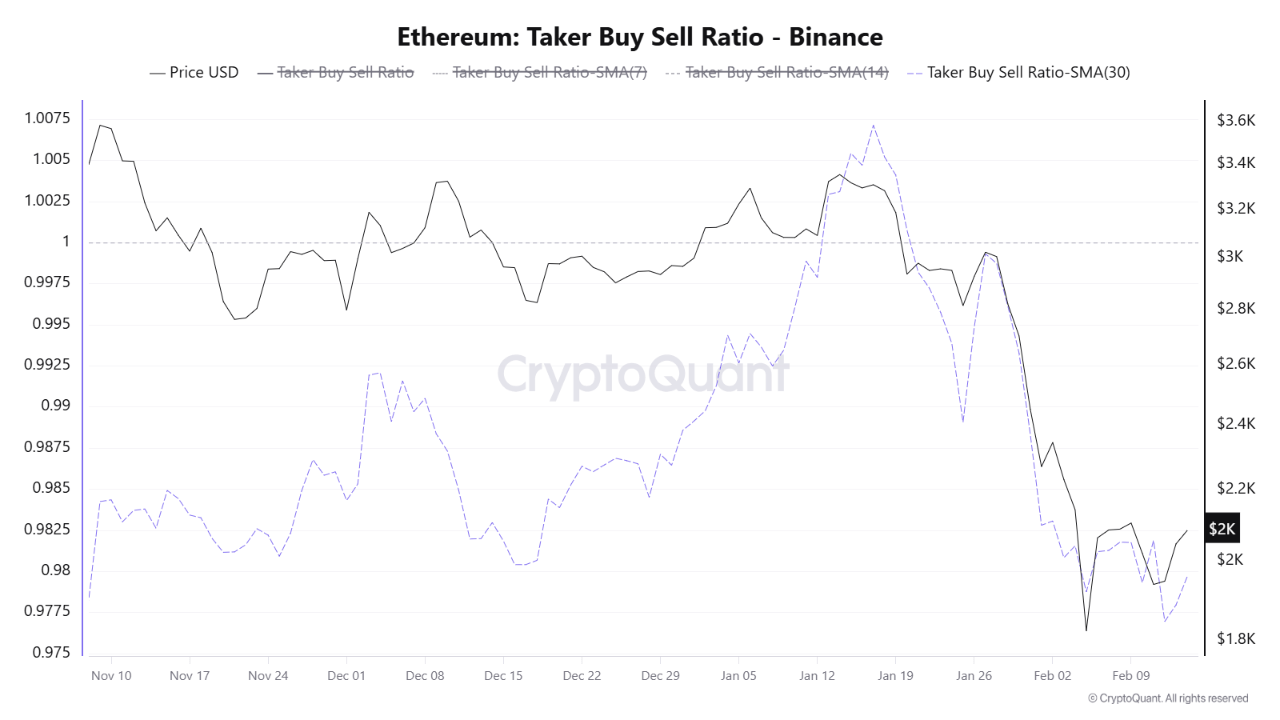
Source: CryptoQuant

What It Means For ETH Price

The decline of the Taker Buy Sell ratio to 0.97 does not guarantee an immediate sell-off; more accurately, it shows that the bears are more likely to profit from Ethereum in the short-term. In the event that this bearish pressure is absorbed by spot demand, a sell-off would not ensue. On the other hand, if demand at key support levels fails to buffer Ethereum’s fall, the second-largest cryptocurrency could fall further.

In addition, if there is a sudden injection of demand, the futures market simultaneously retains its extremely bearish sentiment; the Ethereum market could see a short squeeze, where the leveraged short positions are wiped out, thereby pushing prices to the upside with momentum.

Hence, the Ethereum market is still in a very unstable phase, as prices could go in either direction, and with high momentum, depending on what happens first. As such, market participants are advised to tread the charts with caution. As of this writing, Ethereum holds a valuation of $2,085, reflecting a slight 1.7% gain since the past day, according to data from CoinMarketCap.

ETH trading at $2,076 on the daily chart | Source: ETHSUDT chart on Tradingview.com

Featured image from Flickr, chart from Tradingview

Trending Cryptos

Related Questions

QWhat does the Taker Buy Sell Ratio dropping below 1.00 indicate for the Ethereum futures market?

AIt indicates that taker sell volume is greater than taker buy volume, meaning aggressive sellers are dominating the market.

QAccording to the article, what is the current level of Ethereum's Taker Buy Sell Ratio and why is it significant?

AThe current level is around 0.97, which is the lowest since November 2025, indicating a significant sentiment shift among futures traders towards bearishness.

QWhat are the two potential outcomes for Ethereum's price mentioned in the article, based on the current market pressure?

AIf bearish pressure is absorbed by spot demand, a sell-off may not happen. If demand at key support levels fails, the price could fall further. Alternatively, a sudden demand surge could cause a short squeeze, pushing prices up.

QWhich exchange's data is used for the Taker Buy Sell Ratio analysis in this article?

AThe analysis uses data from Binance, the world's leading cryptocurrency exchange by trading volume.

QWhat is the current price of Ethereum and its 24-hour performance as mentioned in the article?

AEthereum is trading at $2,085, reflecting a 1.7% gain over the past 24 hours.

Related Reads

Why Bitcoin Holds Above $64,000 After Fed's Hard Pause

**Bitcoin Stabilizes Near $64,000 Following Hawkish Fed Pause** The cryptocurrency market, led by Bitcoin, remained stable around $64,000 despite a volatile reaction to the latest U.S. Federal Reserve meeting. The Fed paused interest rates but signaled a hawkish stance, with three committee members voting for an increase—the highest dissent since 2016. This limits risk appetite but hasn't triggered panic selling. Key market highlights include Bitcoin ETFs seeing a net inflow of $32.1 million, breaking a streak of outflows, while Ethereum ETFs experienced outflows of $18.65 million. Liquidations affected about 90,000 traders. Technically, Bitcoin finds support around $63,000-$63,500, with major resistance near $66,000. While its price is about 49% below its all-time high, institutional demand via ETFs and the absence of mass capitulation support a potential recovery scenario in the second half of the year. Major altcoins showed mixed movements, with Solana attracting capital while Ethereum faced selling pressure despite strong on-chain metrics like a growing staking queue. Regulatory news took a pause as the U.S. Senate delayed the CLARITY Act vote until at least autumn. For the final trading day of July, U.S. inflation and consumer spending data will be crucial. Bitcoin's key levels to watch are $63,000 support and $66,000 resistance. Sustained ETF inflows and Bitcoin holding above $63,000 are seen as positive signs for a potential market recovery later in the year.

cryptonews.ru1h ago

Why Bitcoin Holds Above $64,000 After Fed's Hard Pause

cryptonews.ru1h ago

Trading

Spot

Hot Articles

Discussions

Welcome to the HTX Community. Here, you can stay informed about the latest platform developments and gain access to professional market insights. Users' opinions on the price of ETH (ETH) are presented below.

活动图片















