Ethereum And Solana Are Flashing Caution Signals With Negative Buy/Sell Pressure Data – What This Means

bitcoinistPublished on 2026-01-29Last updated on 2026-01-29

Ethereum and Solana are gradually demonstrating bullish movements following a rebound on Tuesday, but the broader outlook still appears to be bearish. On-chain metrics are flashing caution as selling pressure continues to dominate among investors of ETH and SOL, suggesting an extension of the ongoing volatile market.

Market Balance Tilts Bearish For Ethereum And Solana

While the broader cryptocurrency market has faced steady downside pressure over the past few weeks, the market dynamics of both Ethereum and Solana are undergoing a crucial shift. This shift is being reflected in the Buy/Sell Pressure Delta for ETH and SOL, which has recently turned negative.

The Buy/Sell Pressure Delta is a key metric that measures the imbalance between buying and selling forces in the market. It is worth noting that when the delta goes negative, it indicates a lack of bullish momentum since selling pressure is greater than purchasing pressure.

According to Alphractal, an advanced on-chain data analytics platform, the metric flipping negative suggests that Ethereum and Solana sellers are gaining control of the market. With buying momentum currently fading, the risk of short-term downside or consolidation becomes high.
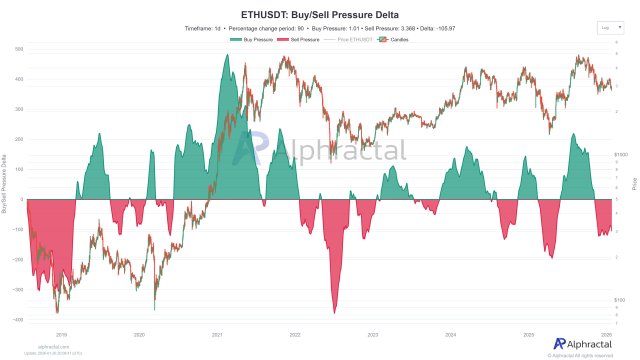
Selling pressure outweighing buying activity | Source: Chart from Alphractal on X

This shift typically points to trend exhaustion, not necessarily an immediate reversal. It also points to a cooling phase after periods of stronger momentum and buying activity. In some scenarios from the past, the platform highlighted that a negative Buy/Sell Pressure Delta has also led to price bottoms. However, this is mostly common when selling pressure starts to lose strength again, with capital flows favoring accumulation over distribution.

Furthermore, Alphractal noted that for this ongoing trend to signal a potential bottom in Ethereum and Solana prices, it is critical to monitor whether the delta is exhibiting stability or a recovery, rather than expanding further into negative territory. In the meantime, analyzing the lower timeframes would aid in spotting early signs of a shift back toward buying pressure.

At this point, it is not a standalone signal, and context matters. Price action, volume, and broader on-chain data must confirm whether the market is transitioning into a period of continuation or accumulation. As this imbalance develops across the two networks, it increases the downside risk and emphasizes how crucial it is to keep an eye on whether demand can stabilize or keep declining in the upcoming sessions.

ETH Position Inside A Dense Basis Cluster

Ethereum remains capped by the growing volatility across the crypto market, hovering below the $3,000 price mark. After delving into ETH’s recent price action, Chris Beamish has outlined that the leading altcoin is trading on a dense cost basis cluster.

The positioning carries significance as it represents a breakeven zone for many ETH holders. As ETH holds this zone, the market is leaning toward absorption and the formation of a base. However, a breakdown would move the price into thinner support where underwater supply may derisk.

ETH trading at $3,007 on the 1D chart | Source: ETHUSDT on Tradingview.com

Trending Cryptos

Related Questions

QWhat does a negative Buy/Sell Pressure Delta indicate for Ethereum and Solana according to the article?

AA negative Buy/Sell Pressure Delta indicates that selling pressure is greater than buying pressure, suggesting a lack of bullish momentum and that sellers are gaining control of the market.

QWhich on-chain analytics platform provided the data showing the negative Buy/Sell Pressure Delta for ETH and SOL?

AThe data was provided by Alphractal, an advanced on-chain data analytics platform.

QAccording to the analysis, what is the significance of Ethereum trading in a 'dense cost basis cluster'?

AIt represents a breakeven zone for many ETH holders. Holding this zone suggests market absorption and the potential formation of a base, while a breakdown could move the price into thinner support.

QWhat must happen for the negative Buy/Sell Pressure Delta to signal a potential price bottom for ETH and SOL?

AThe delta must show signs of stability or a recovery, rather than expanding further into negative territory, and this must be confirmed by price action, volume, and broader on-chain data.

QWhat is the current broader market outlook for Ethereum and Solana despite recent bullish movements?

AThe broader outlook still appears to be bearish, with on-chain metrics flashing caution as selling pressure continues to dominate, suggesting an extension of the ongoing volatile market.

Related Reads

Why Bitcoin Holds Above $64,000 After Fed's Hard Pause

**Bitcoin Stabilizes Near $64,000 Following Hawkish Fed Pause** The cryptocurrency market, led by Bitcoin, remained stable around $64,000 despite a volatile reaction to the latest U.S. Federal Reserve meeting. The Fed paused interest rates but signaled a hawkish stance, with three committee members voting for an increase—the highest dissent since 2016. This limits risk appetite but hasn't triggered panic selling. Key market highlights include Bitcoin ETFs seeing a net inflow of $32.1 million, breaking a streak of outflows, while Ethereum ETFs experienced outflows of $18.65 million. Liquidations affected about 90,000 traders. Technically, Bitcoin finds support around $63,000-$63,500, with major resistance near $66,000. While its price is about 49% below its all-time high, institutional demand via ETFs and the absence of mass capitulation support a potential recovery scenario in the second half of the year. Major altcoins showed mixed movements, with Solana attracting capital while Ethereum faced selling pressure despite strong on-chain metrics like a growing staking queue. Regulatory news took a pause as the U.S. Senate delayed the CLARITY Act vote until at least autumn. For the final trading day of July, U.S. inflation and consumer spending data will be crucial. Bitcoin's key levels to watch are $63,000 support and $66,000 resistance. Sustained ETF inflows and Bitcoin holding above $63,000 are seen as positive signs for a potential market recovery later in the year.

cryptonews.ru41m ago

Why Bitcoin Holds Above $64,000 After Fed's Hard Pause

cryptonews.ru41m ago

Trading

Spot

Hot Articles

Discussions

Welcome to the HTX Community. Here, you can stay informed about the latest platform developments and gain access to professional market insights. Users' opinions on the price of ETH (ETH) are presented below.

活动图片