Ethereum Activity Soars: Active Addresses Set New Record

bitcoinistPublished on 2026-03-21Last updated on 2026-03-21

Abstract

Ethereum has set a new all-time high in its 30-day moving average of active addresses, indicating a significant surge in user activity on the network. This increase occurred in February 2026, a period during which Bitcoin experienced a downturn—breaking the conventional pattern where address activity typically cools during bear markets. Despite this record engagement, the U.S. Ethereum spot ETFs have recently seen two consecutive days of net outflows, totaling over $191 million. Meanwhile, Ethereum’s price remains steady at approximately $2,100.

Data shows the Ethereum network has recently set a new all-time high (ATH) in the Active Addresses indicator, suggesting elevated user activity.

30-Day MA Of Ethereum Active Addresses Has Reached A New ATH

As highlighted by CryptoQuant community analyst Maartunn in an X post, the Ethereum Active Addresses has set a new record in its 30-day moving average (MA) value. This on-chain indicator keeps track of the unique total number of addresses that are participating in some kind of transaction activity on the blockchain every day.

When the value of this metric rises, it means the number of users interacting on the network is going up. Such a trend suggests the cryptocurrency is attracting attention. On the other hand, the indicator going down suggests addresses are turning inactive, potentially because investors have lost interest in the blockchain.

Now, here is the chart shared by Maartunn that shows the trend in the 30-day MA of the Ethereum Active Addresses over the past decade:

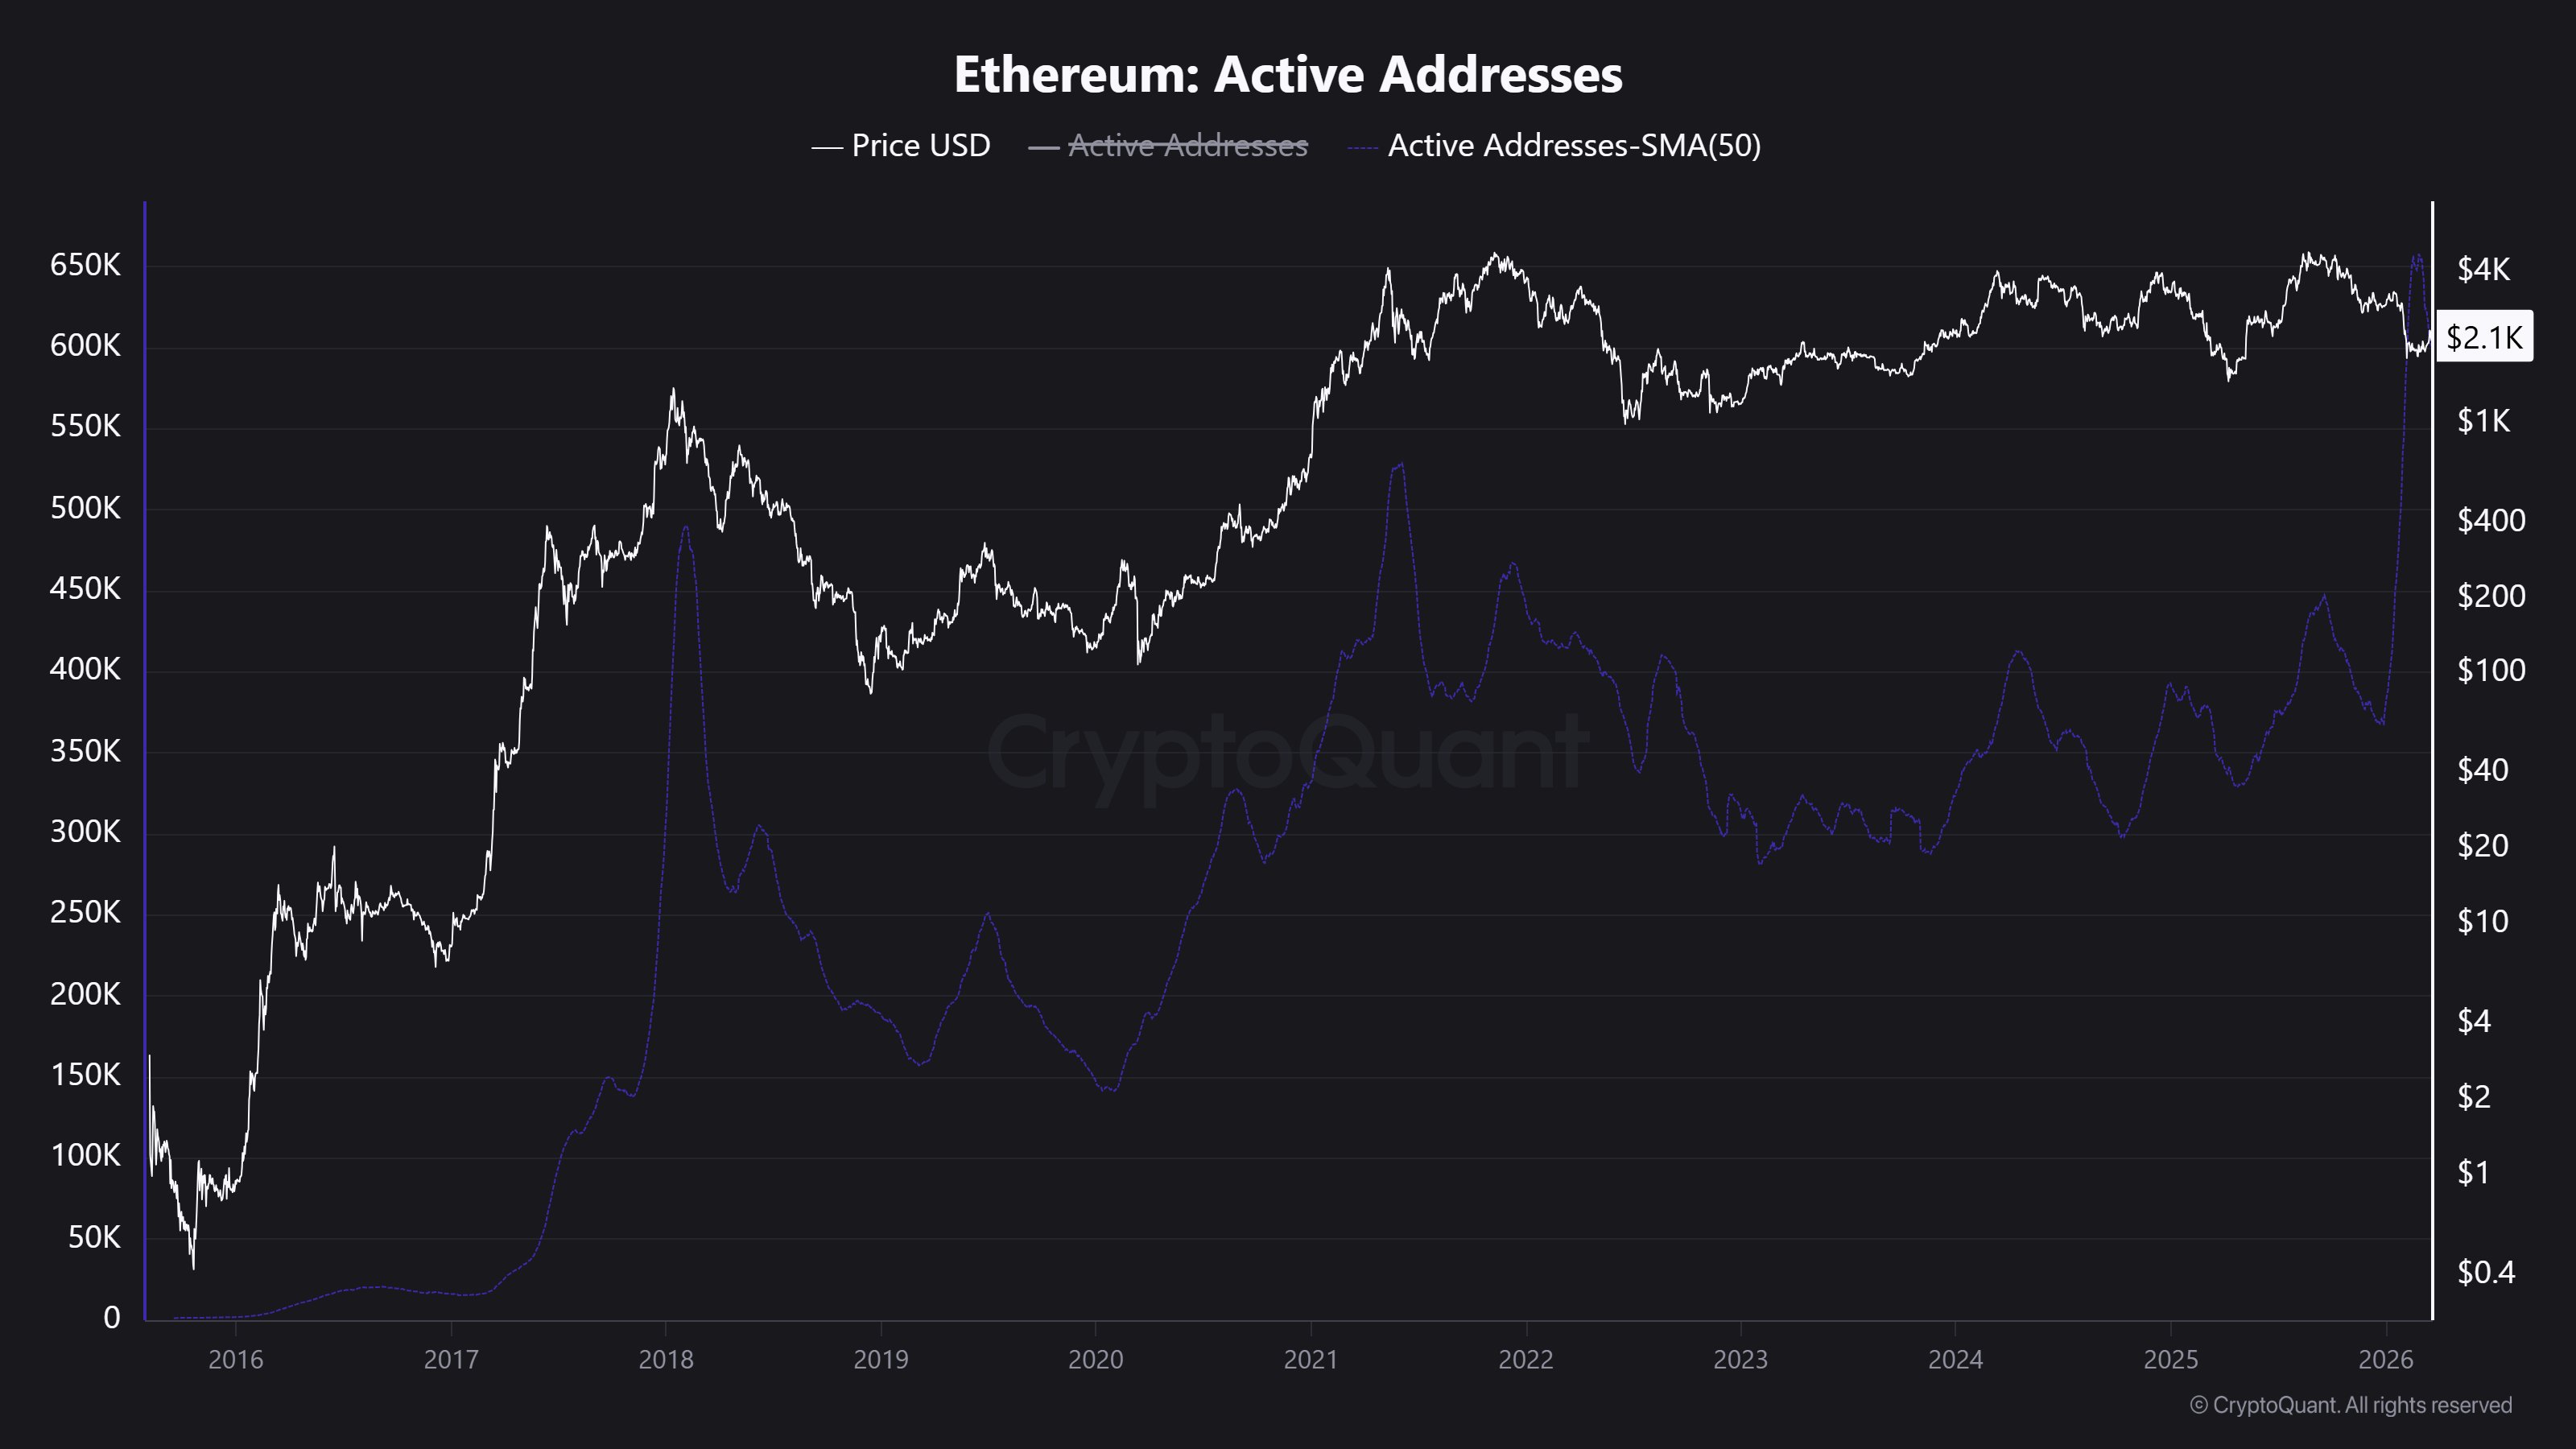
Looks like the value of the metric has shot up recently | Source: @JA_Maartun on X

As displayed in the above graph, the 30-day MA of the Ethereum Active Addresses saw a rise alongside the bull rally in the second half of 2025, implying user activity ramped up. Price surges tend to be exciting to investors, so it’s not unusual to see transaction interest go up alongside them.

From the chart, it’s visible that once the bearish market shift occurred in the last quarter of 2025, the Active Addresses also started going down, a sign that investors began to shift their attention away from the network.

In 2026 so far, however, something extraordinary has happened. While Bitcoin saw another leg down during February, what actually accompanied it was a sharp spike in the indicator that took its value to a new ATH.

In the past, cyclical peaks in the Active Addresses has tended to coincide with major bull runs, with bear markets usually witnessing a cooldown in the metric. As such, the latest trend in the Ethereum network has broken the conventional pattern.

In some other news, the Ethereum spot exchange-traded funds (ETFs) started on a green streak earlier, but the last two days has seen the netflow trend flip back to negative, as data from SoSoValue shows.

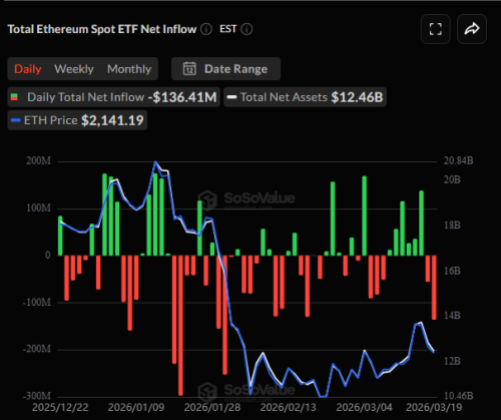
How the US ETH spot ETF netflow has changed over the last few months | Source: SoSoValue

As is visible in the above graph, the US Ethereum spot ETFs have seen $136.4 million flow out during the past day. The day before, they saw outflows of over $55 million. While these red netflow spikes haven’t retraced all the inflows that occurred during the early six-day streak, they still hint at a change of winds in the market.

ETH Price

At the time of writing, Ethereum is floating around $2,100, unchanged from one week ago.

Looks like the price of the coin has retraced from its highs | Source: ETHUSDT on TradingView

Related Questions

QWhat new all-time high has the Ethereum network recently set according to the article?

AThe Ethereum network has set a new all-time high (ATH) in the 30-day moving average of Active Addresses.

QWhat does a rise in the Active Addresses indicator typically signify for the Ethereum network?

AA rise in the Active Addresses indicator signifies that the number of users interacting on the network is increasing, suggesting the cryptocurrency is attracting more attention.

QHow did the article describe the recent trend in Ethereum Active Addresses compared to conventional patterns?

AThe recent sharp spike in Active Addresses to a new ATH during a period when Bitcoin's price declined broke the conventional pattern where peaks in this metric usually coincide with bull runs and cool down during bear markets.

QWhat was the net flow status of US Ethereum spot ETFs in the last two days mentioned in the article?

AIn the last two days, the US Ethereum spot ETFs saw net outflows, with over $55 million the day before and $136.4 million on the past day, flipping the trend to negative.

QWhat was the price of Ethereum at the time the article was written?

AAt the time of writing, Ethereum was floating around $2,100.

Related Reads

South Korean Stocks Plunge, Global Funds Liquidate: Has the Semiconductor Fundamentals Really Changed?

South Korean stocks experienced their sharpest decline of the year, with the KOSPI index plunging nearly 9% on Monday, triggering a market circuit breaker. Leading semiconductor firms Samsung Electronics and SK Hynix were heavily sold off, raising questions about whether the AI-driven bull market has reached an inflection point. This sell-off was largely triggered by a significant drop in the U.S. semiconductor sector late last week. Concurrently, NVIDIA CEO Jensen Huang visited Seoul over the weekend, meeting with top executives from SK Group, Samsung, LG, and NAVER. He announced a new multi-year partnership with SK Hynix to co-develop next-generation memory products for AI data centers. Huang emphasized that AI infrastructure build-out remains in its early stages, creating a stark contrast between market panic and ongoing, strengthened industry collaboration. The article argues that South Korea has become one of the most sensitive markets for global AI-related capital flows, functioning like a large AI memory ETF due to the heavy weighting of its chipmakers. The current market turmoil reflects a shift in investor focus: from simply betting on overall AI growth to scrutinizing which companies will actually capture the profits from that growth. This "profit pool reassessment" phase is causing high volatility based on supply chain news and earnings guidance. Ultimately, the direction of the Korean market will be determined by external factors—NVIDIA's orders, HBM supply-demand dynamics, and capital expenditures from cloud service providers—rather than domestic conditions. The disconnect between sharp price corrections and continued strong signals from the industry core leaves the market at a crossroads, awaiting clearer data on the durability of AI infrastructure demand.

marsbit31m ago

South Korean Stocks Plunge, Global Funds Liquidate: Has the Semiconductor Fundamentals Really Changed?

marsbit31m ago

Trump in Talks with AI Companies Over Profit Sharing, A Narrative Pressure of Industrial Revolution Scale Begins

In recent AI market discussions, a new dimension beyond growth and profits has emerged: the question of how the immense wealth potentially generated by AI should be shared with the wider public. Triggered by reports of White House officials discussing "voluntary equity transfers" with top AI firms, similar to models like Alaska's Permanent Fund, the conversation focuses on public wealth funds. OpenAI's own whitepaper proposes such funds, allowing households without direct tech stock ownership to benefit from AI gains. More radical proposals, like Bernie Sanders' call for high public equity stakes and board seats, represent an extreme end of the spectrum. Currently, these are early-stage policy probes, not enacted laws. OpenAI's initiative is seen as an attempt to secure "social license" for its future expansion, mitigating risks of public backlash, stricter regulation, or anti-trust actions as AI's economic impact grows. The core market implication is the introduction of a "policy discount" to AI valuations, particularly for private model companies like OpenAI, Anthropic, and xAI. Investors must now consider not just future earnings but also what portion might be allocated to public mechanisms. The impact varies greatly based on the mechanism. A small, voluntary transfer of non-voting economic rights (e.g., 5%) acts as a quantifiable long-term cost. Government acquisition of economic rights via warrants tied to support differs from direct equity with governance power. The most disruptive scenario would be forced high-percentage public ownership affecting control and innovation incentives. Key signals to watch include whether other AI companies follow suit, if the White House formalizes proposals, related disclosures in future IPO documents, and any market price reactions. For now, this represents a shift from pricing pure AI growth to pricing its potential distribution. A manageable, voluntary economic share is akin to an insurance cost for societal acceptance, while a forced shift toward control and governance would fundamentally alter valuation logic.

marsbit35m ago

Trump in Talks with AI Companies Over Profit Sharing, A Narrative Pressure of Industrial Revolution Scale Begins

marsbit35m ago

From Record Highs to a Two-Week Low: Why Did AI Concept Stocks Suddenly Pull Back?

From Record Highs to Two-Week Lows: Why Did AI Stocks Suddenly Pull Back? U.S. stock indices, led by the tech-heavy Nasdaq 100, fell sharply to two-week lows. This marked a reversal from earlier in the week when AI infrastructure and semiconductor stocks had propelled major indices to record highs. Investors are rotating out of these previously high-flying tech sectors into other areas. The sell-off was driven by profit-taking and concerns that the AI rally had become overextended, exacerbated by chipmaker Broadcom's sales outlook falling short of lofty market expectations. The decline accelerated following a stronger-than-expected U.S. May nonfarm payrolls report, which showed 172,000 jobs added versus an estimated 88,000. This data sparked a jump in bond yields, with the 10-year Treasury yield rising to 4.553%, as it reinforced market speculation that the Federal Reserve's next move could be a rate hike rather than a cut. Globally, equities also declined, with European and Asian markets falling. Within the U.S. market, chip and AI-related stocks like Super Micro Computer and Arm Holdings led the losses, dropping over 7%. Cryptocurrency-linked stocks and mining shares also fell sharply amid drops in Bitcoin and commodity prices. While the overall Q1 earnings season remained solid, with 83% of S&P 500 companies beating estimates, the weakness was concentrated in tech. Excluding the tech sector, Q1 earnings growth was around 3%, the weakest in two years.

marsbit35m ago

From Record Highs to a Two-Week Low: Why Did AI Concept Stocks Suddenly Pull Back?

marsbit35m ago

JP Morgan Mid-Year Research Report Analysis: The AI Supercycle is Not Over, Reduce Cash Holdings + Allocate to Real Assets

JP Morgan's 2026 Mid-Year Outlook argues the AI supercycle is far from over, despite market pessimism. The report advises clients to reduce cash holdings, increase allocations to real assets as an inflation hedge, and focus on emerging markets. Key conclusions include: 1. **AI Supercycle Intact**: Hyperscalers' 2026 capex forecasts exceed $650B, with AI contributing to GDP growth. However, their financial profile is shifting toward heavy investment, compressing free cash flow. 2. **SaaS Disruption**: Traditional software companies are being negatively impacted by AI, with significant stock declines and pressure in credit markets. 3. **Persistent Inflation**: Core inflation is structurally higher post-pandemic. Holding excess cash and bonds leads to real wealth erosion. Recommendations include commodities, infrastructure, real estate, and gold. 4. **Geopolitical Shocks & Opportunities**: The Hormuz Strait blockade caused a major oil shock, but JP Morgan views the subsequent equity market pullback as a buying opportunity. "Fragmentation" is creating pockets of value, notably in resource-rich Latin America, AI-supply-chain-linked East Asia, and deeply discounted Chinese equities, where a policy shift could trigger a re-rating. 5. **Regional Views**: The firm is cautious on Europe due to high energy costs and lower innovation investment, preferring US and select EM exposures. In short, JP Morgan sees market volatility as an entry point but recommends a portfolio pivot: favor AI infrastructure, real assets, and EM, while avoiding excess cash, vulnerable software firms, and traditional 60/40 stock-bond allocations.

marsbit1h ago

JP Morgan Mid-Year Research Report Analysis: The AI Supercycle is Not Over, Reduce Cash Holdings + Allocate to Real Assets

marsbit1h ago

Trading

Spot
Futures

Hot Articles

Discussions

Welcome to the HTX Community. Here, you can stay informed about the latest platform developments and gain access to professional market insights. Users' opinions on the price of ETH (ETH) are presented below.

活动图片