Technical analysis of Dogecoin’s price action on the daily candlestick timeframe chart shows that the meme coin has spent the past several months grinding lower inside a clearly defined descending channel. However, technical analysis proposes that the structure may be nearing its end.
A daily chart shared on X by crypto analyst Jonathan Carter points to a setup that shows Dogecoin is about to break out of the descending channel. Although the meme coin has yet to confirm a full breakout, the chart now shows multiple conditions aligning that traders are closely watching.
Descending Channel Nearing Its Breaking Point
Dogecoin has spent an extended period moving within a declining structure that has repeatedly limited upside attempts since September 2025. This prolonged compression has kept price action controlled and largely predictable, but it has also stored directional pressure beneath the surface. Each attempt to move higher was previously rejected at the upper boundary, keeping the price compressed into a descending channel.
That structure, however, now appears to be weakening. According to technical analysis from Jonathan Carter, that pressure is now beginning to tilt upward, with recent trading behavior showing less follow-through from sellers than in recent weeks.
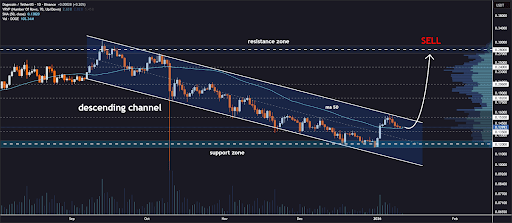
Recent candles show Dogecoin pushing higher from the lower boundary of the channel and pressing toward its upper trendline. Although it was rejected at the upper boundary early January, it hasn’t veered far away from the top of the channel. This is important because descending channels often act as continuation patterns only until buying pressure overwhelms sellers at resistance.
50-Day Moving Average And The Path Back To $0.30
One of the more notable details on the chart is Dogecoin’s interaction with the 50-day moving average. After spending weeks trading below this level, price has now reclaimed it and is attempting to hold above it.
Holding above the 50-day average strengthens the case that the current move is not just another short-lived bounce. As long as the Dogecoin price continues to hold above this moving average, then the bullish outlook is valid.
If Dogecoin manages to break cleanly above the channel resistance, the analysis outlines a sequence of upside levels that could come into play quickly. Initial follow-through would place the price back into the mid-$0.15 range, followed by a push toward the high-$0.18s and the $0.20 region, areas that previously acted as congestion zones.
After that, the chart points to $0.24 as the next target and then finally $0.28 to $0.30 as the last recovery target zone before any rejection comes into the picture.
These are short- to mid-term price targets, not long-term projections. These targets are very feasible and can even be reached within the next few weeks if a bullish wave of sentiment were to sweep across the entire crypto market.