Bouncing Into Supply

insights.glassnodePublished on 2026-01-14Last updated on 2026-01-14

Abstract

Bitcoin has entered a new year testing a critical supply zone between $93k–$110k, where Long-Term Holder (LTH) supply from mid-2025 has repeatedly capped upward moves. While LTH distribution has slowed, the aggressive selling of late 2025 has eased. The market’s ability to hold above the Short-Term Holder cost basis of $98.3k is key for confidence. Spot and institutional flows are stabilizing, with ETFs turning net positive, but futures-driven price action lacks strong volume, relying on short squeezes. Options markets show low implied volatility with a bias for downside protection, indicating deferred risk rather than resolved uncertainty. Overall, the structure is improving, yet the rally needs sustained spot demand to transition into a durable bull trend.

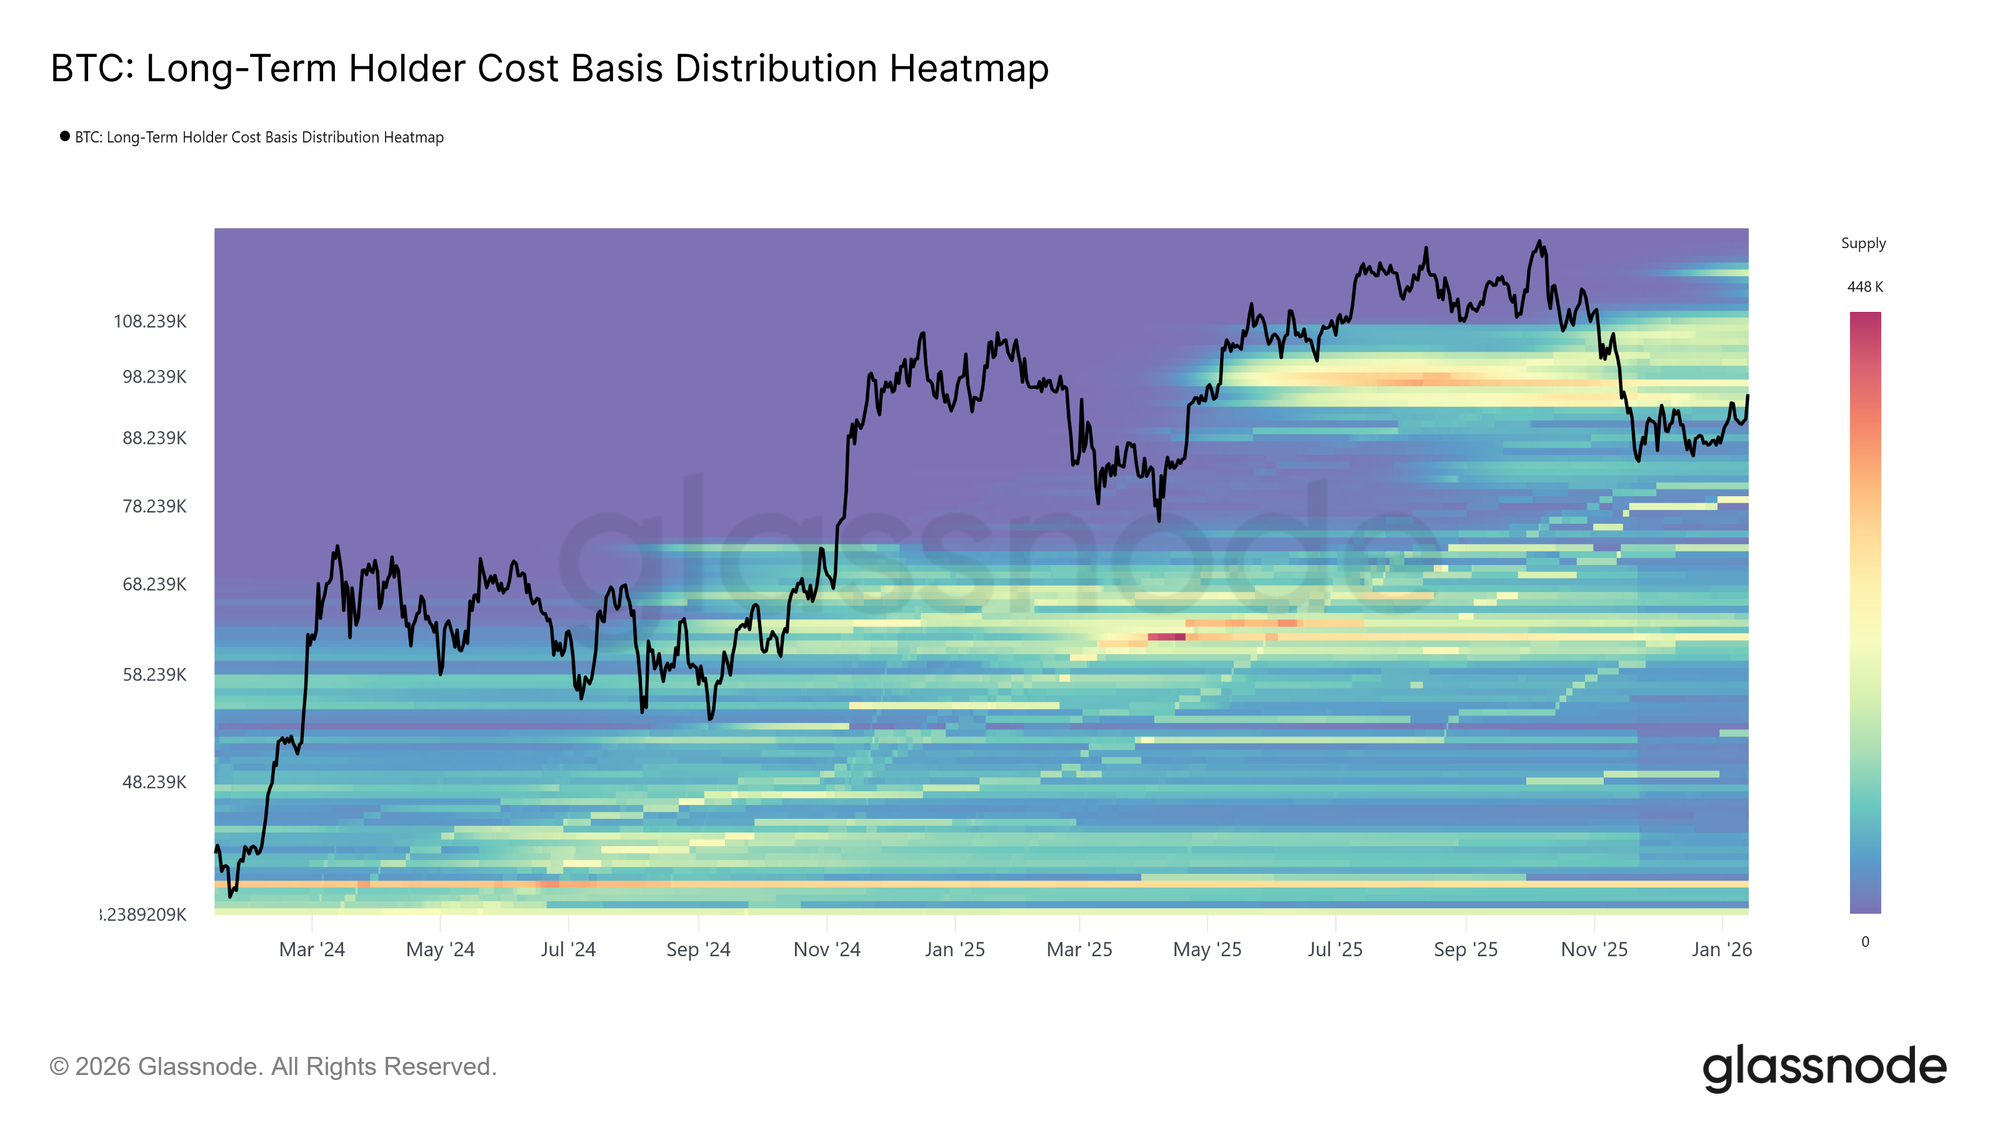
Bitcoin has entered the new year with constructive momentum, posting two consecutive higher highs and extending price to $95.6k. This early-year advance, however, has carried price directly into a historically significant supply zone. The current market level sits within a dense cluster of Long-Term Holder supply accumulated between April and July 2025, a period marked by sustained distribution near cycle highs.

As shown by the Long-Term Holder Cost Basis Distribution Heatmap, rebounds since November 2025 have repeatedly stalled at the lower boundary of this cluster, spanning approximately $93k to $110k. Each attempt higher has encountered renewed sell-side pressure, preventing price from sustaining a structural recovery.

This region has consistently acted as a transition barrier, separating corrective phases from durable bull regimes. With price once again pressing into this overhead supply, the market now faces a familiar test of resilience, where absorbing long-term holder distribution remains a prerequisite for any broader trend reversal.
Live Chart

Confidence at Cost Basis

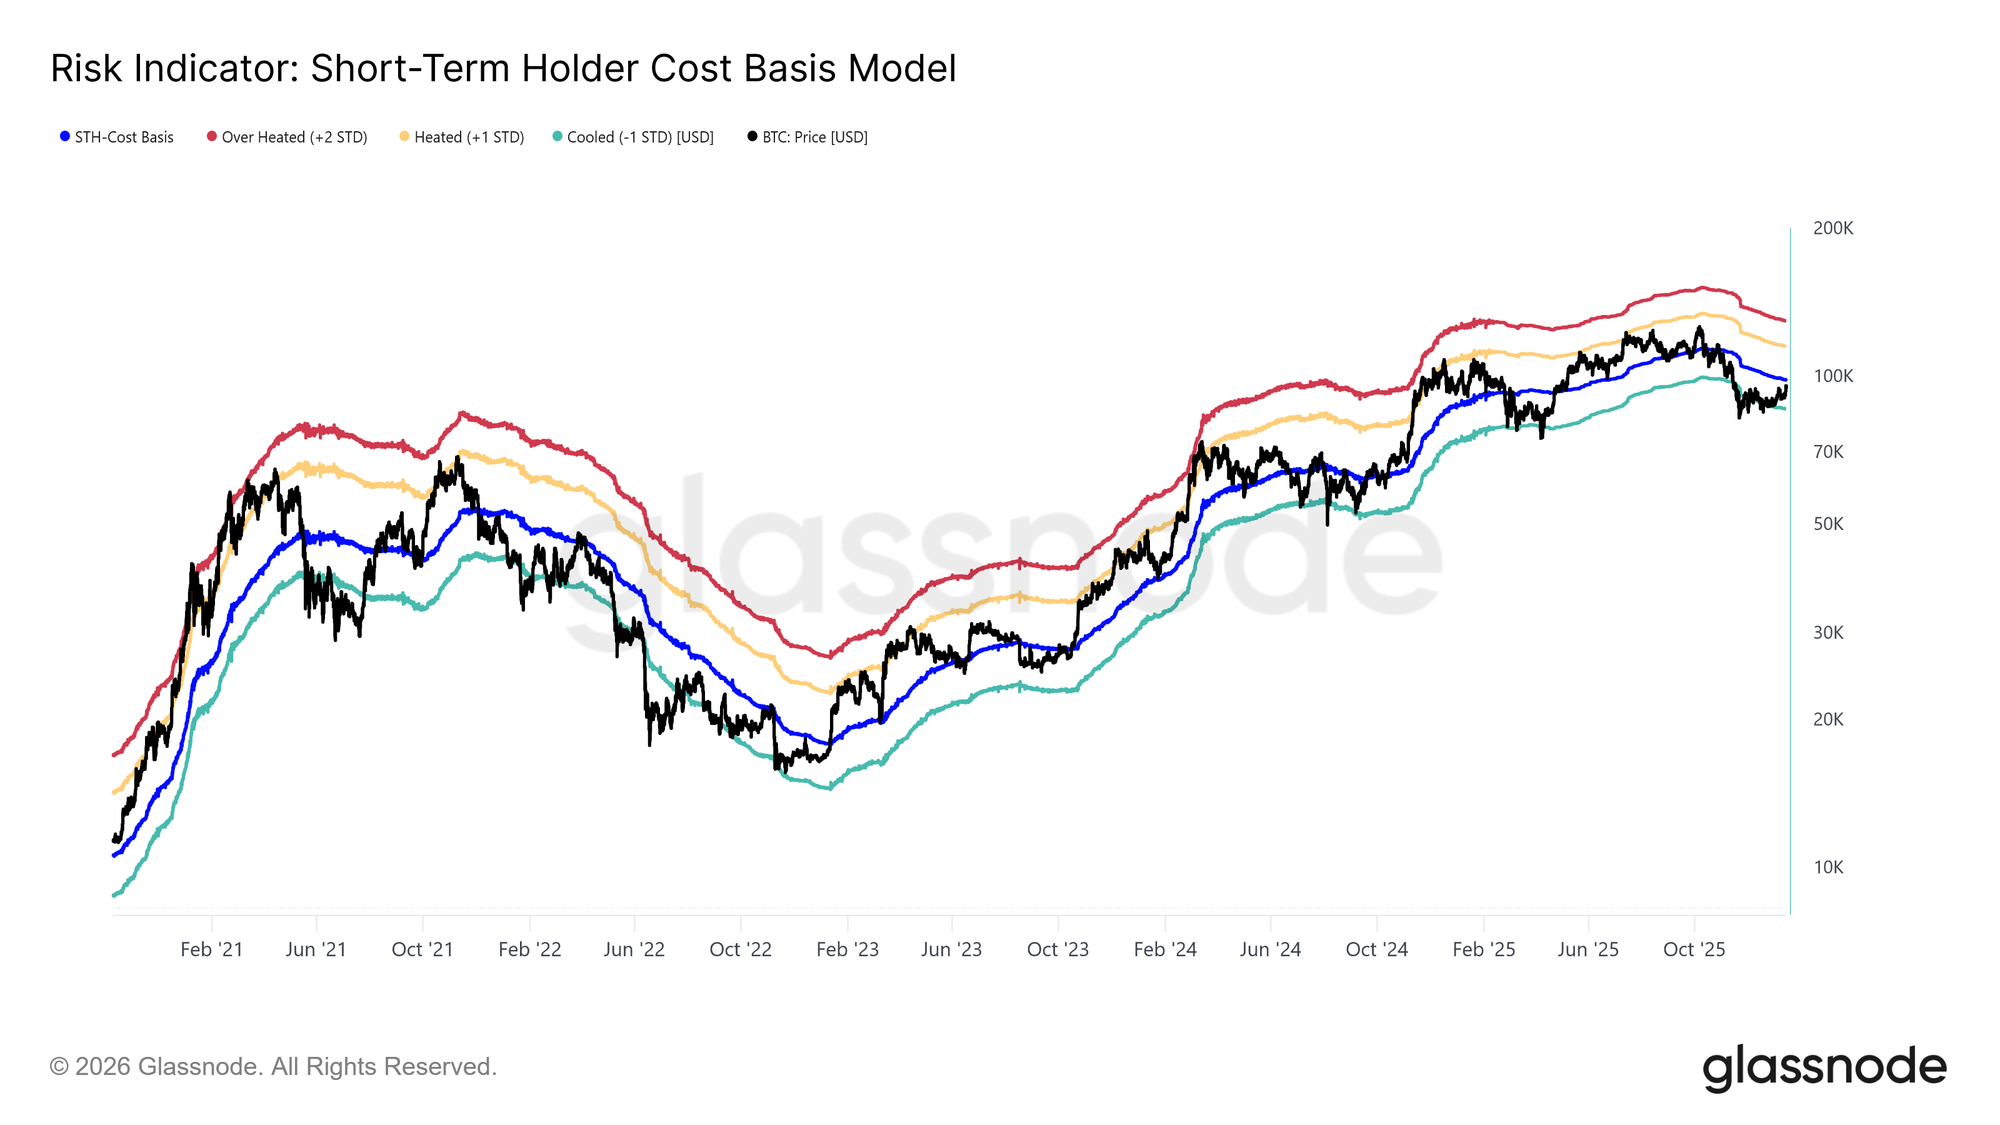
Facing renewed sell-side pressure from top buyers, attention shifts toward the Short-Term Holder cost basis, currently situated at $98.3k. This level represents the aggregate entry price of recent investors and serves as a critical gauge of market confidence. Sustained trading above this threshold would indicate that new demand is absorbing overhead supply, allowing recent buyers to remain profitable.

Historically, reclaiming and holding above the Short-Term Holder cost basis has marked the transition from corrective phases into more durable uptrends. Conversely, repeated failure to stabilize above this level risks reinforcing defensive behaviour among newer participants. As such, the ability of price to consolidate above $98.3k remains a necessary condition for restoring confidence in trend continuation and establishing the foundations for a sustainable rally.
Live Chart

LTH Distribution Slows

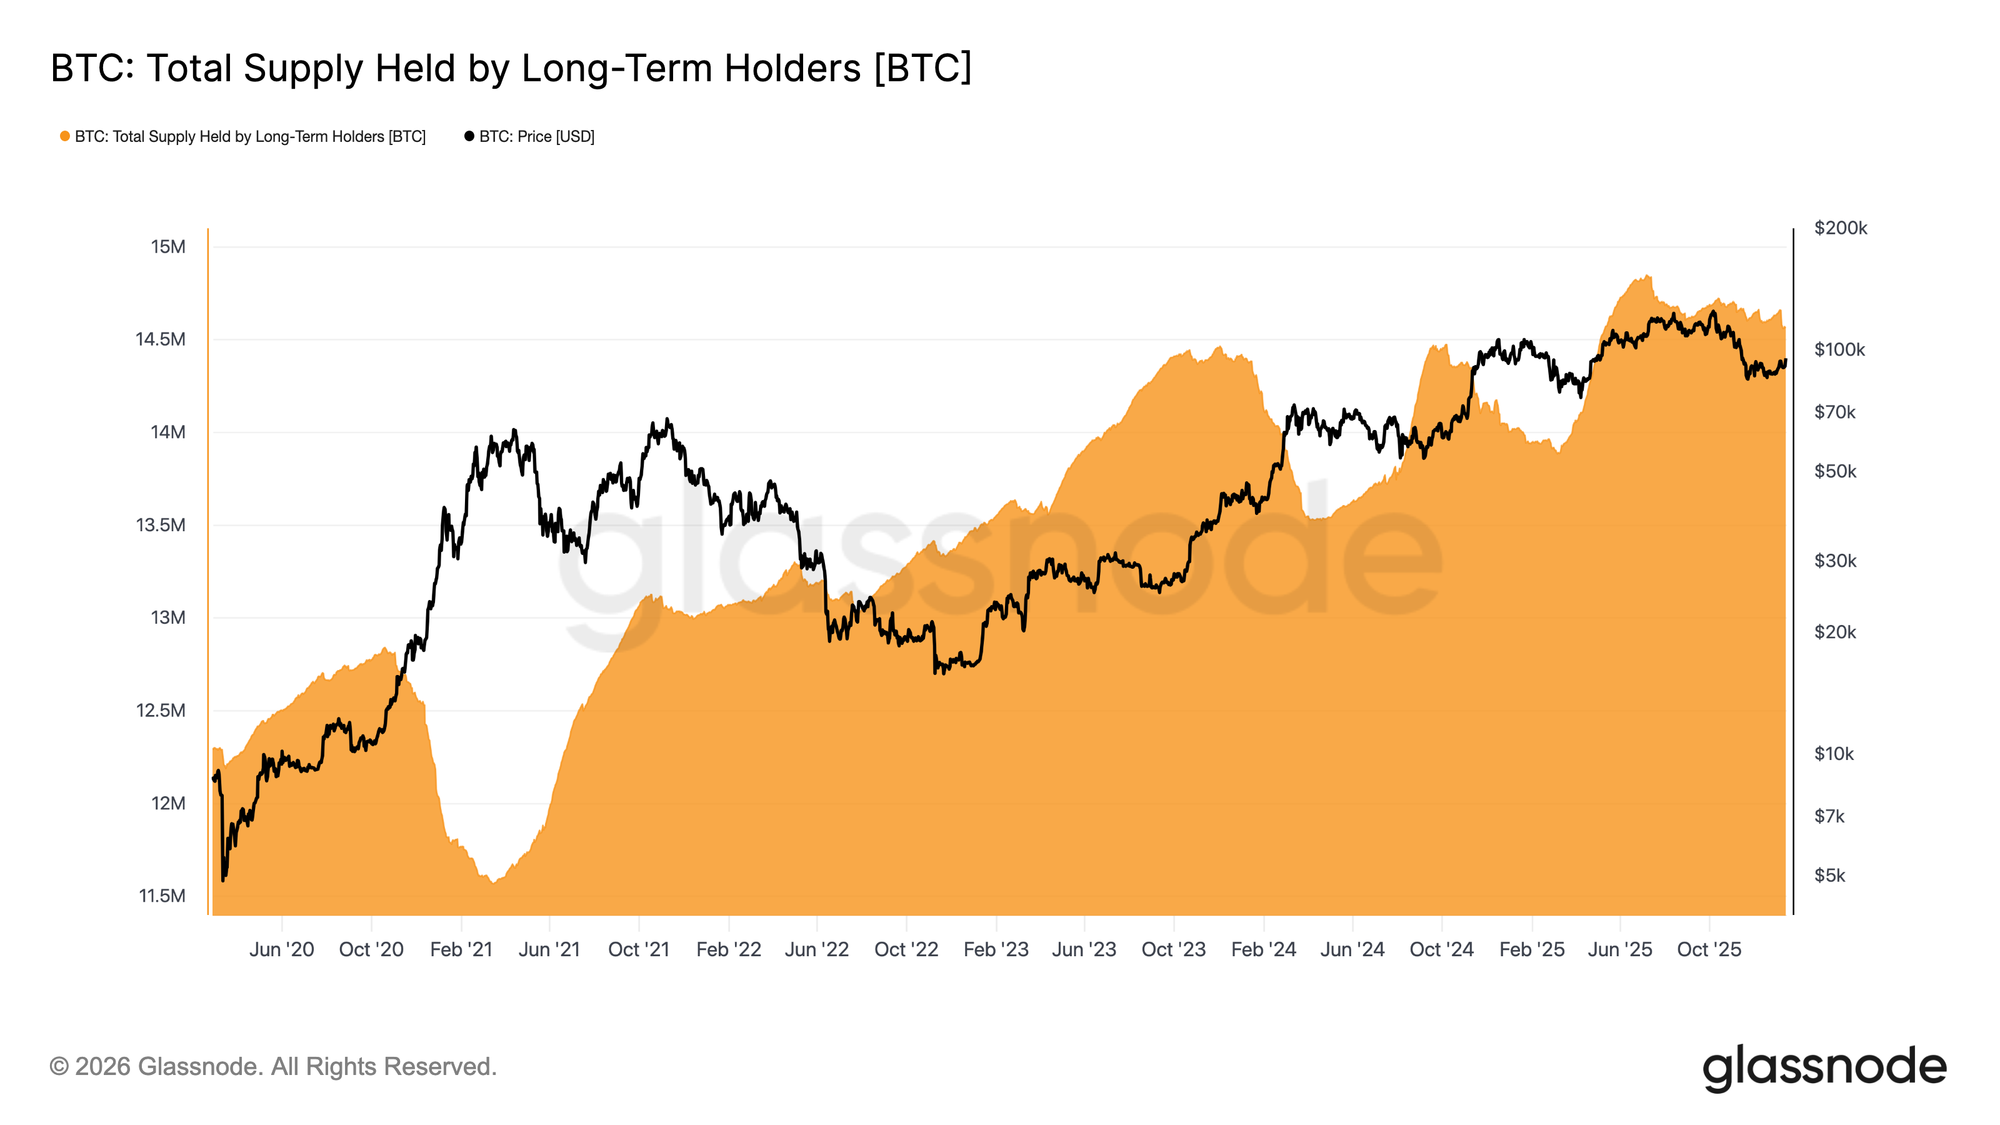
With price pressing into long-term holder supply, focus shifts to whether these investors are accelerating distribution or beginning to ease sell-side pressure. One useful gauge is the Total Supply Held by Long-Term Holders, which reflects the balance between coins maturing beyond the ~155-day threshold and coins being spent.

Currently, Long-Term Holder supply continues to trend lower, but the rate of decline has slowed materially compared to the aggressive distribution seen throughout Q3 and Q4 2025. This indicates that long-term holders remain net sellers, though their selling intensity is moderating.

For a sustainable rally to emerge, the market must transition into a regime where maturation supply outpaces long-term holder spending. Such a shift would push LTH supply higher, a structure last observed during Aug 2022–Sep 2023 and Mar 2024–Jul 2025, both periods that preceded stronger and more durable trend recoveries.
Live Chart

Demand Versus Distribution

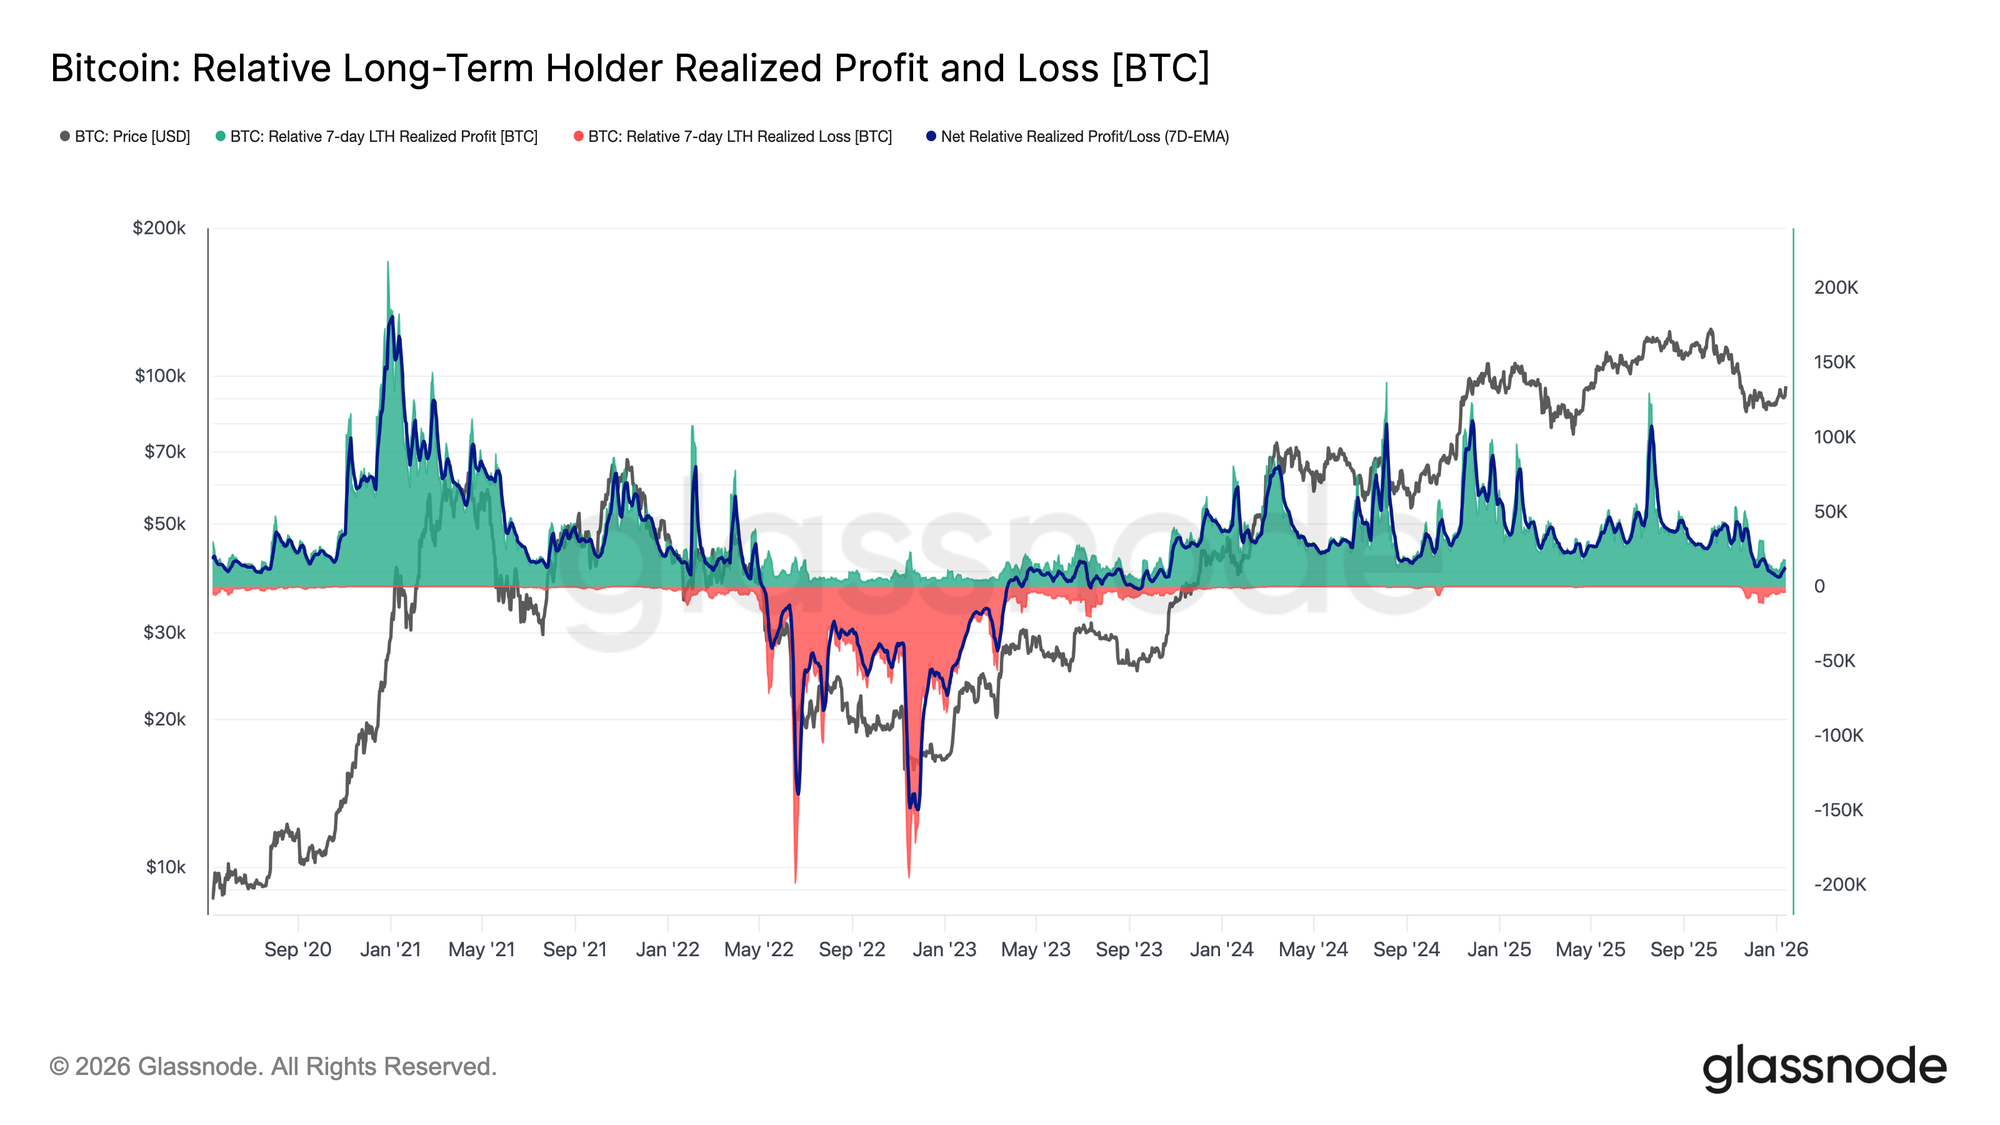
All in all, long-term holders who accumulated during Q2 2025 remain the most likely source of sell-side pressure should price decisively cut through the upper supply cluster. Their behaviour is well captured by the Net Realized Profit and Loss of Long-Term Holders, which currently reflects a markedly cooler distribution regime.

At present, long-term holders are realizing approximately 12.8k BTC per week in net profit, a substantial slowdown compared to the cycle peaks above 100k BTC per week. This moderation suggests profit-taking remains active, but far less aggressive than during prior distribution phases.

What follows will depend primarily on the demand side’s ability to absorb this supply, particularly from investors accumulated over Q2 2025. Failure to hold above the True Market Mean at ~$81k, in the long term, would significantly increase the risk of a deeper capitulation phase, reminiscent of the April 2022 to April 2023 period.
Live Chart

Off-Chain Insights

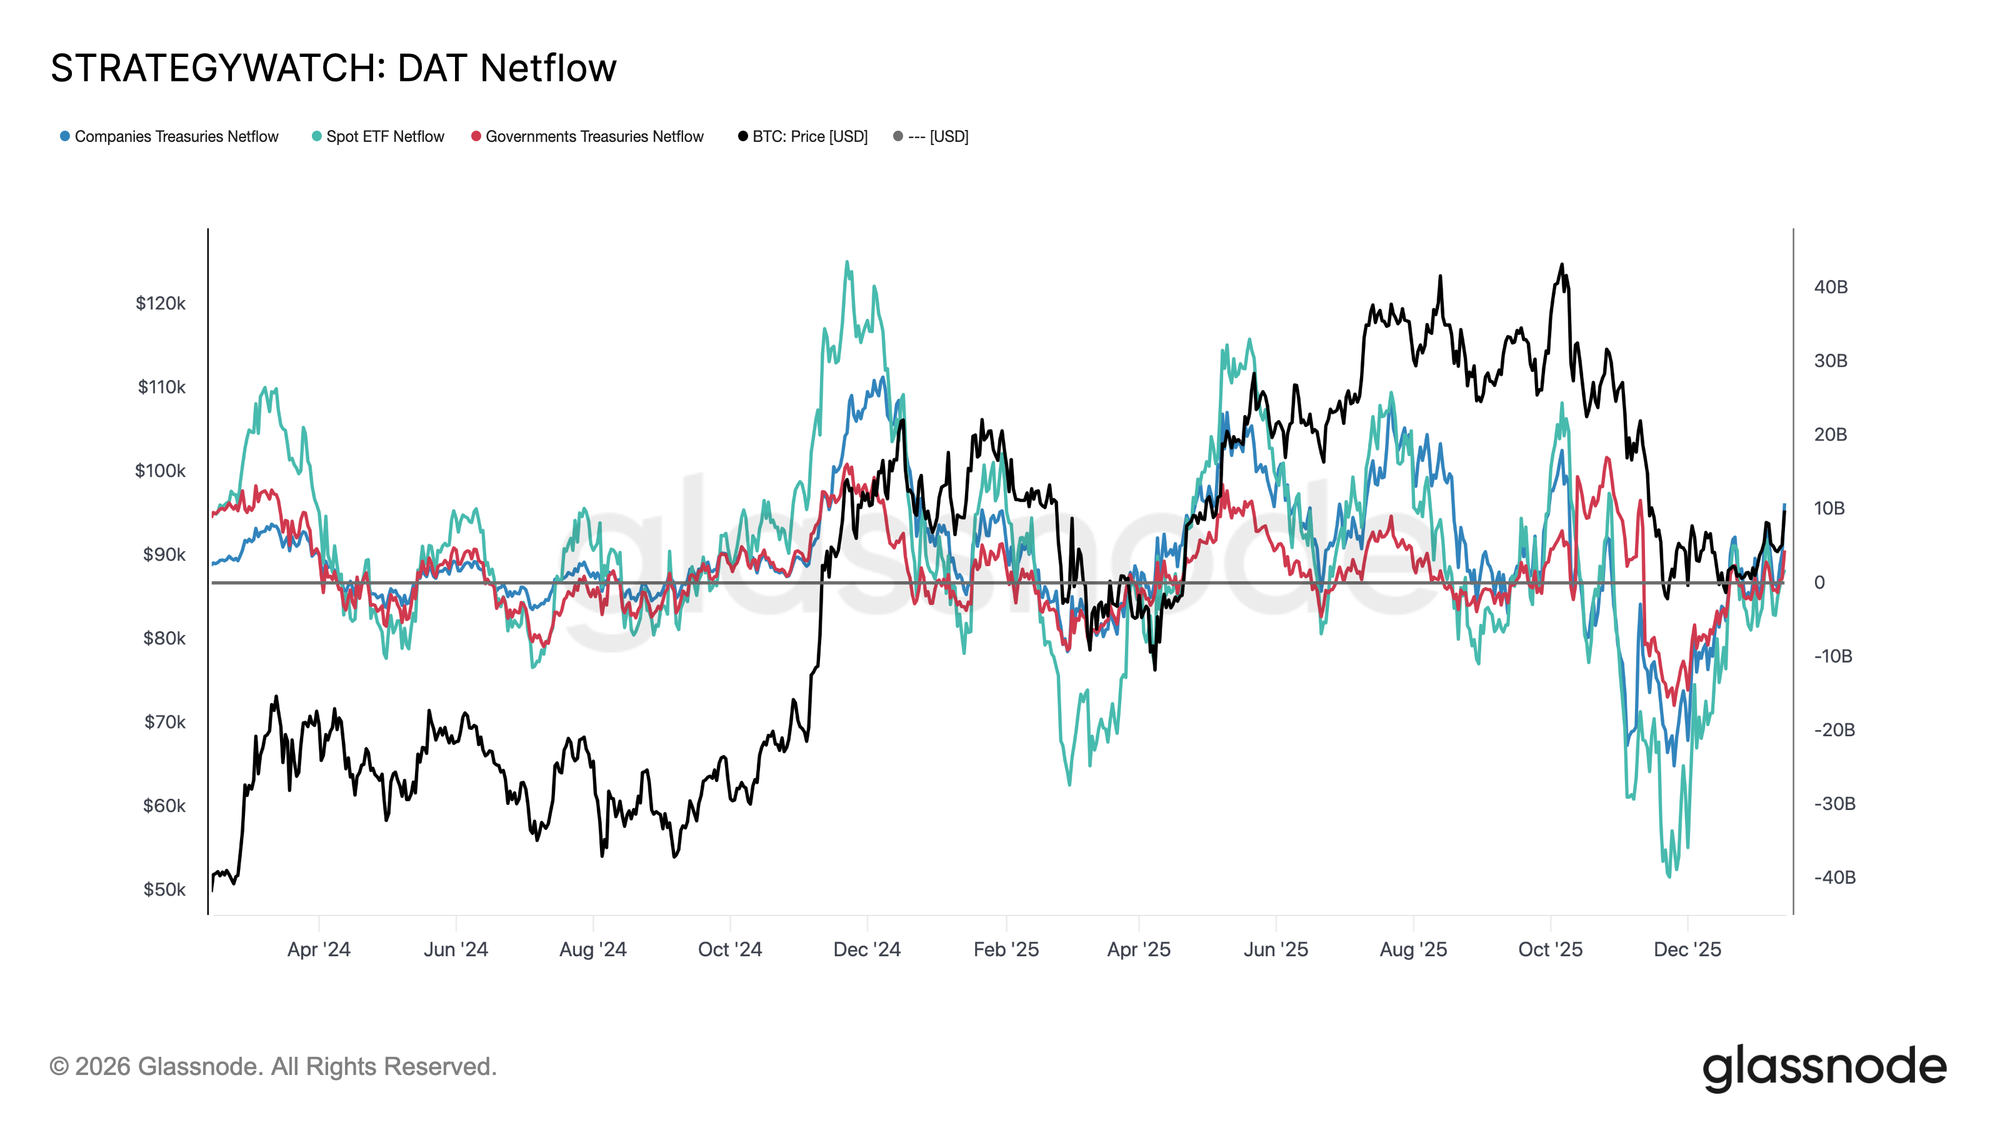
Institutional Flow Resets

Institutional balance-sheet flows have gone through a full reset over the past few months. After a prolonged period of heavy outflows across spot ETFs, corporates, and sovereign entities, netflows have now stabilised, marking a clear exhaustion of sell-side pressure from long-term structural holders.

Spot ETFs have been the first to turn, moving back into positive territory and re-establishing themselves as the primary marginal buyer. Since their inception, Spot ETFs have played a major role in every expansion phase, and their renewed inflows suggest that real-money allocators are once again beginning to rebuild exposure rather than simply trading volatility.

Corporate and sovereign treasury flows have also flattened out, with inflows appearing sporadically around consolidation phases. However, accumulation remains uneven and event-driven rather than consistent.

In this environment, balance-sheet demand is acting more as a price stabiliser than a growth engine, leaving near-term direction increasingly sensitive to derivatives positioning and short-term liquidity conditions.
Live Chart

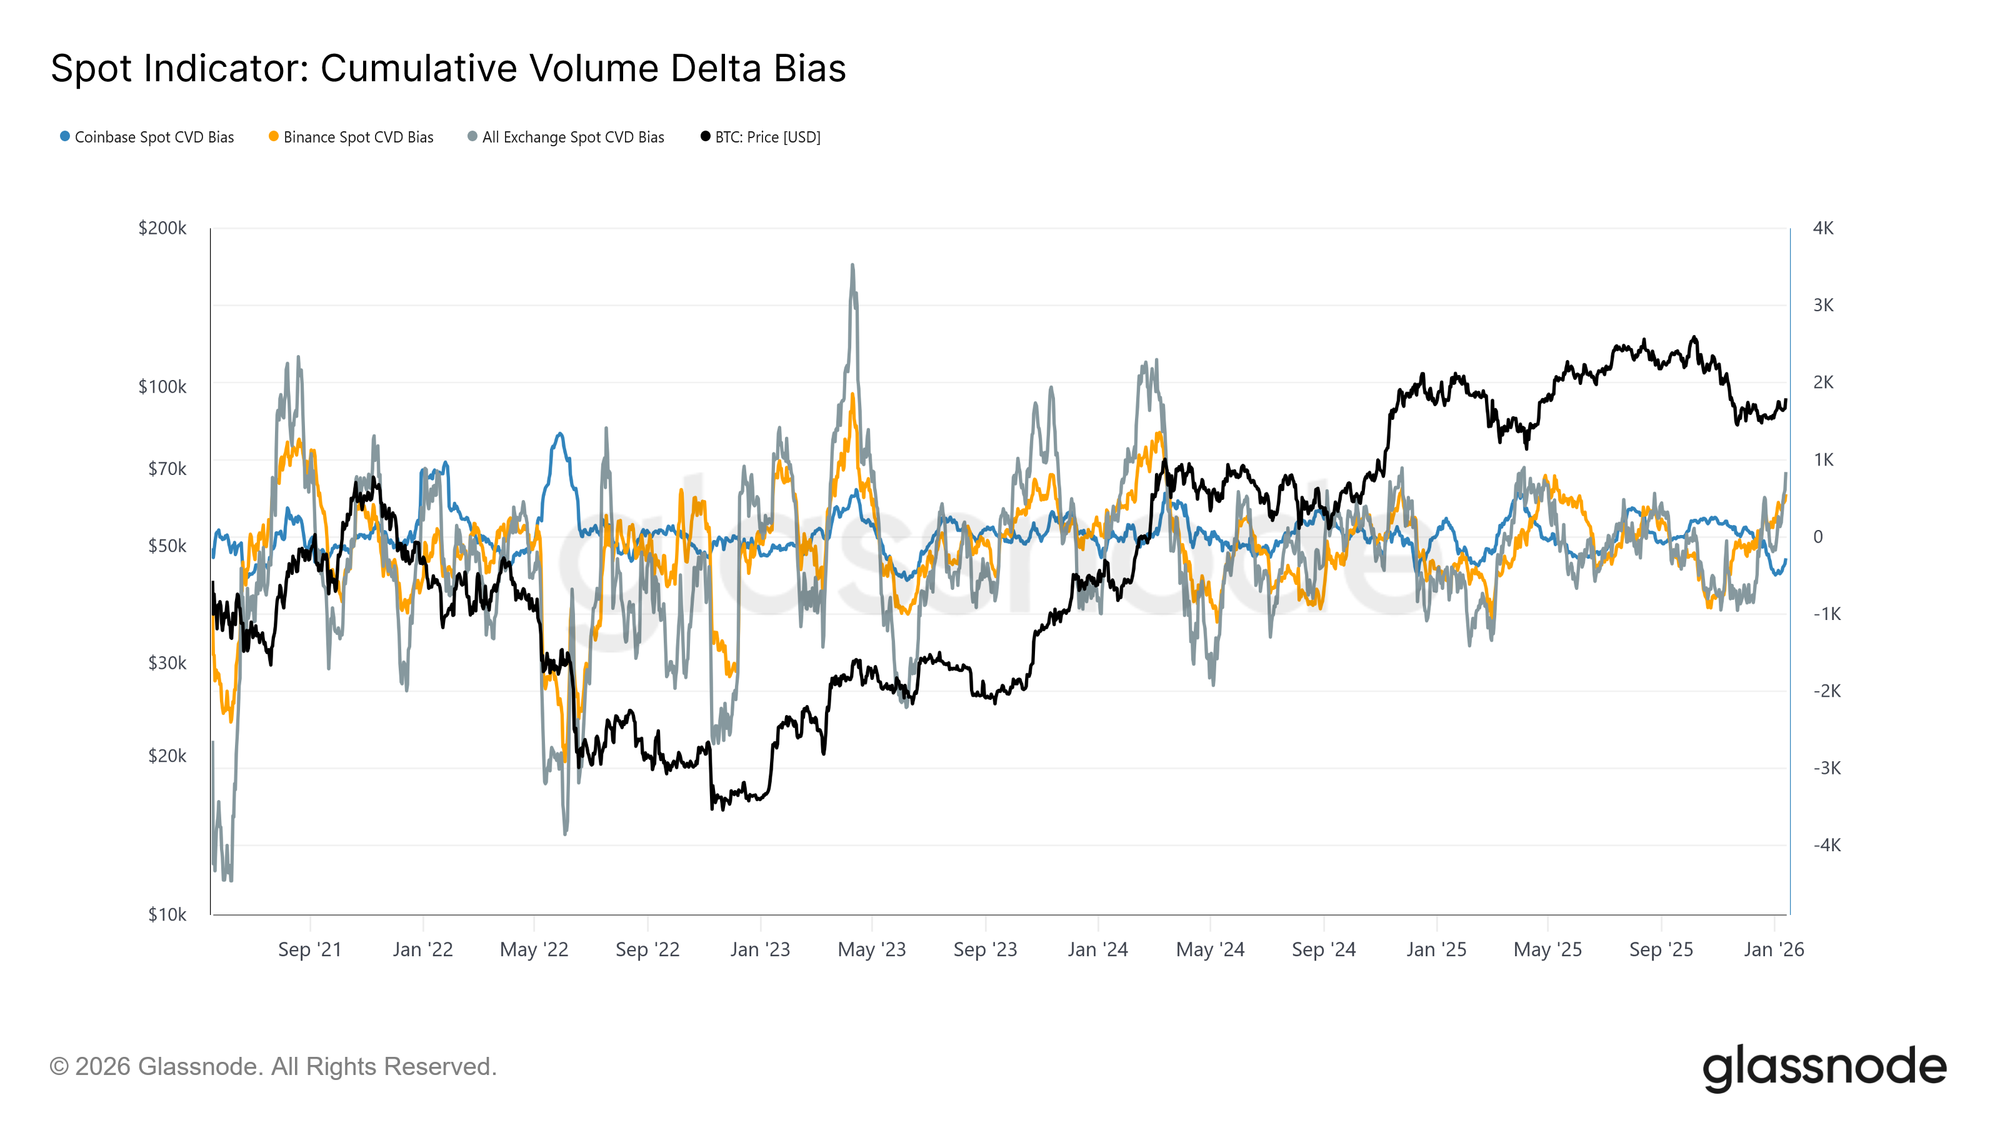
Spot Flows Turn Constructive

Spot market behaviour has begun to improve following the recent drawdown, with Binance and aggregate exchange CVD measures transitioning back into a buy-dominant regime. This reflects a shift away from persistent sell-side pressure and signals that market participants are once again absorbing supply rather than distributing into strength.

At the same time, Coinbase, which has been the most consistent source of sell-side aggression throughout the consolidation, has meaningfully slowed its selling activity. The easing of Coinbase-led distribution has removed a key source of overhead supply, helping to stabilise price and clear the way for the ongoing rally.

While spot participation is not yet displaying the persistent, aggressive accumulation typically seen during full trend expansion phases, the transition back into a net-buying posture across major venues represents a constructive structural shift.
Live Chart

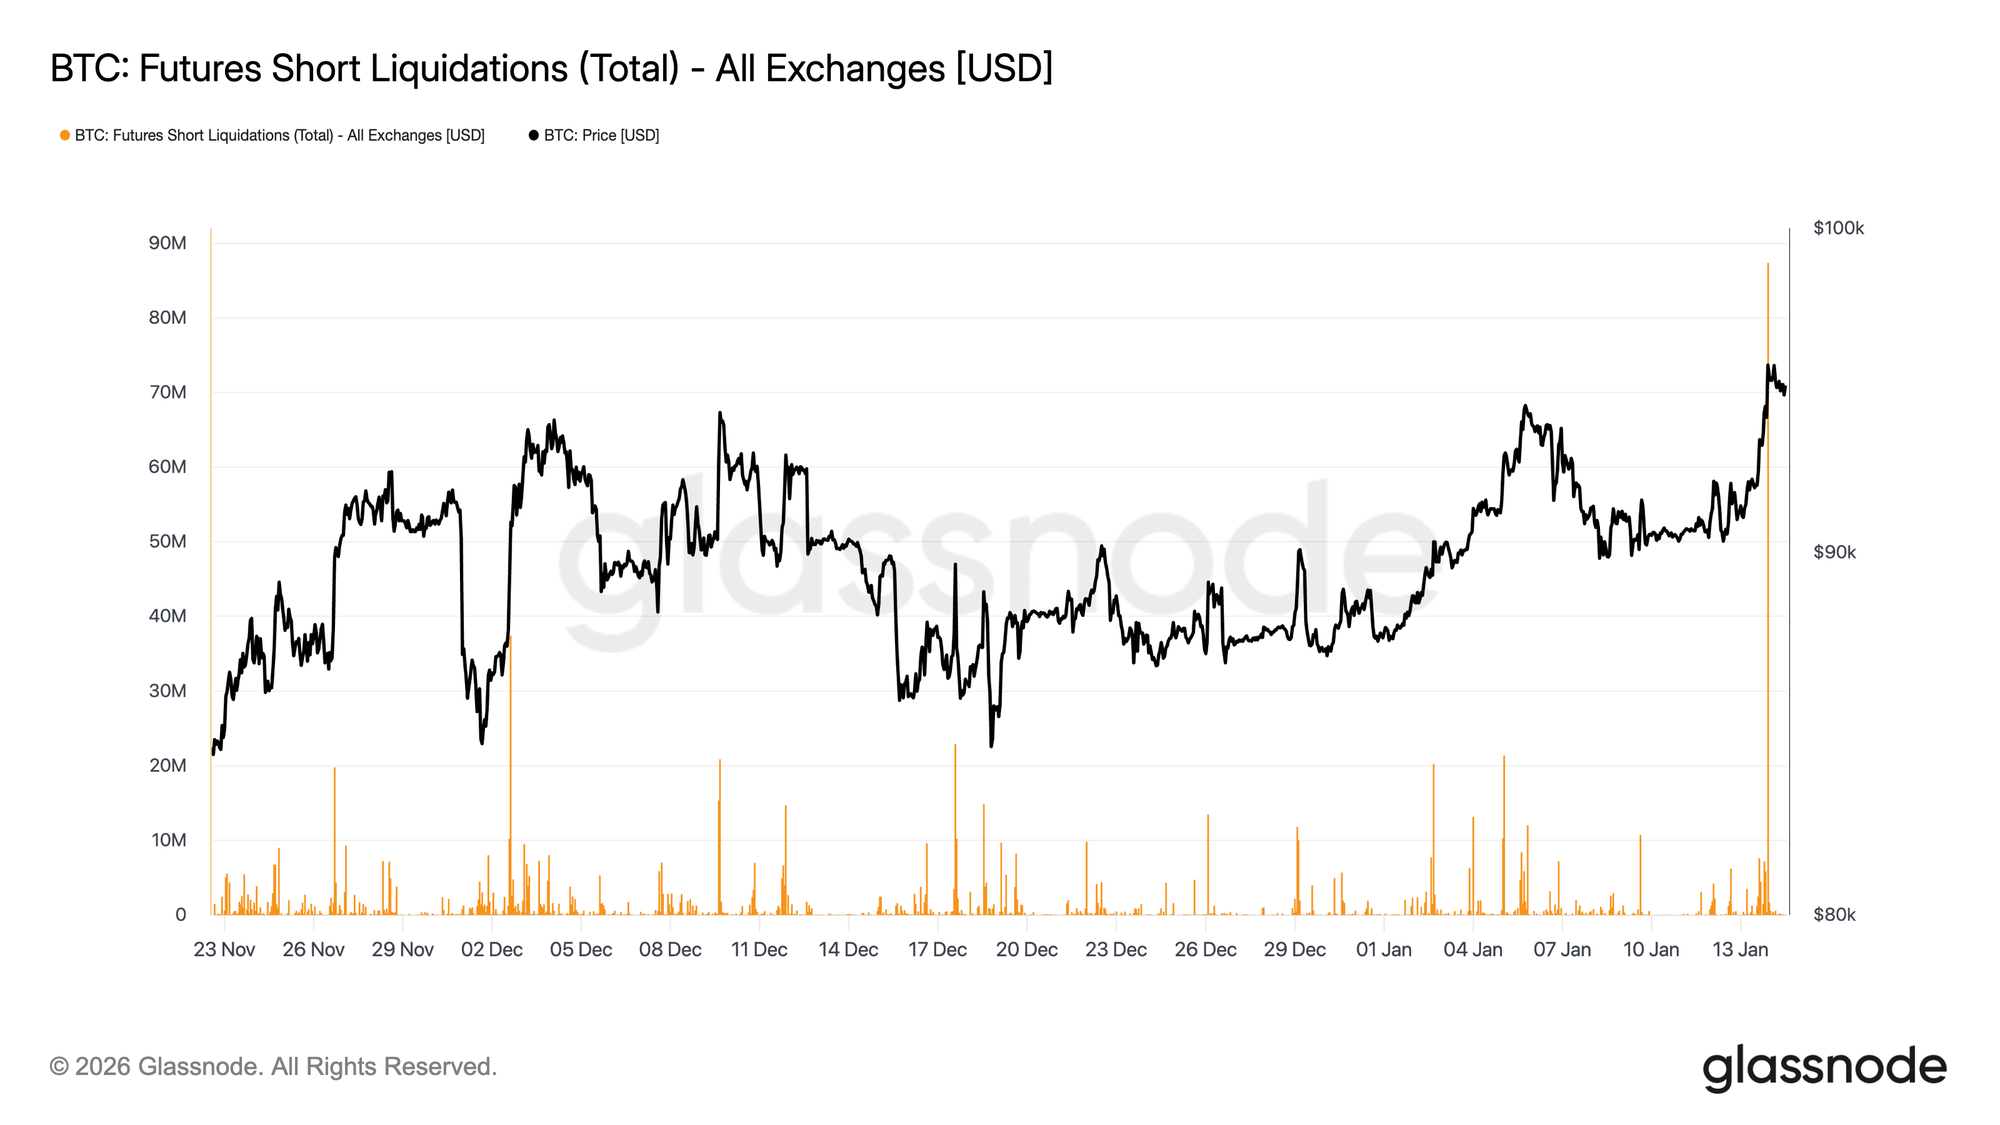
Futures Traders Squeeze Shorts

While the push into the $96K region was mechanically reinforced by short liquidations, it also unfolded on relatively thin derivatives volume. Futures turnover has remained well below the elevated activity seen throughout most of 2025, even as prices reclaimed higher levels.

This indicates that the breakout occurred in a comparatively light liquidity environment, where modest positioning shifts were able to drive disproportionately large price responses. In practical terms, it did not take significant new capital to force shorts out of the market and lift price through resistance.

This leaves the market reliant on whether spot demand and sustained volume can now step in to support continuation, or whether the rally risks fading once the mechanical buying pressure from forced covering is exhausted.
Live Chart

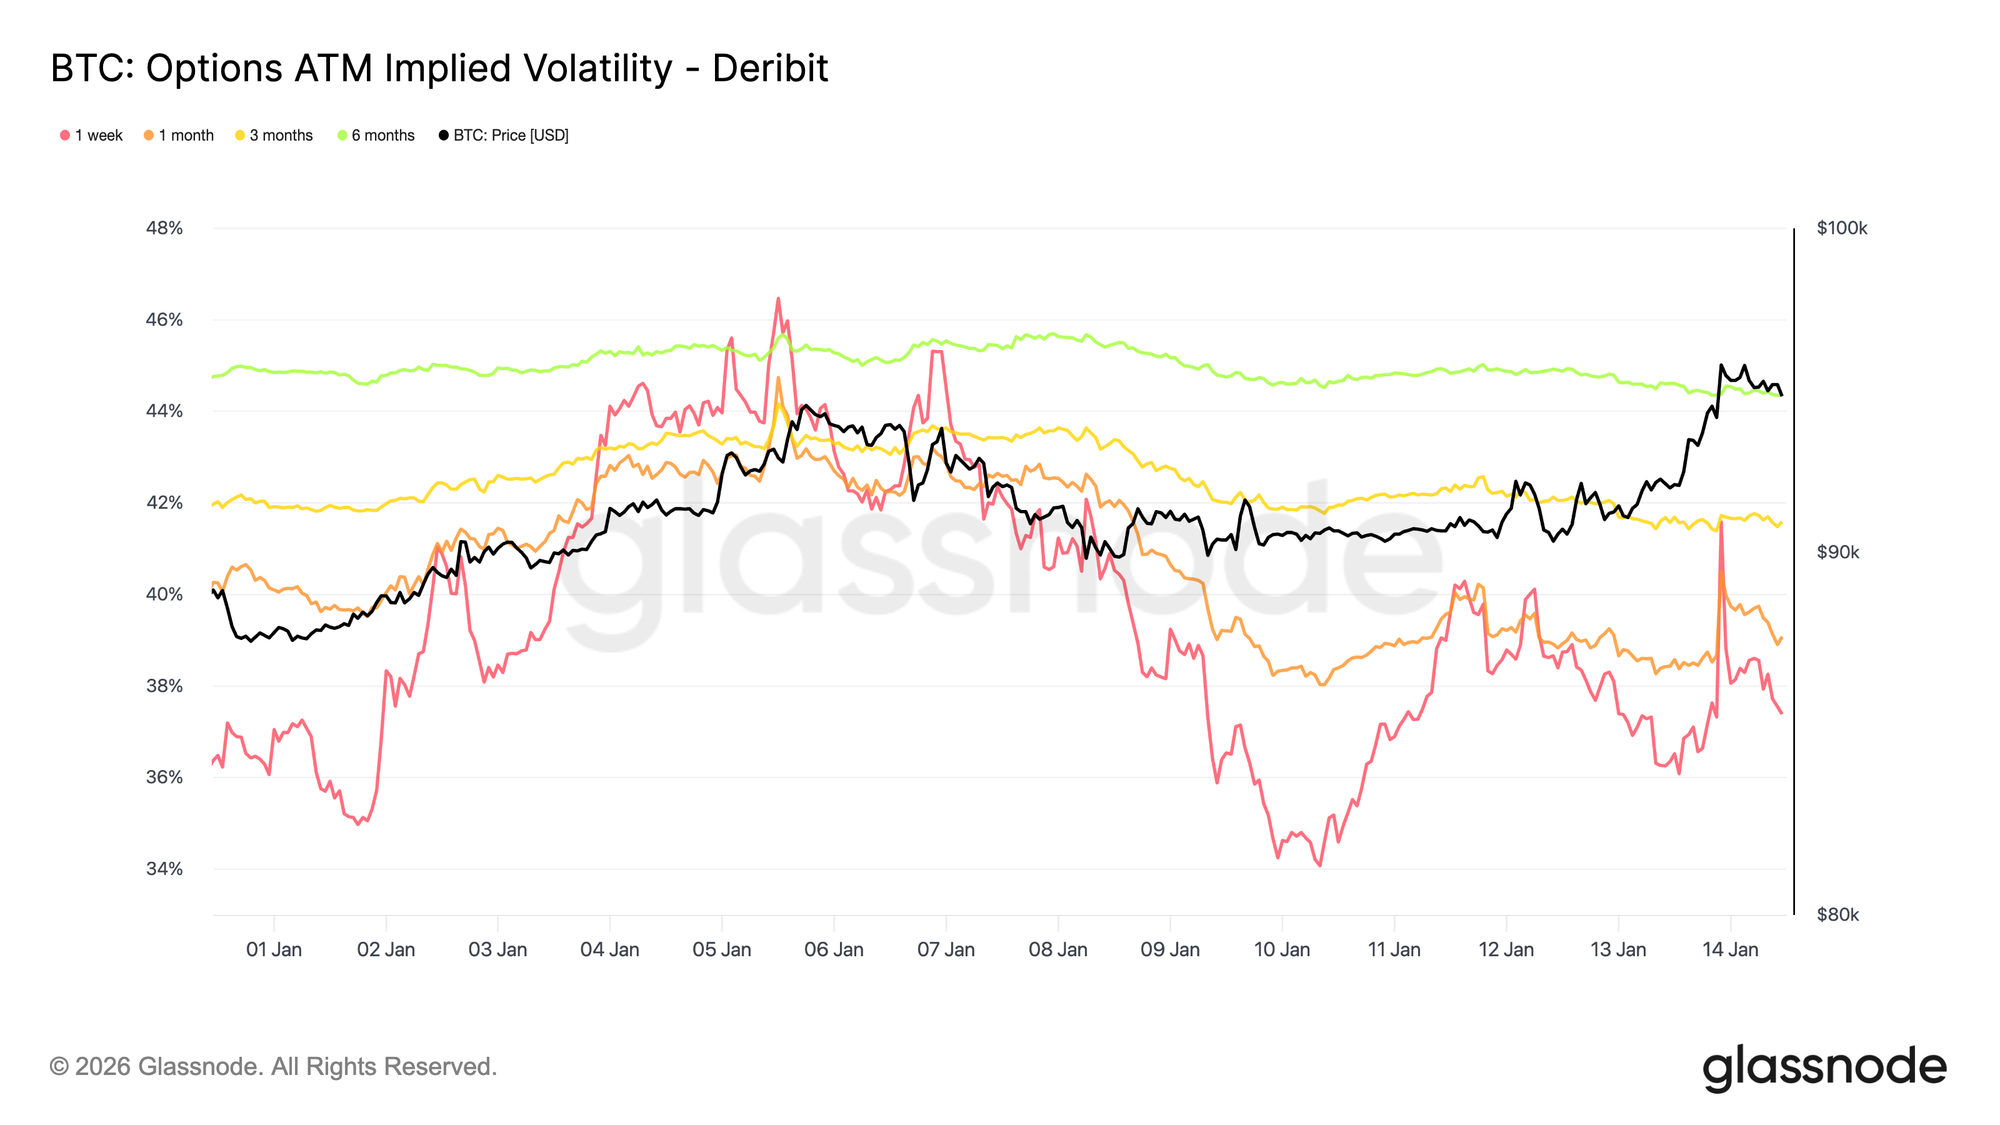
Low Volatility, Unresolved Risk

Implied volatility remains low across the curve, reinforcing the calm observed in recent price action. Longer-dated maturities have been drifting modestly lower, while short-dated implied volatility reacts more directly to spot moves. Those front-end reactions, however, fail to propagate up the curve, indicating limited demand for near-term convexity.

This is not a signal that uncertainty has disappeared. Rather, it suggests that risk is being deferred. The options market is not expressing confidence, but a view that any meaningful repricing is more likely to occur later than immediately.

Volatility increases gradually with maturity, pointing to uncertainty being assigned to time rather than to a specific near-term catalyst. The term structure is adjusting in level, not shape, consistent with a market that expects short-term stability while remaining exposed to latent risk.

This matters because volatility suppressed by positioning rather than clarity tends to reprice abruptly when conditions change.
Live Chart

Downside Asymmetry Remains Firmly Priced

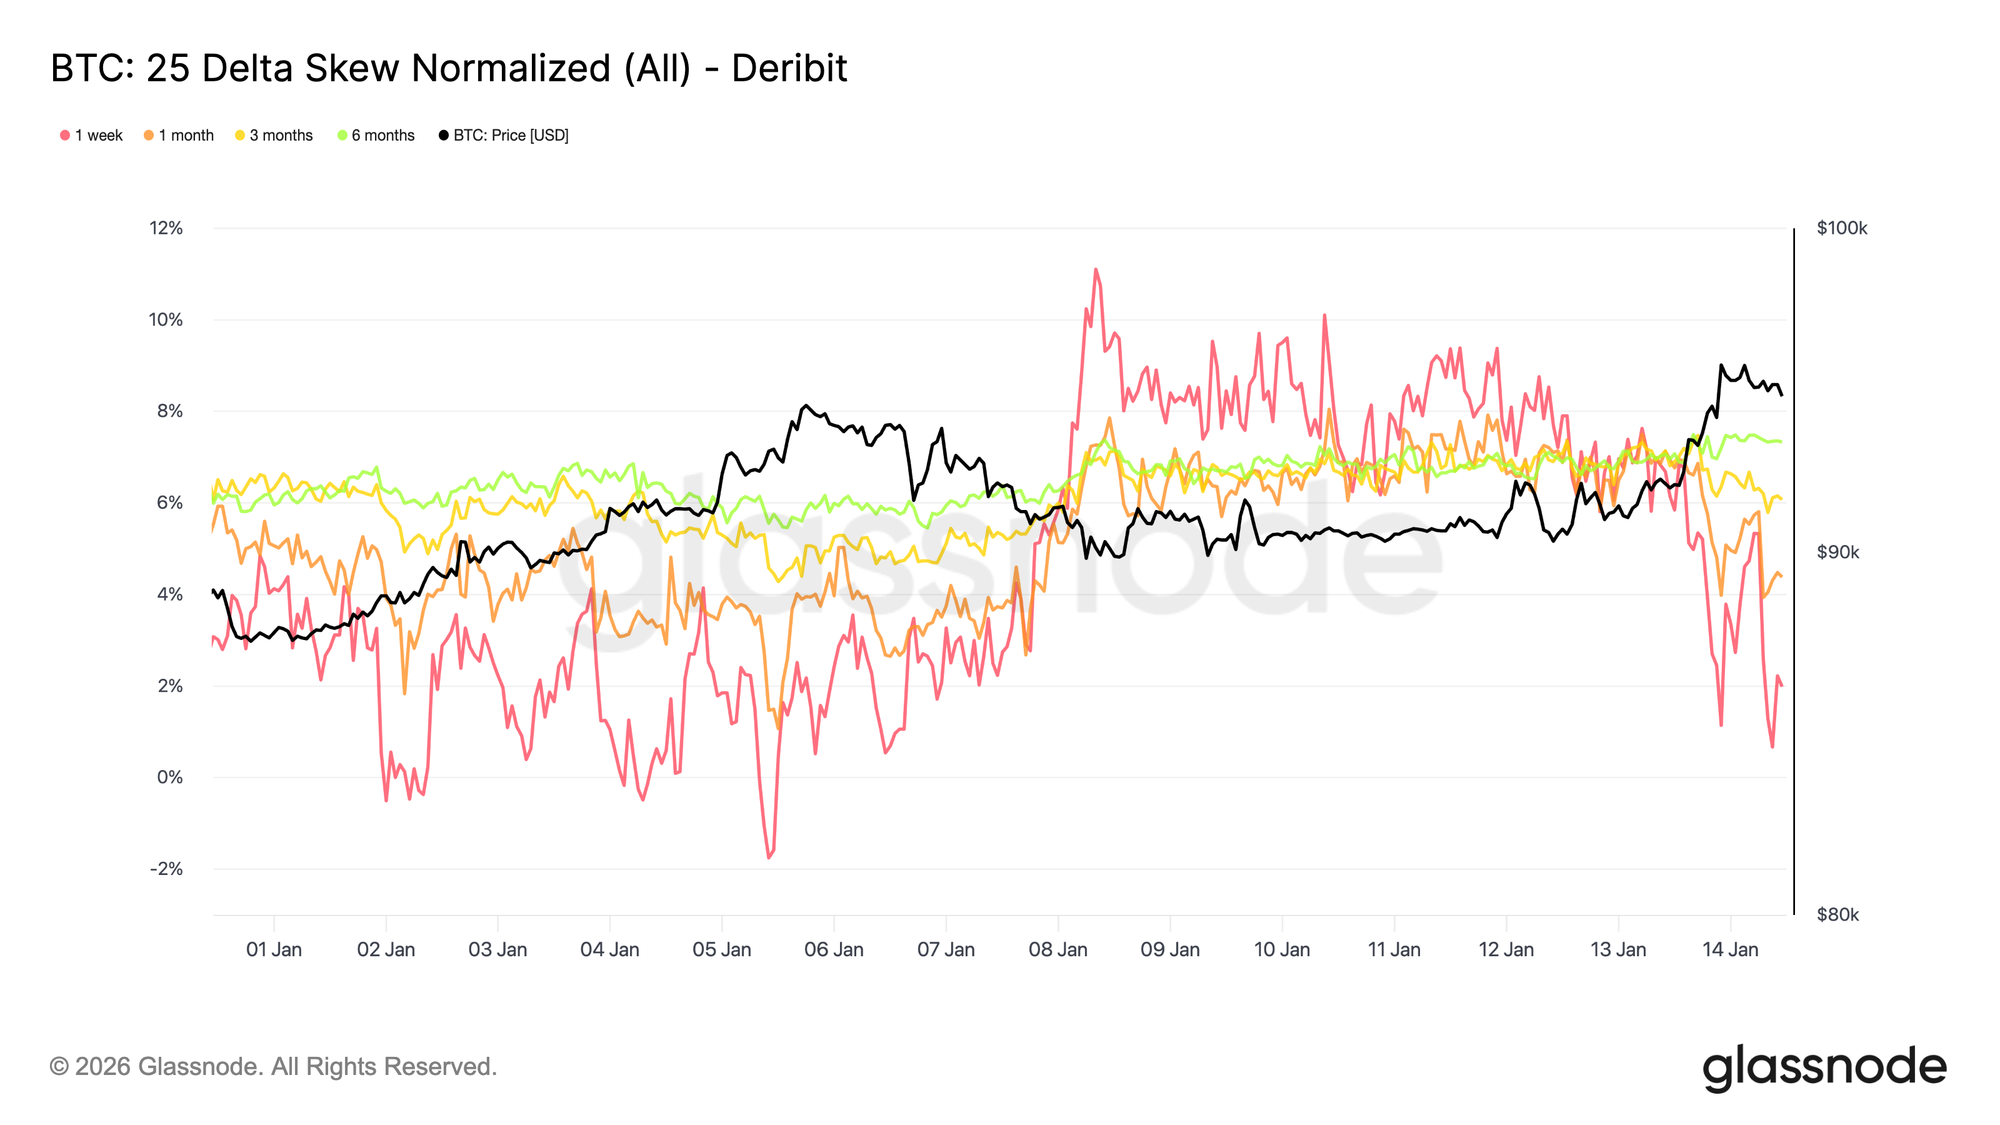
While overall volatility remains low, skew continues to price downside risk. The 25 delta skew stays biased toward puts, particularly in mid and longer maturities, pointing to persistent demand for longer-dated downside protection even as spot stabilizes and reclaims the 95K level.

This reflects a market that is comfortable carrying exposure but unwilling to do so without insurance. Protection is being maintained rather than aggressively added, signaling caution rather than stress. Short-dated skew briefly moved toward balance before rotating back in favor of puts, while longer-dated skew has shown little reaction to the move back above 95K.

The coexistence of low volatility and negative skew highlights a key tension. Participants are not positioning for immediate downside, but they continue to pay for asymmetric protection.

That combination is typical of range-bound markets where risks are acknowledged but not expected to materialize immediately.
Short Gamma and Fragile Stability

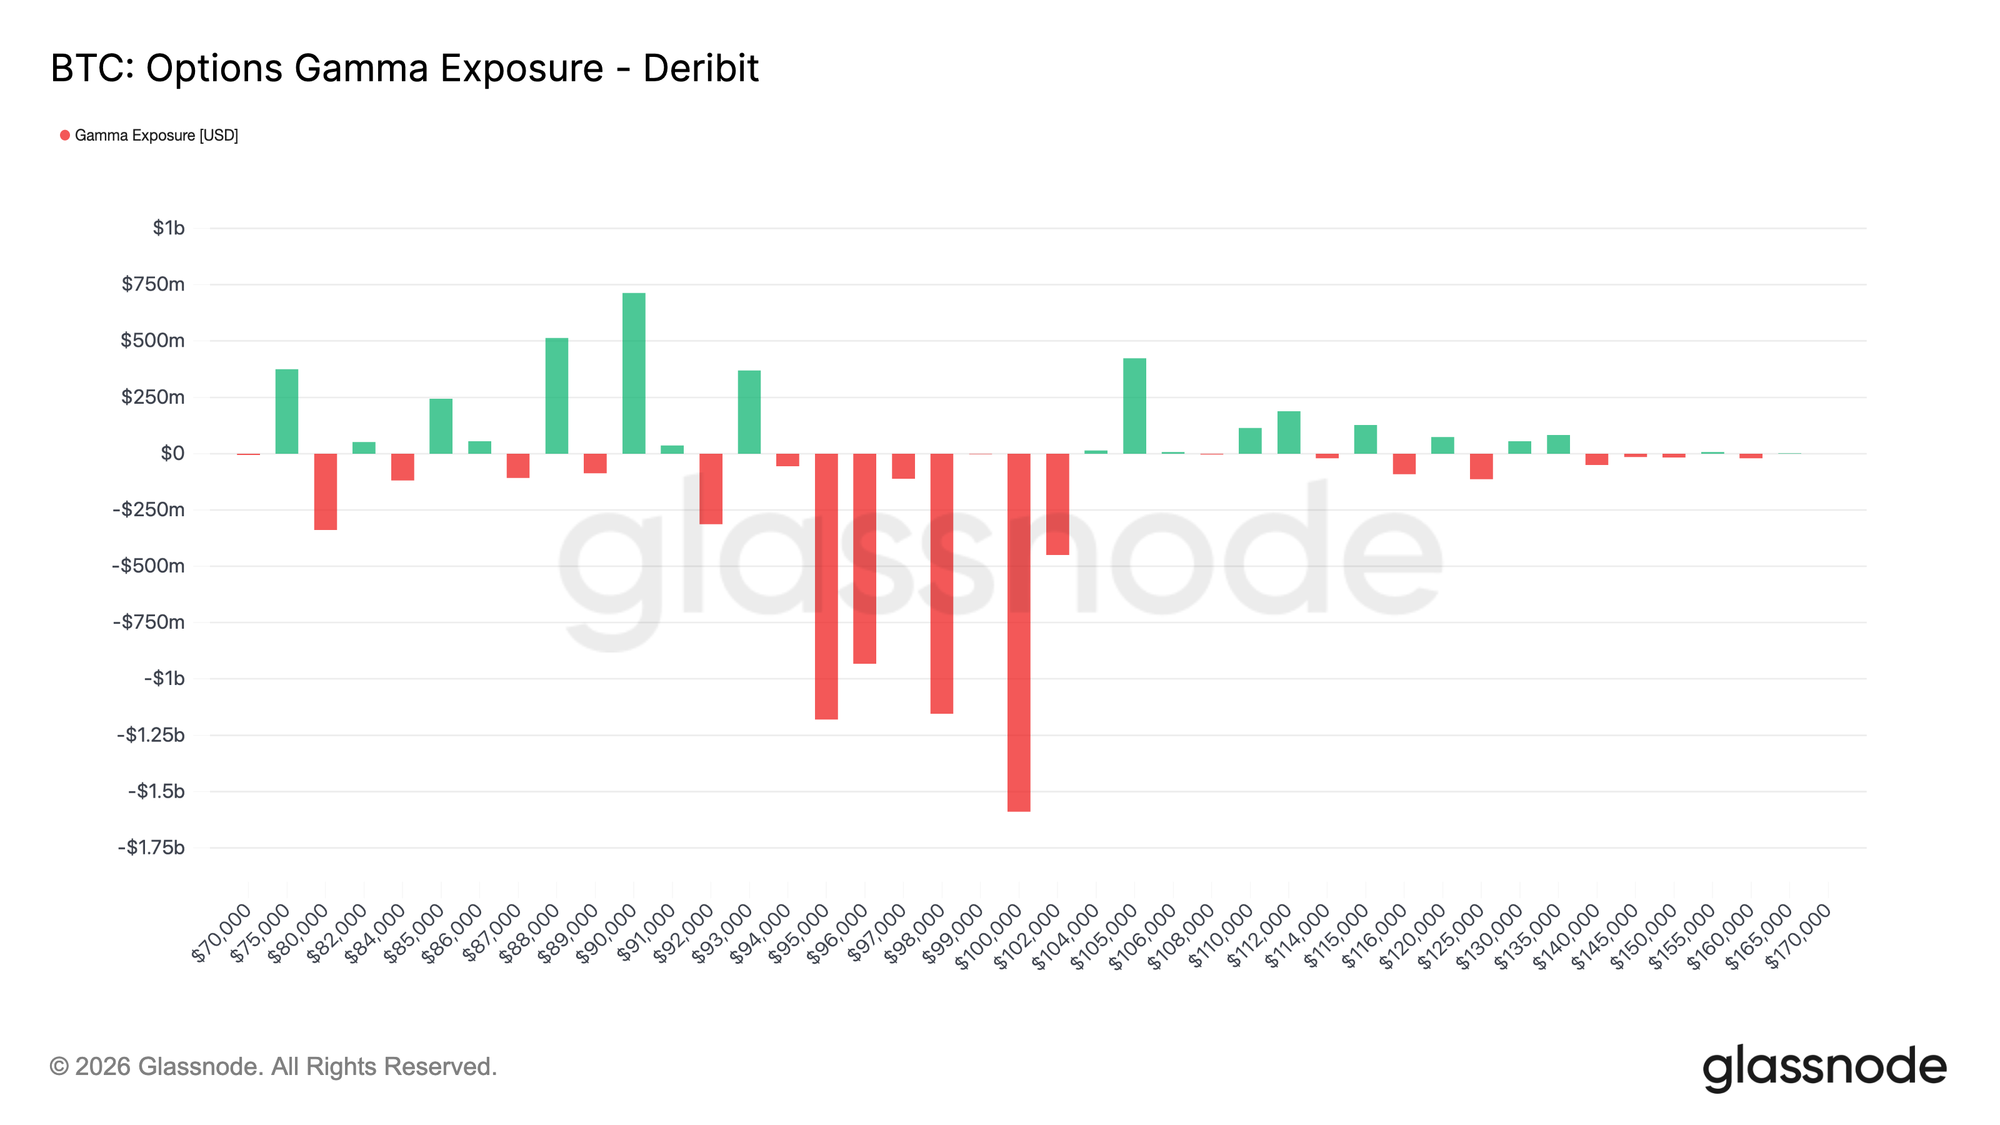
The current strike distribution places dealers short gamma around spot, altering the market’s short-term dynamics. In a short gamma environment, hedging flows no longer absorb price moves. Instead, they tend to reinforce them, with dealers buying into rising prices and selling into declines.

With spot trading around the 95–96K area at the time of writing, price has moved into a short gamma zone that extends roughly from 94K to 104K. Within this range, sustained price action supported by volume is more likely to trigger directional hedging flows, increasing the potential for faster movement toward nearby high-interest strikes, including the 100K level.

This structure creates a fragile form of stability. Volatility can remain low while price is contained, but once momentum develops, moves are more likely to accelerate than fade. In this context, calm price behavior reflects positioning rather than balance, leaving the market more exposed to abrupt repricing than gradual adjustment.
Live Chart

DVOL Confirms Volatility Is Being Deferred

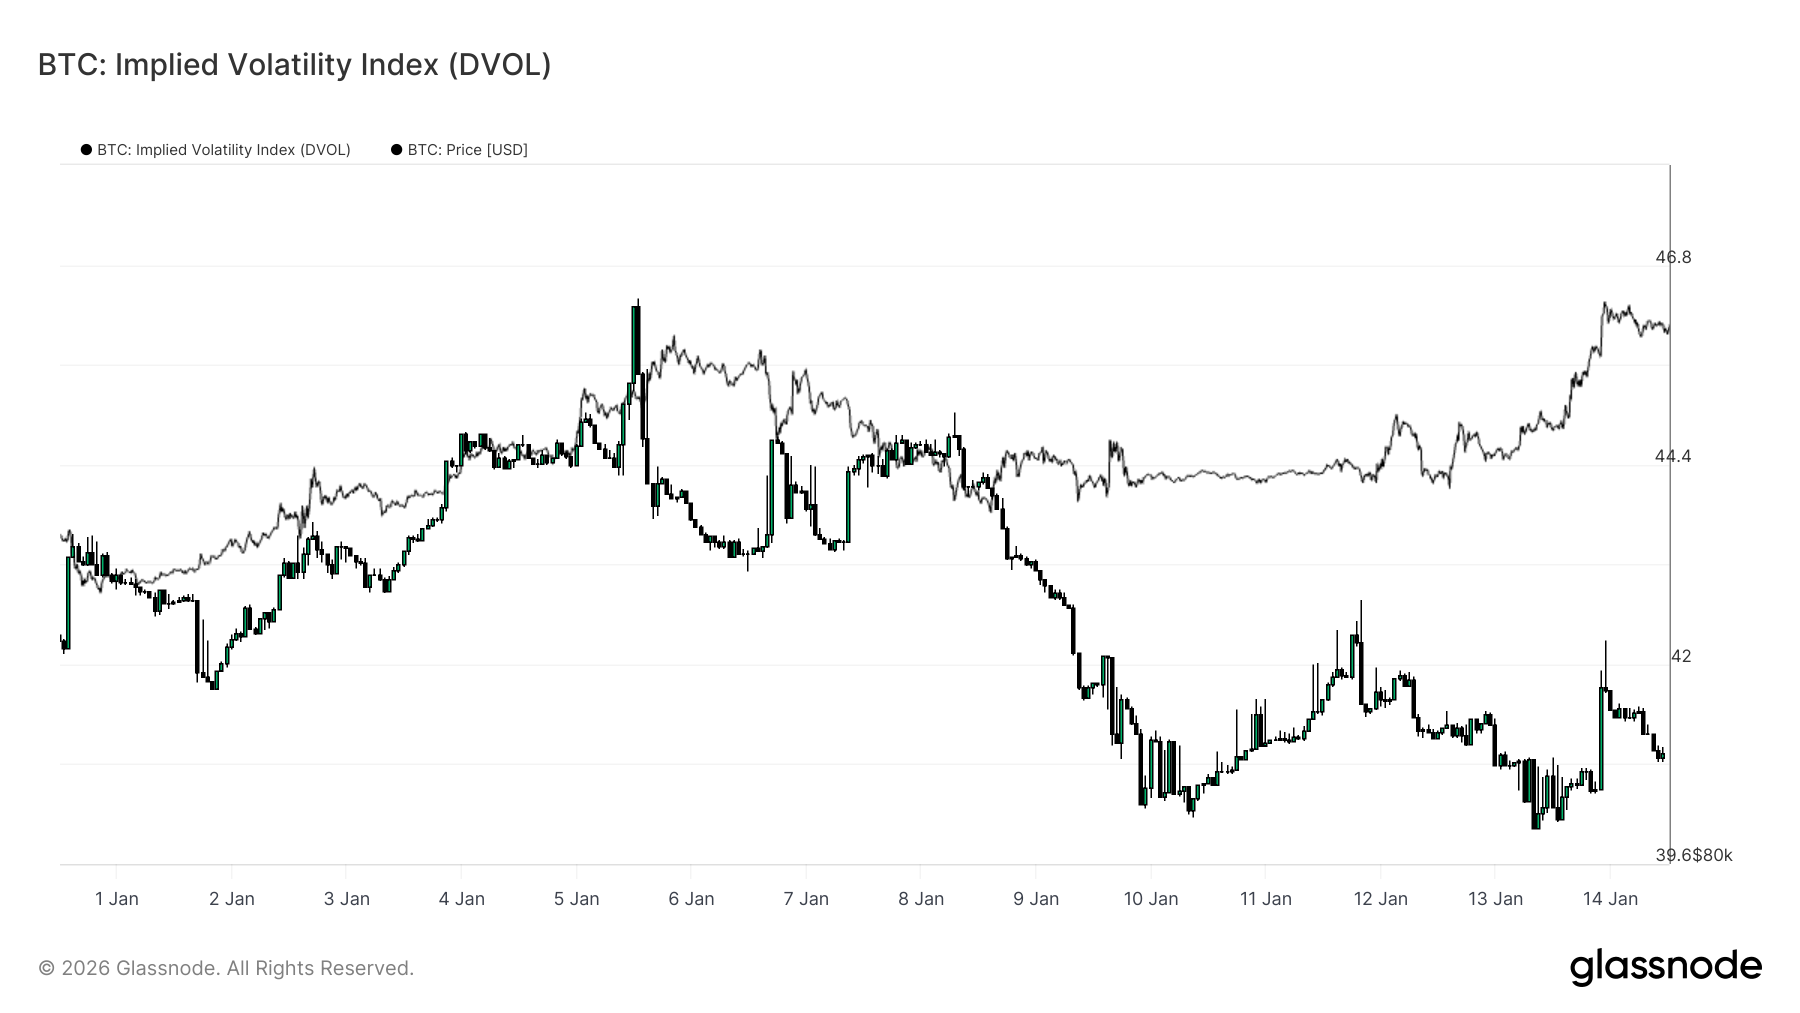
The Implied Volatility Index (DVOL) provides a surface-wide view of option-implied uncertainty by aggregating volatility across strikes and maturities. Unlike at-the-money implied volatility, which reflects pricing at a specific point on the curve, DVOL captures how much volatility the market is embedding overall.

At present, DVOL remains relatively low and range-bound, even as spot has moved through key levels. This confirms what the term structure and skew already suggest: the options market is not paying up for immediate volatility. Uncertainty is acknowledged, but it is not being expressed through higher aggregate volatility pricing.

Importantly, this low DVOL reading coincides with downside-biased skew and short gamma positioning near spot. Volatility is therefore not being compressed by stabilizing hedging flows, but simply deferred at the surface level. This combination creates conditions where volatility can remain dormant, yet reprice sharply once a catalyst forces positioning to adjust.
Live Chart

Call Premium Signals Conditional Upside

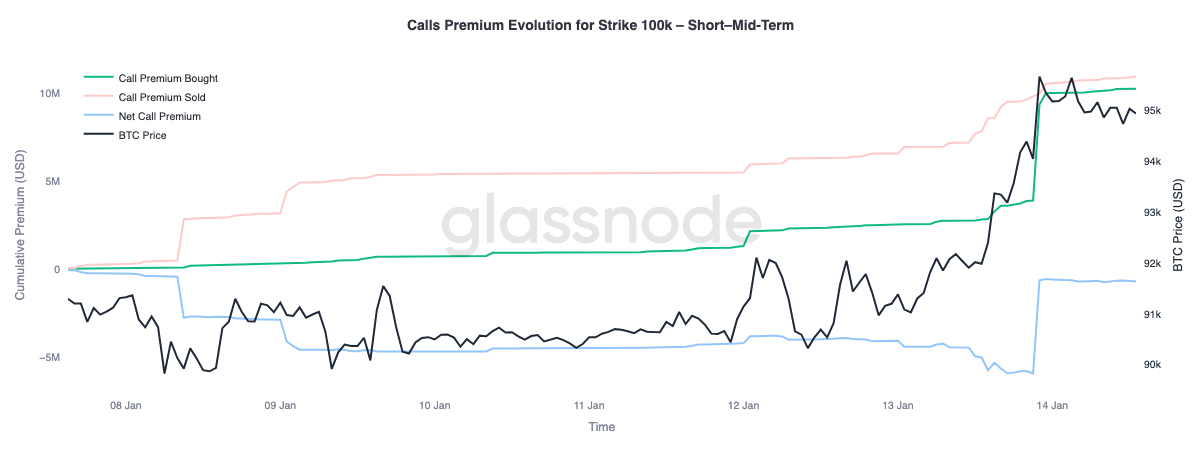
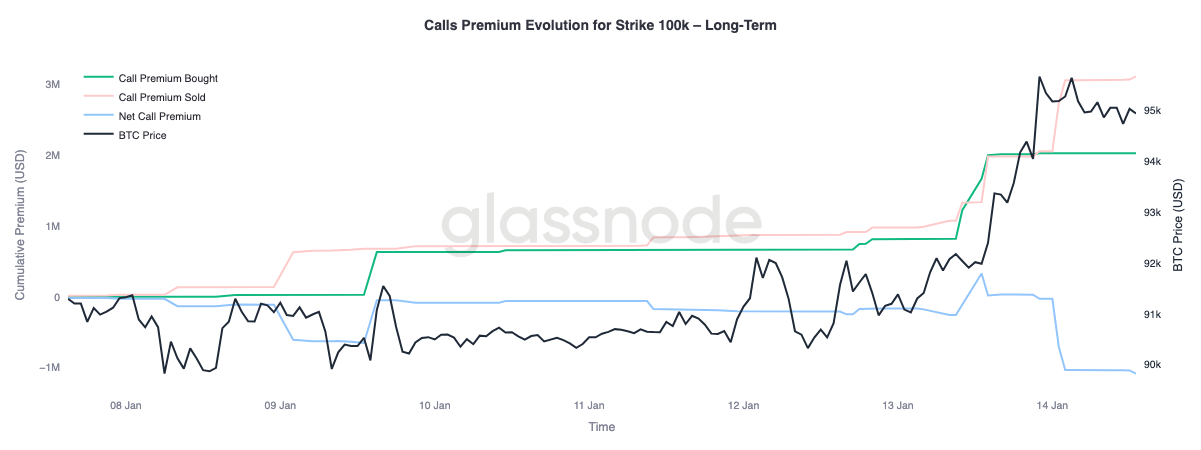
A closer look at the premium behavior of the 100K call strike highlights a clear divergence across maturities. This level remains the next major psychological threshold, and option flows show how the market is positioning around it.

In short to mid-term maturities, up to roughly three months, call premium bought has significantly outweighed call premium sold. This imbalance has driven net call premium higher, indicating active demand for near-dated upside exposure as spot approaches the level. In contrast, longer-dated maturities show the opposite behavior. As spot rallied, richer call premiums further out the curve were used as opportunities to sell upside.

This split suggests the market is positioning for a potential retest of the 100K area, while simultaneously expressing hesitation about sustained acceptance above that level over longer horizons. Upside is being targeted tactically in the near term, but monetized at longer maturities.
Conclusion

Bitcoin has entered a transitional phase marked by stabilising structural flows, improving spot behaviour, and a derivatives complex still shaped by deferred volatility risk. Long-term holder distribution has slowed, institutional balance-sheet flows have stabilised, and spot markets have begun to shift back into buy-dominant regimes, suggesting that much of the late-2025 sell-side pressure has now been absorbed.

However, the recent move into the $96K region was driven more by mechanical positioning dynamics than broad-based organic demand. Futures liquidity remains thin, and spot participation, while improving, has yet to show the persistent accumulation typically seen during full trend expansion.

Looking ahead to Q1, the underlying setup appears increasingly constructive. With sell pressure easing and volatility risk deferred rather than discharged, relatively modest inflows may once again generate outsized price responses. If spot accumulation and ETF-led institutional demand continue to rebuild, the current consolidation phase may serve as a base for renewed trend expansion.


Trending Cryptos

Related Questions

QWhat is the key supply zone that Bitcoin's price has entered, and why is it significant?

ABitcoin's price has entered a historically significant supply zone between approximately $93k and $110k, where a dense cluster of Long-Term Holder supply was accumulated between April and July 2025. This region has consistently acted as a transition barrier, stalling rebounds and preventing a structural recovery due to renewed sell-side pressure.

QWhat does the Short-Term Holder cost basis represent, and why is it critical for market confidence?

AThe Short-Term Holder cost basis, currently at $98.3k, represents the aggregate entry price of recent investors. It serves as a critical gauge of market confidence because sustained trading above this level indicates new demand is absorbing overhead supply, allowing recent buyers to remain profitable. Historically, reclaiming and holding above this level marks the transition from corrective phases into durable uptrends.

QHow has Long-Term Holder distribution behavior changed, and what is required for a sustainable rally?

ALong-Term Holder distribution has slowed materially compared to the aggressive selling in Q3 and Q4 2025, though they remain net sellers. For a sustainable rally to emerge, the market must transition into a regime where maturation supply (coins maturing beyond ~155 days) outpaces long-term holder spending, which would push LTH supply higher—a structure observed in periods preceding stronger trend recoveries.

QWhat role do institutional balance-sheet flows play in the current market environment?

AInstitutional balance-sheet flows have stabilized after a period of heavy outflows, with spot ETFs turning positive and acting as the primary marginal buyer. However, this demand is currently acting more as a price stabilizer than a growth engine, making near-term direction increasingly sensitive to derivatives positioning and short-term liquidity conditions.

QHow does the current derivatives market structure, particularly short gamma and low volatility, impact price stability?

AThe derivatives market is characterized by short gamma positioning near spot (approx. 94k–104k range) and low implied volatility, which defers risk rather than eliminates it. This creates fragile stability: while volatility remains low in calm conditions, hedging flows can reinforce price moves once momentum develops, leading to abrupt repricing rather than gradual adjustments.

Related Reads

Only 153 Venture Capital Firms Invested in July: Is the Crypto VC Industry Experiencing a 'Mass Extinction'?

In July 2026, only 153 unique venture capital firms participated in disclosed crypto funding rounds, marking the lowest monthly count since November 2020. This figure represents an 87% decline from the peak of 1,177 firms in 2022. Overall, the first seven months of 2026 saw crypto projects raise approximately $11.78 billion across 481 rounds. This crypto VC contraction contrasts sharply with the broader venture capital landscape, where global VC investment reached a record $560.4 billion in H1 2026, heavily fueled by major AI company financings. This shift in capital allocation has drawn funds away from the crypto sector. Within crypto, funding is highly concentrated. Trading platforms, prediction markets, and payment sectors absorbed 53% of the total capital. While early-stage deals remain frequent, the largest sums flow to a few late-stage rounds and mergers & acquisitions, which surged to $7.23 billion in Q2 2026. The market is consolidating around top funds like a16z crypto and Dragonfly, which successfully raised new multi-billion dollar funds, while many smaller firms have retreated. Analysts describe this as a "great extinction" for crypto VCs, where capital is becoming more selective, favoring proven business models and assets over early-stage speculation. This raises the bar for project quality, funding efficiency, and viable exit paths.

marsbit18m ago

Only 153 Venture Capital Firms Invested in July: Is the Crypto VC Industry Experiencing a 'Mass Extinction'?

marsbit18m ago

Strategy's Loss in the Second Quarter Reaches $8.22 Billion Amid Bitcoin Decline

Strategy, the largest corporate holder of Bitcoin, reported a net loss of $8.22 billion for the second quarter. This loss was primarily driven by an $8.32 billion unrealized loss on its Bitcoin holdings due to a decline in the asset's price during the period. Despite these paper losses, the company increased its Bitcoin holdings to 843,775 BTC, a 25% growth since the start of the year. As part of a new monetization strategy, Strategy sold approximately $218.4 million worth of Bitcoin, mainly to fund dividends for preferred shareholders, with $216 million of that sold after Q2 ended. The company also built a $3.75 billion cash reserve, which it claims is sufficient to cover over two years of dividend and interest payments, aiming to insulate itself from Bitcoin's volatility while meeting obligations. Following the earnings release, Strategy's stock (MSTR) rose 4.7% in regular trading but corrected slightly after-hours. This pattern reflects how the company's accounting results are heavily tied to Bitcoin's price swings, even as its long-term strategy remains unchanged. The report indicates that Strategy is maintaining its core strategy of accumulating Bitcoin while building a financial buffer. This quarterly loss follows a recognizable pattern, with the company posting significant unrealized losses in previous quarters (e.g., $12.4 billion in Q4 2025 and ~$12.5 billion in Q1 2026) due to fair-value accounting. A key technical shift is its new monetization program, which introduces periodic selling pressure on the market, transitioning Strategy from a pure accumulator to a participant that occasionally adds supply. A critical question remains: how long can the cash reserve cover dividend obligations if a Bitcoin price downturn persists beyond two years?

cryptonews.ru38m ago

Strategy's Loss in the Second Quarter Reaches $8.22 Billion Amid Bitcoin Decline

cryptonews.ru38m ago

Will Terrorist Durov Ban Russian Officials?

Telegram founder Pavel Durov publicly reacted to being labeled a "terrorist" by Russian authorities, stating the designation came after he refused demands for mass surveillance and censorship on the platform. In a Telegram post, he highlighted that this status formally bans him from "publishing information online." Durov concluded with a statement widely circulated: Russian officials "clearly don't understand who can ban whom on the internet." This remark suggests Durov could potentially restrict official Russian government and officials' channels on Telegram, which continue to operate on the platform despite its formal blocking in Russia. The situation parallels previous, slow-moving state directives, like switching officials to domestic cars, contrasted with the current push to migrate all government communication to the Russian-made messenger MAX by 2030. However, reports indicate many officials still use Telegram via workarounds, fearing surveillance on MAX, while alternatives like BiP and KakaoTalk recently became inaccessible in Russia without a VPN. Durov has not specified any immediate actions against state channels. His statement is an initial response, with further developments depending on the authorities' reaction. The dynamic differs from 2020 when Russian regulators lifted a block on Telegram; now, Durov implies control from within the platform itself over the official accounts that persisted through that earlier blockade.

cryptonews.ru38m ago

Will Terrorist Durov Ban Russian Officials?

cryptonews.ru38m ago

DeepSeek V4 Official Version Arrives, New Capabilities Emerge, Value-for-Money King Enters the Fray

On July 31st, DeepSeek officially launched the public API beta for its DeepSeek-V4-Flash model. A key highlight is its performance on multiple Agent benchmark tests, reportedly nearing or even surpassing the level of the V4-Pro preview version from three months ago. Notably, the Flash model achieves this with significantly smaller scale (130B active parameters vs. Pro's 490B), suggesting that post-training optimization and data quality may be as crucial as raw model size. DeepSeek emphasized that the V4-Flash-0731 uses the same model architecture and size as its preview version, with improvements attributed solely to "re-trained post-training." The update also marks the official debut of DeepSeek's self-developed Agent framework, "Harness." The move signals DeepSeek's strategic push to position its cost-effective Flash model as a competitive base for Agent applications—scenarios requiring autonomous planning, tool usage, and complex task execution—where inference speed and cost are critical. By natively supporting OpenAI's Responses API format and adapting for code-generation scenarios, DeepSeek aims not just to be a cheaper alternative but to establish its own ecosystem in the Agent era. This release follows DeepSeek's record-breaking ~$50 billion fundraising round roughly two months prior, underscoring market confidence in its technology and commercialization prospects. The company is reportedly preparing for another funding round at a valuation of approximately $71 billion. The Flash model's advancement represents a step in fulfilling the high expectations that come with this valuation, setting the stage for the impending release of the V4-Pro official version and intensifying competition in the global Agent landscape.

marsbit42m ago

DeepSeek V4 Official Version Arrives, New Capabilities Emerge, Value-for-Money King Enters the Fray

marsbit42m ago

Trading

Spot

Hot Articles

What is $BITCOIN

DIGITAL GOLD ($BITCOIN): A Comprehensive Analysis Introduction to DIGITAL GOLD ($BITCOIN) DIGITAL GOLD ($BITCOIN) is a blockchain-based project operating on the Solana network, which aims to combine the characteristics of traditional precious metals with the innovation of decentralized technologies. While it shares a name with Bitcoin, often referred to as “digital gold” due to its perception as a store of value, DIGITAL GOLD is a separate token designed to create a unique ecosystem within the Web3 landscape. Its goal is to position itself as a viable alternative digital asset, although specifics regarding its applications and functionalities are still developing. What is DIGITAL GOLD ($BITCOIN)? DIGITAL GOLD ($BITCOIN) is a cryptocurrency token explicitly designed for use on the Solana blockchain. In contrast to Bitcoin, which provides a widely recognized value storage role, this token appears to focus on broader applications and characteristics. Notable aspects include: Blockchain Infrastructure: The token is built on the Solana blockchain, known for its capacity to handle high-speed and low-cost transactions. Supply Dynamics: DIGITAL GOLD has a maximum supply capped at 100 quadrillion tokens (100P $BITCOIN), although details regarding its circulating supply are currently undisclosed. Utility: While precise functionalities are not explicitly outlined, there are indications that the token could be utilized for various applications, potentially involving decentralized applications (dApps) or asset tokenization strategies. Who is the Creator of DIGITAL GOLD ($BITCOIN)? At present, the identity of the creators and development team behind DIGITAL GOLD ($BITCOIN) remains unknown. This situation is typical among many innovative projects within the blockchain space, particularly those aligning with decentralized finance and meme coin phenomena. While such anonymity may foster a community-driven culture, it intensifies concerns about governance and accountability. Who are the Investors of DIGITAL GOLD ($BITCOIN)? The available information indicates that DIGITAL GOLD ($BITCOIN) does not have any known institutional backers or prominent venture capital investments. The project seems to operate on a peer-to-peer model focused on community support and adoption rather than traditional funding routes. Its activity and liquidity are primarily situated on decentralized exchanges (DEXs), such as PumpSwap, rather than established centralized trading platforms, further highlighting its grassroots approach. How DIGITAL GOLD ($BITCOIN) Works The operational mechanics of DIGITAL GOLD ($BITCOIN) can be elaborated on based on its blockchain design and network attributes: Consensus Mechanism: By leveraging Solana’s unique proof-of-history (PoH) combined with a proof-of-stake (PoS) model, the project ensures efficient transaction validation contributing to the network's high performance. Tokenomics: While specific deflationary mechanisms have not been extensively detailed, the vast maximum token supply implies that it may cater to microtransactions or niche use cases that are still to be defined. Interoperability: There exists the potential for integration with Solana’s broader ecosystem, including various decentralized finance (DeFi) platforms. However, the details regarding specific integrations remain unspecified. Timeline of Key Events Here is a timeline that highlights significant milestones concerning DIGITAL GOLD ($BITCOIN): 2023: The initial deployment of the token occurs on the Solana blockchain, marked by its contract address. 2024: DIGITAL GOLD gains visibility as it becomes available for trading on decentralized exchanges like PumpSwap, allowing users to trade it against SOL. 2025: The project witnesses sporadic trading activity and potential interest in community-led engagements, although no noteworthy partnerships or technical advancements have been documented as of yet. Critical Analysis Strengths Scalability: The underlying Solana infrastructure supports high transaction volumes, which could enhance the utility of $BITCOIN in various transaction scenarios. Accessibility: The potential low trading price per token could attract retail investors, facilitating wider participation due to fractional ownership opportunities. Risks Lack of Transparency: The absence of publicly known backers, developers, or an audit process may yield skepticism regarding the project's sustainability and trustworthiness. Market Volatility: The trading activity is heavily reliant on speculative behavior, which can result in significant price volatility and uncertainty for investors. Conclusion DIGITAL GOLD ($BITCOIN) emerges as an intriguing yet ambiguous project within the rapidly evolving Solana ecosystem. While it attempts to leverage the “digital gold” narrative, its departure from Bitcoin's established role as a store of value underscores the need for a clearer differentiation of its intended utility and governance structure. Future acceptance and adoption will likely depend on addressing the current opacity and defining its operational and economic strategies more explicitly. Note: This report encompasses synthesised information available as of October 2023, and developments may have transpired beyond the research period.

1.1k Total ViewsPublished 2025.05.13Updated 2025.05.13

What is $BITCOIN

Discussions

Welcome to the HTX Community. Here, you can stay informed about the latest platform developments and gain access to professional market insights. Users' opinions on the price of BTC (BTC) are presented below.

活动图片