Bitcoin Oversold Rebound Verification: Rebound is Not a Reversal | Guest Analysis

Odaily星球日报Published on 2026-03-09Last updated on 2026-03-09

Abstract

### Summary of Bitcoin Analysis: Rebound, Not Reversal This analysis provides a technical assessment of Bitcoin (BTC) and HYPE, concluding that Bitcoin's recent price increase is a bear market rebound within a larger corrective structure, not a trend reversal. **Key Points:** * **Core BTC View:** The rally from the February 6 low (~$60,000) is interpreted as a C-2 wave rebound within a larger C-wave correction. This rebound is seen as weak, lacking strong buying momentum and broad market participation, and is likely concluding. A subsequent C-3 wave decline is anticipated. * **Market Structure:** BTC is expected to maintain a weak range-bound consolidation. Key resistance is identified in the $72,300-$74,500 zone and $79,500-$80,600 zone. Key support levels are ~$65,000, $60,000-$62,500, and ~$57,400. * **Strategy Performance:** * A short-term bearish strategy (1x leverage) was executed, selling at ~$72,760 and buying back at ~$68,095 for a **6.41% gain**. * A medium-term short position (1x leverage), initiated near $89,000, remains open and is currently **~25.88% profitable** (as of the weekly close near $65,971). * **Technical Indicators:** Weekly and daily analyses using proprietary momentum, sentiment, and quantitative models indicate a clear and ongoing bearish trend. The recent bounce is classified as a technically weak, unsustainable rebound within this downtrend. * **HYPE Analysis:** The token HYPE is analyzed separately, with its structure su...

Core Points:

• HYPE Multi-Cycle Trend Structure Deep Deconstruction: Weekly tracking. (Details in Part 1)

• BTC Strategy Execution (Short-term) Effectiveness Verification: Bitcoin followed the established short-term strategy last week, completing one short-term short position (1x leverage), successfully achieving a return of approximately 6.41%. (Details in Table 1)

• BTC Strategy Execution (Medium-term) Effectiveness Verification: Bitcoin followed the established medium-term strategy last week, continuing to hold the short position established at $89,000 (1x leverage). As of last week's close (approx. $65,971), the profit is about 25.88%, with a maximum profit during the period of about 32.58%.

• Core View (Short-term) Verification: Bitcoin continued to maintain a weak range-bound oscillation pattern last week. The current trend is in line with expectations.

• BTC This Week's Market Trend Forecast and Medium & Short-term Trading Strategies.

The following will review the market forecast, strategy execution, and specific trading process in detail.

I. HYPE Multi-Cycle Trend Structure Analysis and Short-term Trading Review:

HYPE Daily K-Line Chart
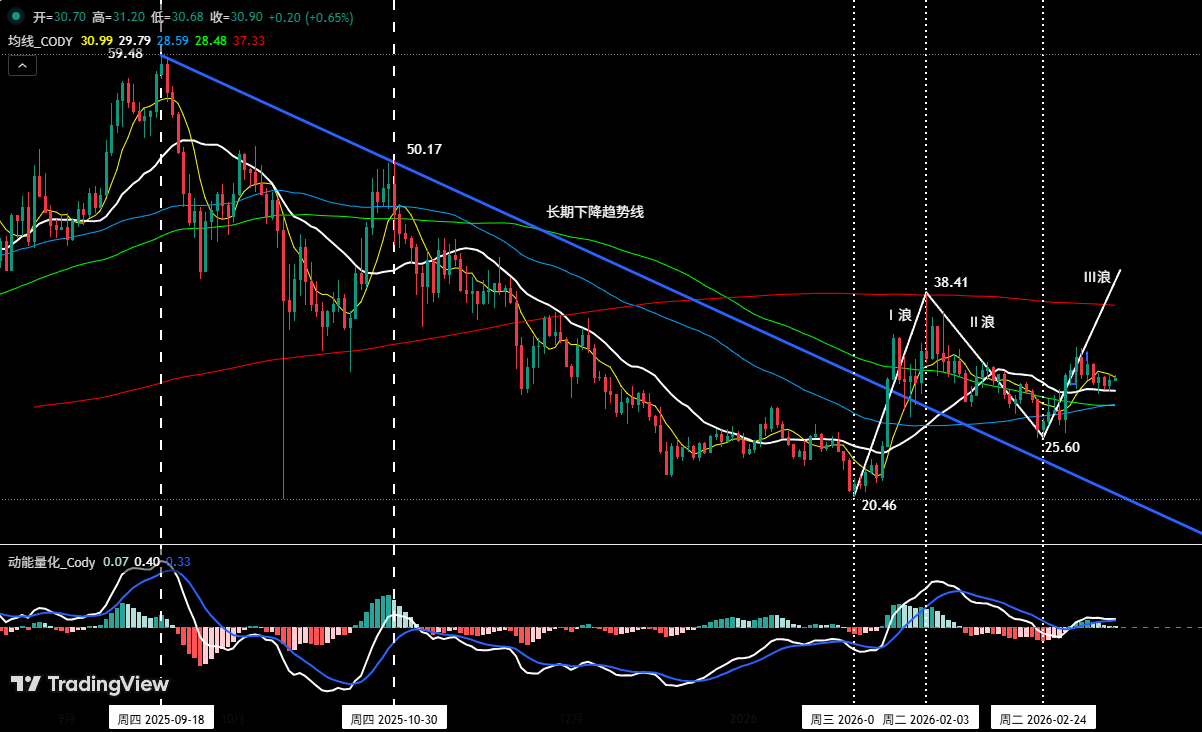
Figure 1

We first highlighted the investment opportunity in HYPE in the weekly review on February 22, clearly stating the potential for a major upward (Wave III) move in the near term. In the weekly review on March 1, we reiterated: the low of $25.60 on February 24 might be the starting point of Wave III, which is currently underway.

1. Large-scale Trend Structure Analysis (See Figure 1):(Based on market evolution after January 21)

• Wave I (Impulse Wave): From the low of $20.46 on January 21 to the high of $38.41 on February 3, lasting 14 days, with a maximum gain of 87.73%.

• Wave II (Corrective Wave): From the high of $38.41 on February 3 to the low of $25.60 on February 24, lasting 20 days, with a maximum decline of 33.35%.

• Wave III (Potential Impulse Wave): From the low of $25.60 on February 24 to the present, the market is currently running, lasting 13 days so far, with a maximum gain of 31.5%.

• From the Moving Average System: The upward trend starting on February 24 has effectively broken through multiple moving average resistances. The current price is retesting key medium-term moving averages (e.g., the 21-day MA) to test the strength of support after the breakout. In terms of volume, it shows a healthy state of "increased volume on rallies, decreased volume on pullbacks," with good volume-price coordination.

• From the Momentum Quantification Model: The momentum line on the daily chart continues to operate above the zero axis, indicating the market is in a clear uptrend. The current movement is in a stage of momentum accumulation and consolidation.

2. Small-scale Structure Analysis:(Based on market movement after March 2)

HYPE 1-hour K-Line Chart
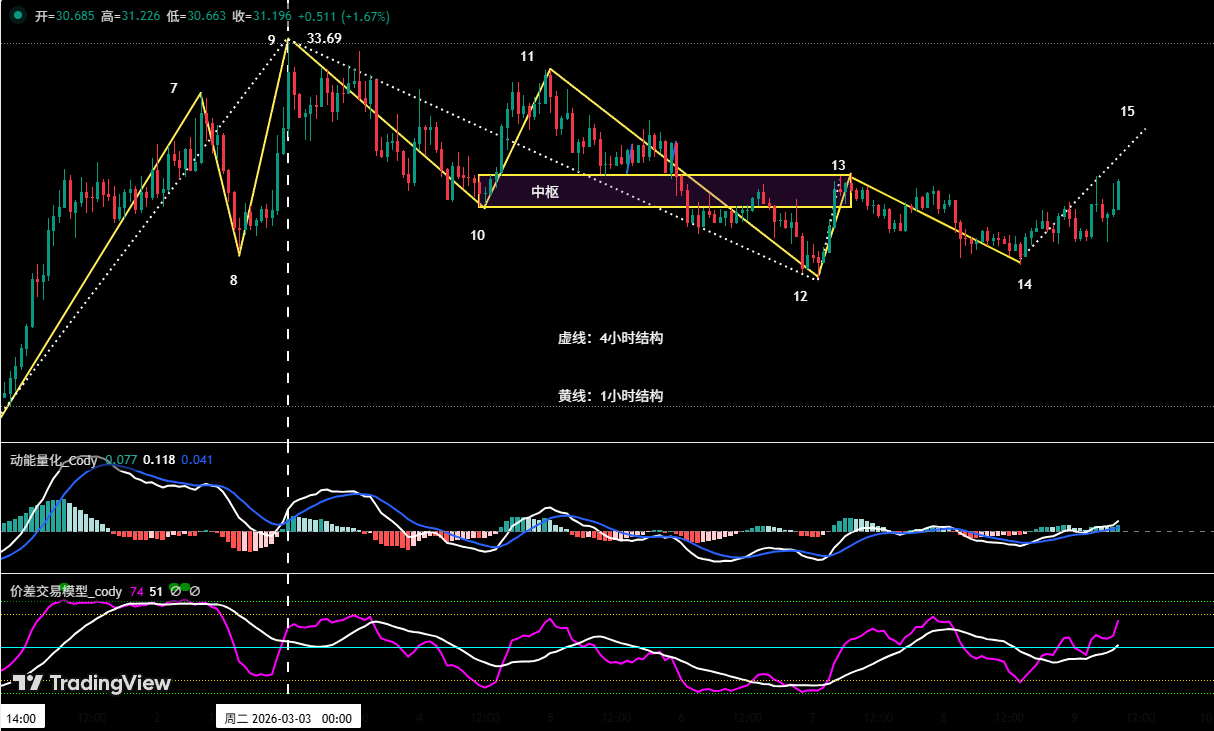
Figure 2

As shown in (Figure 2), HYPE upward move starting from the low on February 24 entered a correction phase after touching the high of $33.69 on March 2. Below, we will start with the 1-hour chart structure to analyze the end signals and potential turning points of this correction in detail.

• Internal Structure Division:(From the high of $33.69 on March 2 to present)

It can be subdivided into a 5-segment structure: 9-10, 10-11, 11-12, 12-13, 13-14, forming a complete corrective move.

• Central Pivot (Zhongshu) Construction: In the 5-segment structure, 9-10 is the entering segment, 13-14 is the leaving segment, and 10-11, 11-12, 12-13 these 3 segments form the central pivot structure.

• Correction Turning Point Formation and Validation: As shown in (Figure 2), a divergence signal has formed between the entering segment and the leaving segment. Therefore, we believe the probability is high that this correction ended at endpoint 12. If the upward move starting from endpoint 12 first effectively stabilizes above the $31.5 resistance level, and then breaks through the local previous high of $32.75, the probability of this correction ending and a new upward wave beginning will significantly increase. (Special emphasis: Any subsequent correction in HYPE should not fall below the price of endpoint 12 (approx. $29.44). Otherwise, the above conclusion is invalid, and the correction turning point will be delayed)

3. HYPE Upside Risk Warning: Although HYPE's trend has some independence, it cannot completely detach from Bitcoin's overall environment. If Bitcoin continues to weaken and breaks below key support (e.g., around $65,000), it may increase selling pressure across the altcoin market, thereby affecting HYPE's rebound momentum.

4. HYPE Short-term Trading Review (1x Leverage):(03.02~03.08)

We anticipated that HYPE was in an upward trend on the daily chart. Last week, based on the core trading strategy of "following the trend" and combined with the analysis of the hourly correction, we did not open any new (long) positions during this period.

II. Bitcoin Last Week's Trading Strategy and Key Level Review:(03.02~03.08)

1、Short-term Strategy Review:(See Table 1)

Strictly following the trading signals from our self-built Spread Trading Model and Momentum Quantification Model, and combined with market trend forecasts, we completed one short-term (short) trade last week, with a profit of 6.41%.

1、Bitcoin Short-term Trade Details Summary:(Leverage*1x)

Table 1

2、Short-term Trade Review:(See Figure 3)

• Entry: The price rebounded to near the important resistance level of $74,500, encountered resistance, and the Spread Trading Model triggered a top warning signal (green dot in the chart). Combined with sell signals from both models, a 30% short position was established at $72,760.

• Risk Control: Initial stop-loss for the short position was set above $75,500.

• Exit: The price fell to near $68,000, and the Spread Trading Model triggered a bottom warning signal (red dot in the chart). The position was fully closed near $68,095.

• Summary: This trade yielded a profit of 6.41%.

Bitcoin 60-minute K-Line Chart:(Momentum Quantification Model + Spread Trading Model)
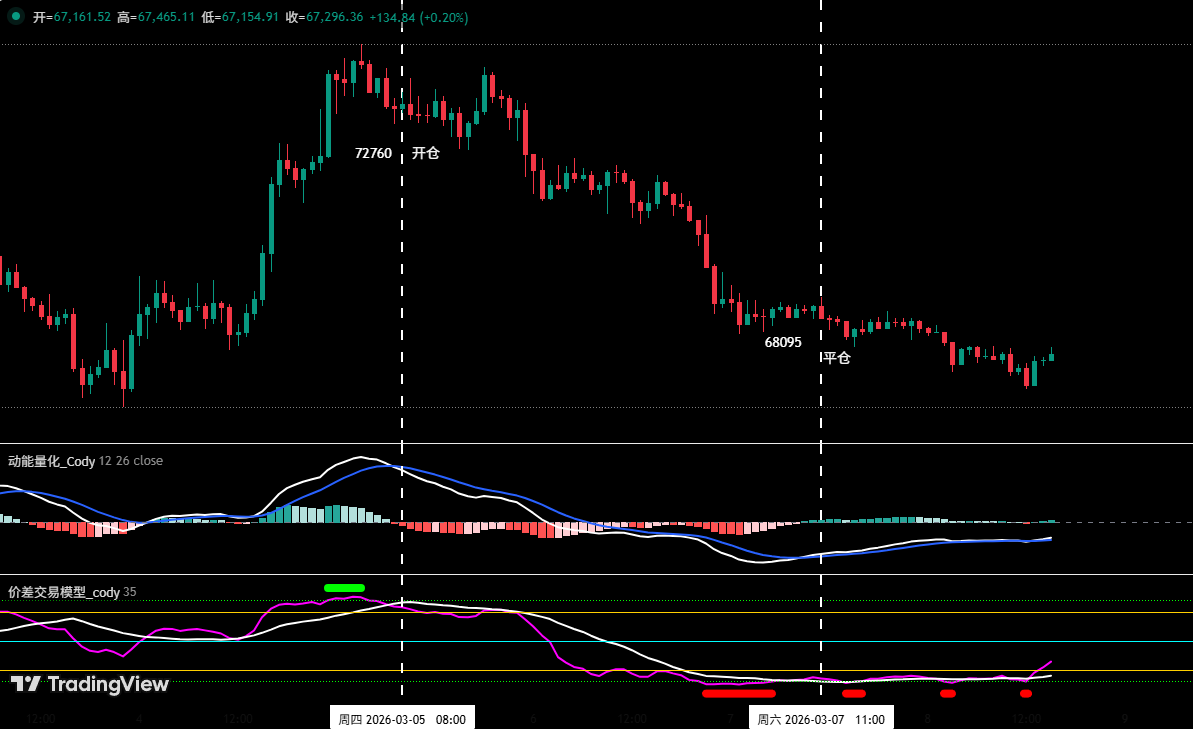
Figure 3 (Short-term Trade Illustration)

2、 Medium-term Strategy Review:

Medium-term Strategy: Continue holding the 60% short position established near $89,000 (January 28). As of last week's close (closing price approx. $65,971), the profit is about 25.88%.

III. Bitcoin Technical Indicator Analysis

Combining market movements, the author conducts an in-depth analysis of various Bitcoin technical indicators from multiple models and multi-dimensional perspectives based on a self-built trading system.

1. Analysis from the weekly chart level, as shown in (Figure 4):

Bitcoin Weekly K-Line Chart:(Momentum Quantification Model + Sentiment Quantification Model)
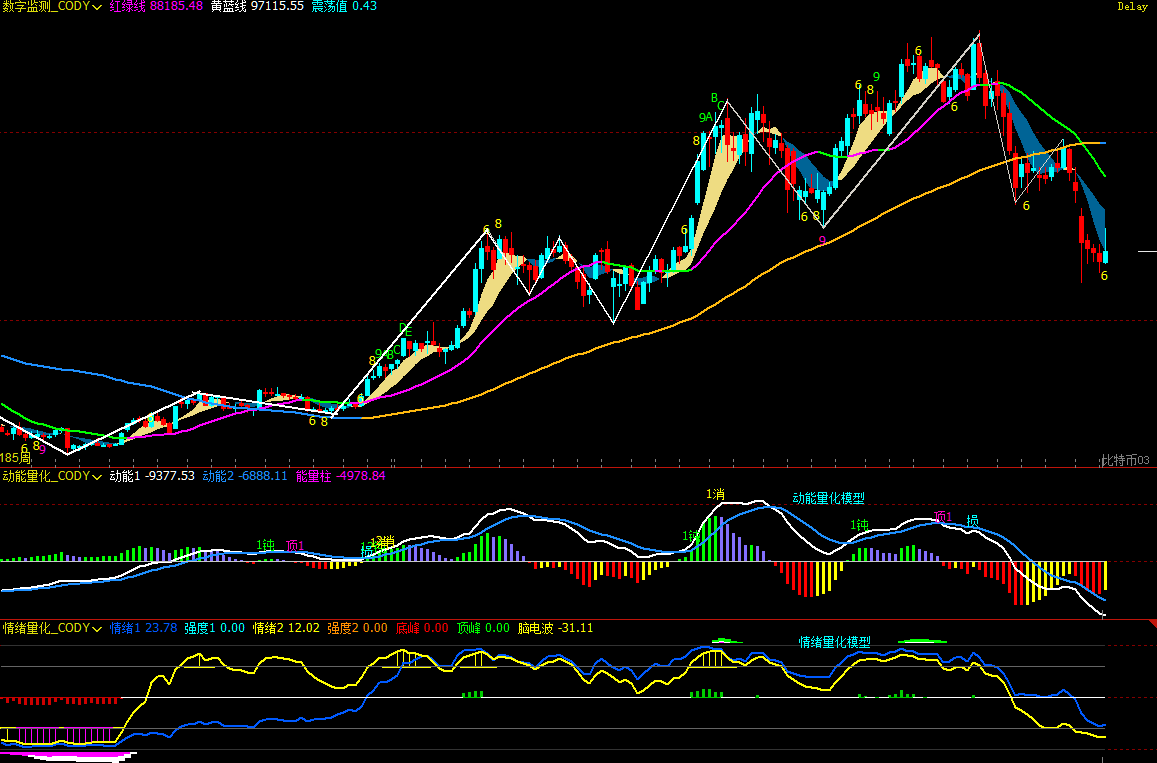
Figure 4

Momentum Quantification Model: Technical indicators show the momentum line declining synchronously, negative energy bars gradually shortening, with no momentum divergence signal appearing.

Sentiment Quantification Model: Blue sentiment line value 23, intensity zero; Yellow sentiment line value 11, intensity zero, peak value is 0.

Digital Monitoring Model: Moving averages show a bearish alignment. Last week closed with a small bullish candle with a long upper shadow, up 0.3%; No bottom digital monitoring signal appeared.

Comprehensive Analysis: Based on the data from the above three models, we believe the current Bitcoin weekly chart bearish trend is clear and continuing. Whether it's momentum divergence, extreme sentiment release intensity, or bottom signals from the digital model, none have appeared. It is currently in a falling mid-way pattern. After several weeks of sideways consolidation, the market is more likely to choose to探底 (explore lower levels) again.

2. Analysis from the daily chart level: As shown in (Figure 5)

Bitcoin Daily K-Line Chart:(Momentum Quantification Model + Sentiment Quantification Model)
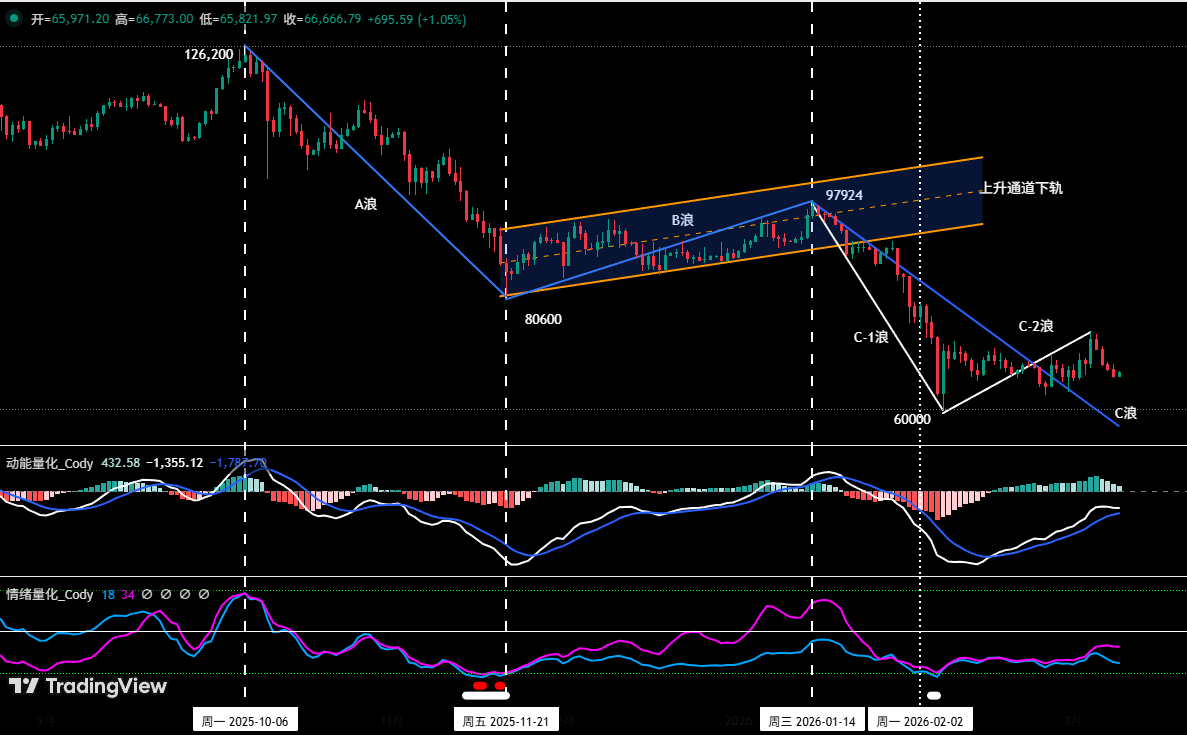
Figure 5

Momentum Quantification Model: Last week's overall performance was "rising first then falling later". The momentum line is rising synchronously below the zero axis, positive energy bar changes are disordered.

Sentiment Quantification Model: At the end of last week's daily session, the blue sentiment line value was 19, intensity zero; the purple sentiment line value was 35, intensity zero, slowly exiting the oversold area.

Comprehensive Analysis: After analyzing the data from the Momentum Quantification and Sentiment Quantification models, we believe the technical structure of Bitcoin's daily bearish trend has not changed. The current行情 (market movement) is an oversold rebound, and due to disordered buying momentum, cautious market sentiment, and low capital participation, this rebound is weak with poor sustainability.

IV. This Week's Market Forecast:(03.09~03.15)

1、Bitcoin Upward Central Pivot Construction (Based on post-February 6 low):(Updated weekly)

Bitcoin 4-hour K-Line Chart
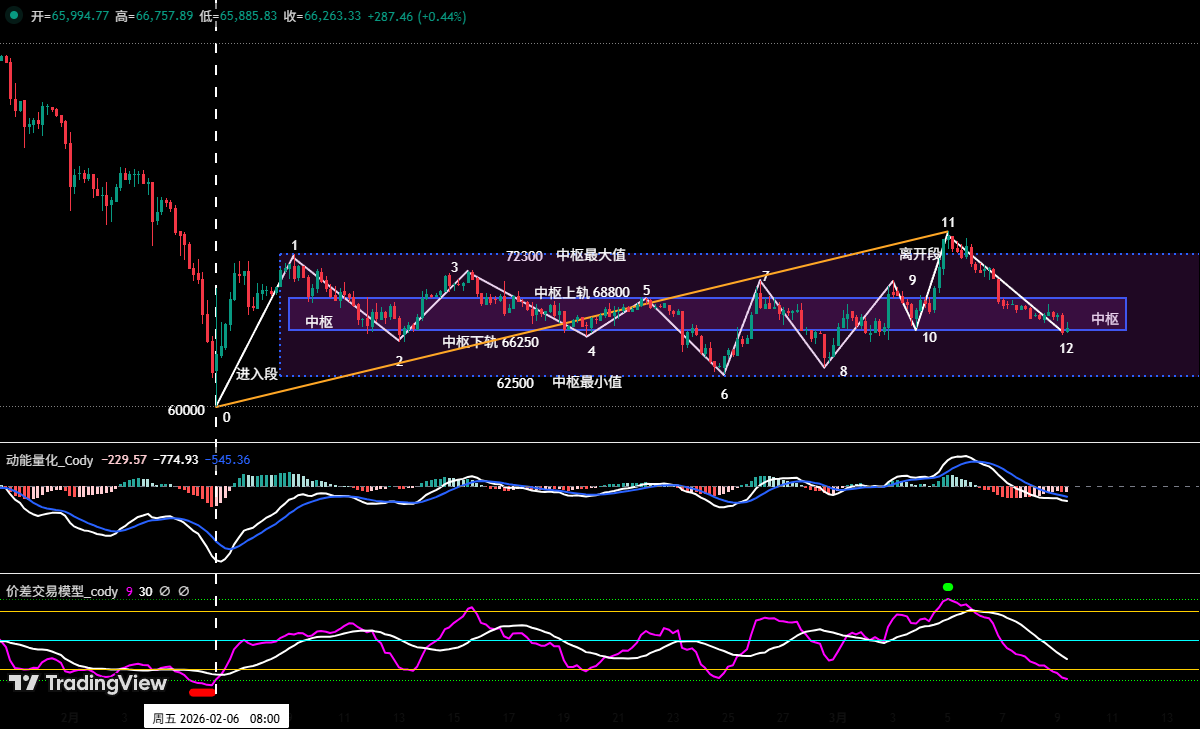
Figure 6

Using Bitcoin's 4-hour chart as the analysis周期 (cycle):

Central Pivot Construction: As seen in (Figure 6): The "Upward Central Pivot" structure is basically formed. Its highest resistance is around $72,300, and the lowest support is around $62,500; the upper轨 (rail) of the pivot is around $68,800, and the lower轨 (rail) is around $66,250.

2、 C-2 Wave Rebound End Judgment:

We maintain the previous core analysis framework: The upward move in Bitcoin starting from the low on February 6 (approx. $60,000) is, in nature, an oversold rebound within the large-scale C wave correction, specifically the C-2 wave. This is expected to be followed by a C-3 wave corrective行情 (market movement).

Bottom Warning: As seen in (Figure 6): Our self-built Spread Trading Model triggered a bottom warning signal (red dot) near Endpoint 0 on February 6, accurately capturing the start of the C-2 wave.

Top Warning: At the recently formed Endpoint 11, the Spread Quantification Model triggered a top warning signal (green dot). The successive appearance of bottom and top warning signals confirms the formation of a complete rebound wave from a model perspective, suggesting upward momentum may be exhausted.

3、This Week's Core View: Maintain the range-bound oscillation pattern. The C-2 wave oversold rebound may be nearing its end. Pay attention to the direction choice. Strategically, firmly implement the operational principle of "reduce positions (longs) on rallies, control risk".

4、Core Resistance Levels:

• First Resistance Area: $72,300-$74,500 area (Previous high volume transaction area)

• Second Resistance Area: $79,500-$80,600 area (Near the November 2025 low)

5、Core Support Levels:

• First Support Level: Around $65,000 (Previous important support area)

• Second Support Level: $60,000~$62,500 area (Near the February 6 low)

• Third Support Level: Around $57,400

V. This Week's Trading Strategy (Excluding Sudden News Impact):(03.09~03.15)

1、 Medium-term Strategy: See Figure Seven

Bitcoin Daily K-Line Chart:(Position Monitoring Model)
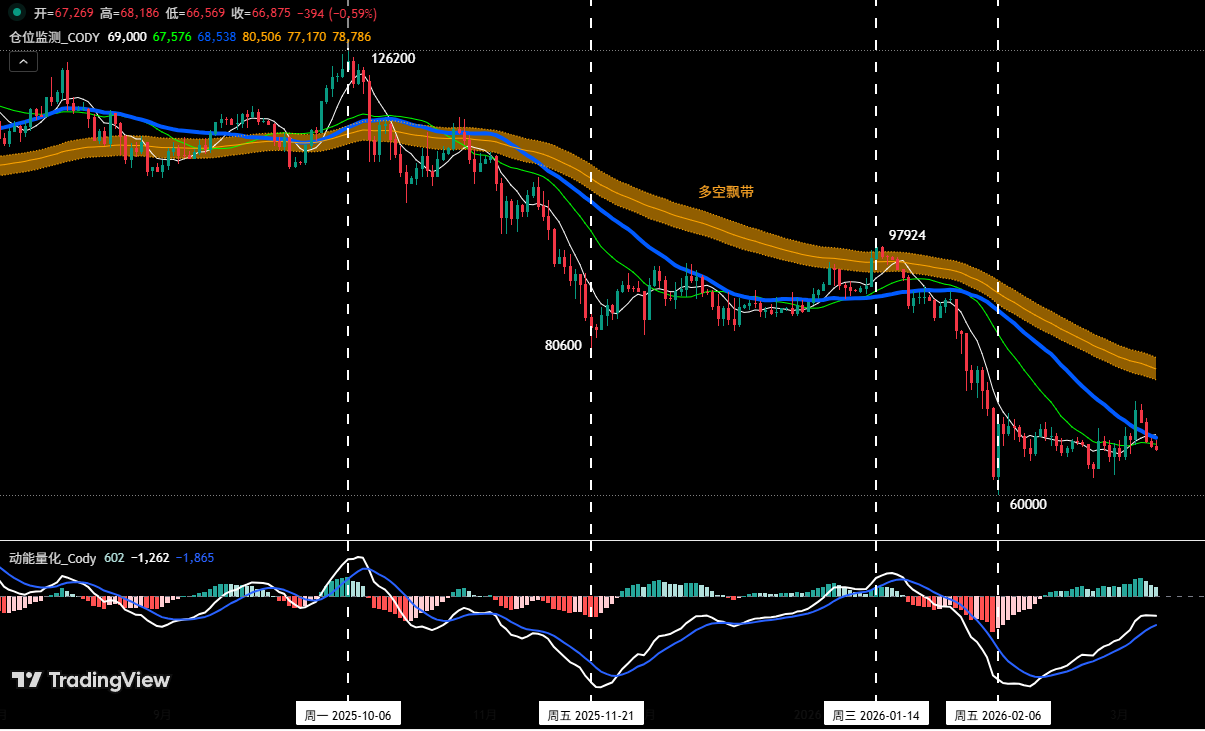
Figure 7

Position Monitoring Model: The current price is below the Bull-Bear Ribbon (yellow), so continue holding the 60% short position established at $89,000 (January 28).

• If the price反弹 (rebounds) and effectively breaks above $74,500, reduce the medium-term position to 40%.

• If the price反弹 (rebounds) and effectively breaks above and stabilizes above the Bull-Bear Ribbon, clear all medium-term positions.

2、 Short-term Strategy: Use 30% of the position, set stop-loss points, and look for "spread" opportunities based on support and resistance levels. (Use 30-minute/60-minute as the operation cycle).

3、 Since the medium-term market direction is bearish, to dynamically respond to complex market changes and combined with signals from our self-built trading model, we have prepared A/B two short-term operation plans:

Plan A: Sell on rallies encountering resistance.

• Entry: When the price反弹 (rebounds) to the $72,300~$74,500 area, triggers resistance signals, and combines with model top signals, establish a 30% short position.

• Risk Control: Initial stop-loss for the short position set above $75,500.

• Exit: When falling near important support levels and combined with model signals, gradually close the position to take profits.

Plan B: Follow-through breakout short.

• Entry: When the price effectively breaks below the lower轨 (rail) of the central pivot at $66,250, then retraces to this level but fails to hold above it, and combines with model top signals,顺势 (follow the trend) to establish a 30% short position.

• Risk Control: Initial stop-loss for the short position set above $67,500.

• Exit: When falling to support levels and combined with model signals, gradually close the position to take profits.

VI. Special Notes:​​

1. When opening a position: Immediately set the initial stop-loss level.

2. When profit reaches 1%: Move the stop-loss to the entry price (breakeven point) to ensure capital safety.

3. When profit reaches 2%​​: Move the stop-loss to the 1% profit level.

4. Continuous Tracking: Thereafter, for every additional 1% profit, move the stop-loss up 1%同步 (synchronously), dynamically protecting and locking in profits.

Financial markets change rapidly. All market analysis and trading strategies require dynamic adjustment. All views, analytical models, and operational strategies involved in this article are derived from personal technical analysis, intended solely for personal trading log purposes, and do not constitute any investment advice or operational basis. The market involves risks, investment requires caution. Do not make decisions based solely on this.


Trending Cryptos

Related Questions

QWhat is the core short-term view on Bitcoin's price action as per the analysis?

AThe core short-term view is that Bitcoin continues to maintain a weak range-bound consolidation pattern. The recent price action is considered an oversold rebound, not a reversal, and is expected to be weak with poor sustainability.

QWhat was the outcome of the short-term BTC strategy executed last week?

AThe short-term strategy involved a successful short position (1x leverage) that was executed, resulting in a profit of approximately 6.41%.

QWhat is the current status and performance of the medium-term BTC short position mentioned?

AThe medium-term short position, initially opened at approximately $89,000 (1x leverage), is still being held. As of the previous week's close (~$65,971), it has a profit of about 25.88%, with a maximum profit of around 32.58% during the period.

QAccording to the multi-cycle analysis, what is the larger trend structure for Bitcoin (BTC)?

AThe analysis concludes that Bitcoin's weekly chart shows a clear and ongoing bearish trend. It is currently in a下跌中继形态 (falling relay pattern), indicating a high probability of choosing to探底 (probe the bottom) again after several weeks of sideways movement.

QWhat are the two short-term trading plans (A and B) proposed for the upcoming week?

APlan A: Sell on rallies. Open a 30% short position if the price rebounds to the $72,300-$74,500 area and meets resistance, with a stop-loss above $75,500. Plan B: Breakout short. Open a 30% short position if the price effectively breaks below the central pivot lower rail at $66,250 and then fails to hold above it on a pullback, with a stop-loss above $67,500.

Related Reads

Must-Watch Events Next Week|CLARITY Act Could Face Senate Vote; SpaceX, Circle to Report Earnings (8.3-8.9)

**Summary: Key Events and Developments to Watch (August 3-9)** The upcoming week is marked by significant financial disclosures, key legislative deadlines, and notable product updates. **Major Financial Events:** Several companies are scheduled to release their Q2 2026 earnings. American Bitcoin (ABTC) will report on August 3, followed by SpaceX and Hut 8 Mining Corp. on August 4, and Circle on August 5. Notably, a significant portion of SpaceX shares (up to 12% of total shares) will be unlocked on August 6 following their earnings release. **Key Legislative Deadline:** The U.S. Senate faces an August 7 deadline to secure 60 votes for the CLARITY Act, a bipartisan bill aiming to establish a federal regulatory framework for cryptocurrencies. The Senate may hold a full vote on the bill during the week. **Economic Data:** The U.S. July Non-Farm Payrolls report will be released on August 7, providing crucial labor market data. **Technology & Product Updates:** * **Shutdowns:** DeFi portfolio tracker Zapper and wallet app Ctrl Wallet will cease operations on August 3. * **Upgrades:** LayerZero will deprecate its v1 relayers on August 3. XRP Ledger's new version 3.3.0, featuring five new functions, is expected next week. * **AI:** Elon Musk announced that the advanced Grok 4.6 AI model is set for release around August 7. * **Bitcoin:** The BIP-110 forced signaling for a potential Bitcoin network change is scheduled to begin around August 8. **Other Notable Events:** Chinese robotics firm Unitree Tech has set its preliminary price inquiry for its IPO for August 5. South Korean exchange Upbit will delist AQT and AERGO tokens on August 3.

marsbit37m ago

Must-Watch Events Next Week|CLARITY Act Could Face Senate Vote; SpaceX, Circle to Report Earnings (8.3-8.9)

marsbit37m ago

Stocks Are Plummeting More Sharply Than Cryptocurrencies. Where Has the Money Gone?

Stock Markets Plunge Deeper Than Cryptocurrencies: Where Did the Money Go? In late July, Seoul's Kospi index triggered circuit breakers for two consecutive days, plummeting over 40% from its June high. The collapse was led by heavyweight stocks like SK Hynix, whose record profits still disappointed investors, and devastating leveraged ETFs, with one major product losing over 83% of its value. This signaled a global, forced deleveraging targeting the most crowded trades. Interestingly, while stocks exhibited extreme volatility akin to crypto markets, Bitcoin rose nearly 15% in July after a prior steep drop. Analysis shows the money fleeing equities did not flow into Bitcoin. Instead, Bitcoin had already absorbed its sell-off in May-June, when U.S. spot Bitcoin ETFs saw historic outflows. The true safe-haven beneficiary was gold, whose price rose over 20% year-on-year, highlighting a decoupling between Bitcoin and gold as "digital gold." The sell-off was a targeted unwinding of leveraged positions in tech and semiconductors, accelerated by broker-dealer risk management and shifts in the AI narrative, including new competition from Chinese memory chipmakers. The retreat path was clear: from high-valuation tech stocks to cash and U.S. Treasuries, then to gold. For Bitcoin to attract sustained institutional inflows, conditions like eased global liquidity pressure, a "soft-landing" Fed rate cut, and U.S. regulatory clarity via legislation like the stalled CLARITY Act are needed. Currently, Bitcoin is not a safe haven but an already-cleared asset. Its low correlation with tech stocks, however, makes it a potential diversification play for institutional portfolios once the storm passes. The money isn't here yet, but the positioning is underway.

marsbit37m ago

Stocks Are Plummeting More Sharply Than Cryptocurrencies. Where Has the Money Gone?

marsbit37m ago

In Conversation with Ray Dalio: We Are Currently in an AI Bubble, with 1% of My Portfolio in Bitcoin

Ray Dalio, founder of Bridgewater Associates, warns in an interview that the current AI boom shows classic bubble characteristics, which could lead to significant economic downturns as seen in past cycles like 1929 or 2000. He explains that speculative enthusiasm, fueled by debt and overvaluation, often precedes a crash when rising rates or taxation force asset sales, causing widespread losses and recession. Dalio also outlines his "Big Cycle" theory, describing an approximate 80-year pattern where widening wealth gaps, massive government deficits, and shifting geopolitical power (like China's rise) create internal conflict and global instability. He emphasizes that we are in a late-cycle, transitional phase where traditional powers like the US and UK face decline. For personal wealth protection, Dalio advises diversification beyond cash into assets like stocks, bonds, real estate, and particularly gold, which he prefers over Bitcoin. While he holds about 1% of his portfolio in Bitcoin as a non-printable hard asset, he views gold as more secure from technological or governmental threats. Regarding AI's impact, Dalio believes it will disproportionately benefit capital owners, worsening inequality by replacing both physical and cognitive labor. He suggests that human intuition and emotional intelligence, combined with AI, will be key for future workers. On taxation, Dalio argues that wealth taxes are impractical and risk triggering asset sell-offs, reducing productive investment. He points to the UK as a cautionary example of debt, low productivity, and political strife. Geopolitically, Dalio foresees a more regionalized world, with the US showing weakness in prolonged conflicts like with Iran, akin to past imperial declines. The ideal outcome, he suggests, is coexisting powerful blocs (e.g., Americas, China-Asia Pacific) without major war.

marsbit4h ago

In Conversation with Ray Dalio: We Are Currently in an AI Bubble, with 1% of My Portfolio in Bitcoin

marsbit4h ago

Daily 7.2 Trillion KRW: Foreign Capital's Record Net Buying on Friday! Wall Street Says Headwinds for Korean Stock Fund Flows Have Subsided

South Korean stock market sees a dramatic shift in fund flows. On July 31, foreign investors made a record net purchase of approximately KRW 7.2 trillion in KOSPI stocks, marking a fundamental reversal from the persistent large-scale net outflows seen in previous months. This contributed to a significant narrowing of foreign net selling in July to KRW 9.8 trillion, down sharply from KRW 48.4 trillion in June and KRW 44.5 trillion in May. Simultaneously, domestic institutional pressure eased. South Korean pension funds and asset managers turned to a net buying position in July, purchasing KRW 1.0 trillion worth of KOSPI shares, contrasting with net sales in May and June. Market volatility is expected to be dampened by new financial regulations. Effective July 31, the Financial Services Commission tightened access for retail investors to single-stock leveraged ETFs by raising the minimum cash deposit requirement. Trading volumes for these products subsequently dropped to about 50% of their monthly average. Citigroup Research maintains its year-end KOSPI target of 10,000 points. The firm cites several supportive factors: the substantial easing of headwinds from capital outflows, a robust fundamental outlook for the semiconductor sector, historically low market valuations, strong economic fundamentals, and the potential for policy support from financial authorities if needed.

marsbit4h ago

Daily 7.2 Trillion KRW: Foreign Capital's Record Net Buying on Friday! Wall Street Says Headwinds for Korean Stock Fund Flows Have Subsided

marsbit4h ago

Trading

Spot

Hot Articles

What is $BITCOIN

DIGITAL GOLD ($BITCOIN): A Comprehensive Analysis Introduction to DIGITAL GOLD ($BITCOIN) DIGITAL GOLD ($BITCOIN) is a blockchain-based project operating on the Solana network, which aims to combine the characteristics of traditional precious metals with the innovation of decentralized technologies. While it shares a name with Bitcoin, often referred to as “digital gold” due to its perception as a store of value, DIGITAL GOLD is a separate token designed to create a unique ecosystem within the Web3 landscape. Its goal is to position itself as a viable alternative digital asset, although specifics regarding its applications and functionalities are still developing. What is DIGITAL GOLD ($BITCOIN)? DIGITAL GOLD ($BITCOIN) is a cryptocurrency token explicitly designed for use on the Solana blockchain. In contrast to Bitcoin, which provides a widely recognized value storage role, this token appears to focus on broader applications and characteristics. Notable aspects include: Blockchain Infrastructure: The token is built on the Solana blockchain, known for its capacity to handle high-speed and low-cost transactions. Supply Dynamics: DIGITAL GOLD has a maximum supply capped at 100 quadrillion tokens (100P $BITCOIN), although details regarding its circulating supply are currently undisclosed. Utility: While precise functionalities are not explicitly outlined, there are indications that the token could be utilized for various applications, potentially involving decentralized applications (dApps) or asset tokenization strategies. Who is the Creator of DIGITAL GOLD ($BITCOIN)? At present, the identity of the creators and development team behind DIGITAL GOLD ($BITCOIN) remains unknown. This situation is typical among many innovative projects within the blockchain space, particularly those aligning with decentralized finance and meme coin phenomena. While such anonymity may foster a community-driven culture, it intensifies concerns about governance and accountability. Who are the Investors of DIGITAL GOLD ($BITCOIN)? The available information indicates that DIGITAL GOLD ($BITCOIN) does not have any known institutional backers or prominent venture capital investments. The project seems to operate on a peer-to-peer model focused on community support and adoption rather than traditional funding routes. Its activity and liquidity are primarily situated on decentralized exchanges (DEXs), such as PumpSwap, rather than established centralized trading platforms, further highlighting its grassroots approach. How DIGITAL GOLD ($BITCOIN) Works The operational mechanics of DIGITAL GOLD ($BITCOIN) can be elaborated on based on its blockchain design and network attributes: Consensus Mechanism: By leveraging Solana’s unique proof-of-history (PoH) combined with a proof-of-stake (PoS) model, the project ensures efficient transaction validation contributing to the network's high performance. Tokenomics: While specific deflationary mechanisms have not been extensively detailed, the vast maximum token supply implies that it may cater to microtransactions or niche use cases that are still to be defined. Interoperability: There exists the potential for integration with Solana’s broader ecosystem, including various decentralized finance (DeFi) platforms. However, the details regarding specific integrations remain unspecified. Timeline of Key Events Here is a timeline that highlights significant milestones concerning DIGITAL GOLD ($BITCOIN): 2023: The initial deployment of the token occurs on the Solana blockchain, marked by its contract address. 2024: DIGITAL GOLD gains visibility as it becomes available for trading on decentralized exchanges like PumpSwap, allowing users to trade it against SOL. 2025: The project witnesses sporadic trading activity and potential interest in community-led engagements, although no noteworthy partnerships or technical advancements have been documented as of yet. Critical Analysis Strengths Scalability: The underlying Solana infrastructure supports high transaction volumes, which could enhance the utility of $BITCOIN in various transaction scenarios. Accessibility: The potential low trading price per token could attract retail investors, facilitating wider participation due to fractional ownership opportunities. Risks Lack of Transparency: The absence of publicly known backers, developers, or an audit process may yield skepticism regarding the project's sustainability and trustworthiness. Market Volatility: The trading activity is heavily reliant on speculative behavior, which can result in significant price volatility and uncertainty for investors. Conclusion DIGITAL GOLD ($BITCOIN) emerges as an intriguing yet ambiguous project within the rapidly evolving Solana ecosystem. While it attempts to leverage the “digital gold” narrative, its departure from Bitcoin's established role as a store of value underscores the need for a clearer differentiation of its intended utility and governance structure. Future acceptance and adoption will likely depend on addressing the current opacity and defining its operational and economic strategies more explicitly. Note: This report encompasses synthesised information available as of October 2023, and developments may have transpired beyond the research period.

1.4k Total ViewsPublished 2025.05.13Updated 2025.05.13

What is $BITCOIN

Discussions

Welcome to the HTX Community. Here, you can stay informed about the latest platform developments and gain access to professional market insights. Users' opinions on the price of BTC (BTC) are presented below.

活动图片














