Bitcoin Forms Descending Pattern That Led To 2018 Bear Market Bottom

bitcoinistPublished on 2026-02-25Last updated on 2026-02-25

Abstract

Crypto analyst Osemka suggests Bitcoin is forming a descending pattern similar to the one preceding the 2018 bear market bottom, rather than the 2022 cycle. The current setup involves a falling resistance structure, a potential liquidity sweep below $60,000, and a developing bullish divergence on multiple timeframes. Bitcoin, trading around $65,100, has dropped nearly 50% from its October 2025 peak, with investor sentiment at extreme fear levels. If the pattern holds, BTC may gradually decline further, potentially dipping below $60,000 to absorb sell-side liquidity before stabilizing. The analysis emphasizes patience, noting the resemblance to the prolonged 2018 bottoming process.

Bitcoin may be shaping a bottoming structure that looks like the formation seen at the end of the 2018 bear market, according to crypto analyst Osemka. After reviewing past macro lows, the analyst is of the notion that the current Bitcoin setup is not similar to the 2022 cycle but instead is closer to the drawn-out descending pattern that preceded BTC’s price action in 2019.

The comparison is based on a falling resistance structure, a potential liquidity sweep below $60,000, a bear market bottom, and the development of a bullish divergence on multiple timeframes.

Descending Structure Points To Bear Market Bottom

Bitcoin is currently trading around $65,000, meaning it has dropped by about half from its October 2025 peak price of $126,080. By that measure, BTC has already entered bearish territory, and investor sentiment of extreme fear also supports that view.

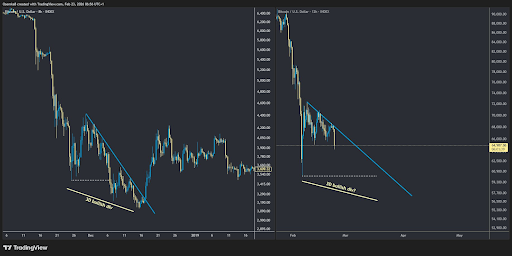
In an analysis posted on X, Osemka explained that after reviewing all major macro lows on Bitcoin, the current setup resembles the 2018 bear market bottom more closely than the 2022 bear market bottom. The chart he shared shows a descending pattern with a falling blue trendline that connects successive lower highs made by Bitcoin’s price action in February.

The structure shows price trading below the descending resistance, much like the late-2018 environment when Bitcoin continued to grind lower. According to the analyst, the present pattern appears to be forming a similar liquidity setup, and Bitcoin’s price is expected to gradually bleed lower before a final decisive move.
Bitcoin Price Chart. Source: @Osemka8 on X

Liquidity Hunt To $60,000, 3D Bullish Divergence As Bottom Signal

An important part of Osemka’s bottom prediction is the possibility of a liquidity sweep just below $60,000. The chart includes a dotted horizontal line near that level as a downside target where resting liquidity may sit.

The idea is that if Bitcoin continues to follow the 2018 price action, then it could continue to fall and briefly dip below $60,000, which would then absorb sell-side liquidity before stabilizing. If a comparable liquidity hunt unfolds, it could complete the descending pattern. Until then, the analyst’s message is patience.

Another major factor highlighted in the chart is the formation of a 3D bullish divergence. This is a case where BTC prints lower lows across multiple time frames, but a momentum indicator like RSI, MACD, or Stochastic makes a higher low.

At the time of writing, Bitcoin is trading at $65,100 and is only a 7.8% correction move away from breaking below $60,000. Bitcoin is increasingly at risk of breaking below this level, with the fear and greed index at an extreme fear level of 11. This trend is reflected in persistent outflows from US Spot Bitcoin ETFs. The funds have now recorded five straight weeks of net withdrawals.

BTC reclaims $65,000 | Source: BTCUSD on Tradingview.com

Trending Cryptos

Related Questions

QAccording to crypto analyst Osemka, which past bear market bottom does the current Bitcoin setup most closely resemble?

AThe current Bitcoin setup more closely resembles the 2018 bear market bottom rather than the 2022 bear market bottom.

QWhat is the potential downside price target mentioned in the analysis for a liquidity sweep?

AThe potential downside price target for a liquidity sweep is just below $60,000.

QWhat technical signal, forming on multiple timeframes, is highlighted as a potential bottom signal?

AThe formation of a 3D bullish divergence on multiple timeframes is highlighted as a potential bottom signal.

QWhat is the current reading of the Crypto Fear and Greed Index, and what does it indicate?

AThe Crypto Fear and Greed Index is at an extreme fear level of 11, indicating very negative market sentiment.

QHow many consecutive weeks of net outflows have US Spot Bitcoin ETFs recorded at the time of writing?

AUS Spot Bitcoin ETFs have recorded five consecutive weeks of net outflows.

Related Reads

Goldman Sachs: July Smashes Through Crowded Trades, U.S. Stock Bull Market Not Broken but Harder to Navigate

Goldman Sachs: July Sees Crowded Trades Unwound, U.S. Bull Market Intact but Getting Tougher. The U.S. stock market in July did not see an index-level crash, but rather a significant unwinding of speculative positions. While the S&P 500 remained stable—trading within a narrow 3.5% range and staying within 2% of its high—underlying market dynamics were volatile. Heavily crowded trades, particularly in high-momentum tech, AI-linked stocks, and Asian strategies, faced severe pressure and forced deleveraging. Data indicates this was a meaningful cleanse, not a minor adjustment. Global tech exposure saw its largest sell-off in over five years, leverage in Korean equity ETFs plummeted, and Goldman's prime brokerage recorded the largest gross exposure reduction since late 2022. Leverage on momentum factors among fundamental long/short clients fell to the 28th percentile of its one-year range. The AI trade narrative shifted from pure potential to a focus on tangible returns. While Meta failed to show clear AI monetization, Microsoft and Amazon provided evidence that massive capital expenditure is translating into scalable revenue and product growth, preventing a blanket sell-off of the AI sector. The Federal Reserve's more opaque communication style and volatility in long-end Treasury yields have introduced new friction, particularly for rate-sensitive growth and tech stocks. The broader outlook for U.S. equities remains favorable, supported by a strong economy, robust earnings, and substantial AI capital expenditure. However, risk/reward is no longer cheap, and the market's upward elasticity has weakened. The Nasdaq 100's trajectory—up 12% year-to-date despite significant pullbacks—illustrates that the bull trend persists but the path is becoming more difficult. The key lesson from July is that the market no longer rewards crowded, highly leveraged trades, requiring more disciplined and liquid portfolio approaches.

marsbit1h ago

Goldman Sachs: July Smashes Through Crowded Trades, U.S. Stock Bull Market Not Broken but Harder to Navigate

marsbit1h ago

Interview with Robinhood Executive: Meme + Tokenized US Stocks as "Barbell" Customer Acquisition Strategy, All Business Lines Achieve Hundreds of Millions in Revenue

Interview with Robinhood executive Johann Kerbrat reveals the company's "barbell" customer acquisition strategy for its new Robinhood Chain, combining meme tokens with tokenized stocks. Three weeks after mainnet launch, the chain has seen over $3B in weekly DEX volume and 105M transactions. Kerbrat explains the logic behind the permissionless chain: meme tokens attract DeFi users, while tokenized real-world assets (RWA), currently over 90 US stocks and ETFs accessible in 120+ countries, serve global users. The goal is to bring Robinhood's 27 million funded accounts on-chain by simplifying DeFi with a user-friendly interface, exemplified by features like Robinhood Earn which offers yield without requiring wallet management. Built on Arbitrum's technology stack for its speed, low cost, and Ethereum's security, the chain focuses on financial products like Earn, spot trading, and perpetuals. Kerbrat downplays direct competition with platforms like Base, emphasizing the goal of expanding the overall market for on-chain assets. He details selective partnerships (e.g., Morpho, Lighter) based on compliance, unique UX, and differentiation. While regulatory clarity is pending for US perpetuals, the expansion continues via Bitstamp in Europe. Finally, Kerbrat positions Robinhood as a "super app" integrating stocks, options, crypto, banking, and AI trading, with all major business lines generating hundreds of millions in revenue. For the chain, current priority is driving adoption over maximizing gas fee revenue.

marsbit4h ago

Interview with Robinhood Executive: Meme + Tokenized US Stocks as "Barbell" Customer Acquisition Strategy, All Business Lines Achieve Hundreds of Millions in Revenue

marsbit4h ago

Trading

Spot

Hot Articles

What is $BITCOIN

DIGITAL GOLD ($BITCOIN): A Comprehensive Analysis Introduction to DIGITAL GOLD ($BITCOIN) DIGITAL GOLD ($BITCOIN) is a blockchain-based project operating on the Solana network, which aims to combine the characteristics of traditional precious metals with the innovation of decentralized technologies. While it shares a name with Bitcoin, often referred to as “digital gold” due to its perception as a store of value, DIGITAL GOLD is a separate token designed to create a unique ecosystem within the Web3 landscape. Its goal is to position itself as a viable alternative digital asset, although specifics regarding its applications and functionalities are still developing. What is DIGITAL GOLD ($BITCOIN)? DIGITAL GOLD ($BITCOIN) is a cryptocurrency token explicitly designed for use on the Solana blockchain. In contrast to Bitcoin, which provides a widely recognized value storage role, this token appears to focus on broader applications and characteristics. Notable aspects include: Blockchain Infrastructure: The token is built on the Solana blockchain, known for its capacity to handle high-speed and low-cost transactions. Supply Dynamics: DIGITAL GOLD has a maximum supply capped at 100 quadrillion tokens (100P $BITCOIN), although details regarding its circulating supply are currently undisclosed. Utility: While precise functionalities are not explicitly outlined, there are indications that the token could be utilized for various applications, potentially involving decentralized applications (dApps) or asset tokenization strategies. Who is the Creator of DIGITAL GOLD ($BITCOIN)? At present, the identity of the creators and development team behind DIGITAL GOLD ($BITCOIN) remains unknown. This situation is typical among many innovative projects within the blockchain space, particularly those aligning with decentralized finance and meme coin phenomena. While such anonymity may foster a community-driven culture, it intensifies concerns about governance and accountability. Who are the Investors of DIGITAL GOLD ($BITCOIN)? The available information indicates that DIGITAL GOLD ($BITCOIN) does not have any known institutional backers or prominent venture capital investments. The project seems to operate on a peer-to-peer model focused on community support and adoption rather than traditional funding routes. Its activity and liquidity are primarily situated on decentralized exchanges (DEXs), such as PumpSwap, rather than established centralized trading platforms, further highlighting its grassroots approach. How DIGITAL GOLD ($BITCOIN) Works The operational mechanics of DIGITAL GOLD ($BITCOIN) can be elaborated on based on its blockchain design and network attributes: Consensus Mechanism: By leveraging Solana’s unique proof-of-history (PoH) combined with a proof-of-stake (PoS) model, the project ensures efficient transaction validation contributing to the network's high performance. Tokenomics: While specific deflationary mechanisms have not been extensively detailed, the vast maximum token supply implies that it may cater to microtransactions or niche use cases that are still to be defined. Interoperability: There exists the potential for integration with Solana’s broader ecosystem, including various decentralized finance (DeFi) platforms. However, the details regarding specific integrations remain unspecified. Timeline of Key Events Here is a timeline that highlights significant milestones concerning DIGITAL GOLD ($BITCOIN): 2023: The initial deployment of the token occurs on the Solana blockchain, marked by its contract address. 2024: DIGITAL GOLD gains visibility as it becomes available for trading on decentralized exchanges like PumpSwap, allowing users to trade it against SOL. 2025: The project witnesses sporadic trading activity and potential interest in community-led engagements, although no noteworthy partnerships or technical advancements have been documented as of yet. Critical Analysis Strengths Scalability: The underlying Solana infrastructure supports high transaction volumes, which could enhance the utility of $BITCOIN in various transaction scenarios. Accessibility: The potential low trading price per token could attract retail investors, facilitating wider participation due to fractional ownership opportunities. Risks Lack of Transparency: The absence of publicly known backers, developers, or an audit process may yield skepticism regarding the project's sustainability and trustworthiness. Market Volatility: The trading activity is heavily reliant on speculative behavior, which can result in significant price volatility and uncertainty for investors. Conclusion DIGITAL GOLD ($BITCOIN) emerges as an intriguing yet ambiguous project within the rapidly evolving Solana ecosystem. While it attempts to leverage the “digital gold” narrative, its departure from Bitcoin's established role as a store of value underscores the need for a clearer differentiation of its intended utility and governance structure. Future acceptance and adoption will likely depend on addressing the current opacity and defining its operational and economic strategies more explicitly. Note: This report encompasses synthesised information available as of October 2023, and developments may have transpired beyond the research period.

1.3k Total ViewsPublished 2025.05.13Updated 2025.05.13

What is $BITCOIN

Discussions

Welcome to the HTX Community. Here, you can stay informed about the latest platform developments and gain access to professional market insights. Users' opinions on the price of BTC (BTC) are presented below.

活动图片