Analyzing if FET can hold its make-or-break level or drop to $0.20

ambcryptoPublished on 2026-03-31Last updated on 2026-03-31

Abstract

FET is trading near a critical support level of $0.2270 after declining over 8%, with analysts warning of a potential further drop to $0.20 or even $0.1737 if this level breaks. Short-term bearish sentiment is reinforced by derivatives data, showing stronger short positions and a descending triangle pattern on the chart. However, the long-term outlook may still be bullish, as the top 100 wallet addresses increased their holdings by 2.04% in the past week, suggesting accumulation. The Average Directional Index (ADX) indicates weak momentum, meaning the asset may struggle before any significant downward move.

Artificial Superintelligence Alliance [FET] has fallen over 8% and was trading near $0.229 at press time, a level that appears to be a make-or-break point for the asset. Moreover, strengthening derivatives’ metrics alongside expert commentary further reinforces and potentially confirms that FET could continue its downside move.

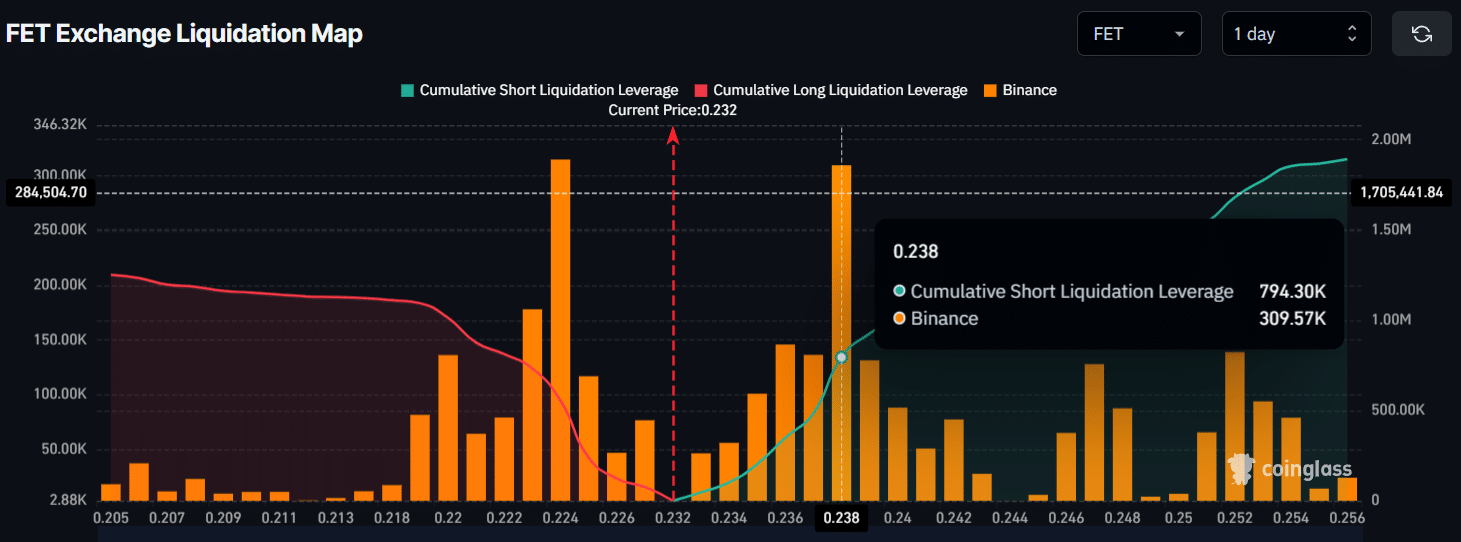
As the broader market struggles, CoinGlass data show intraday traders closely tracking the trend and betting on further declines.

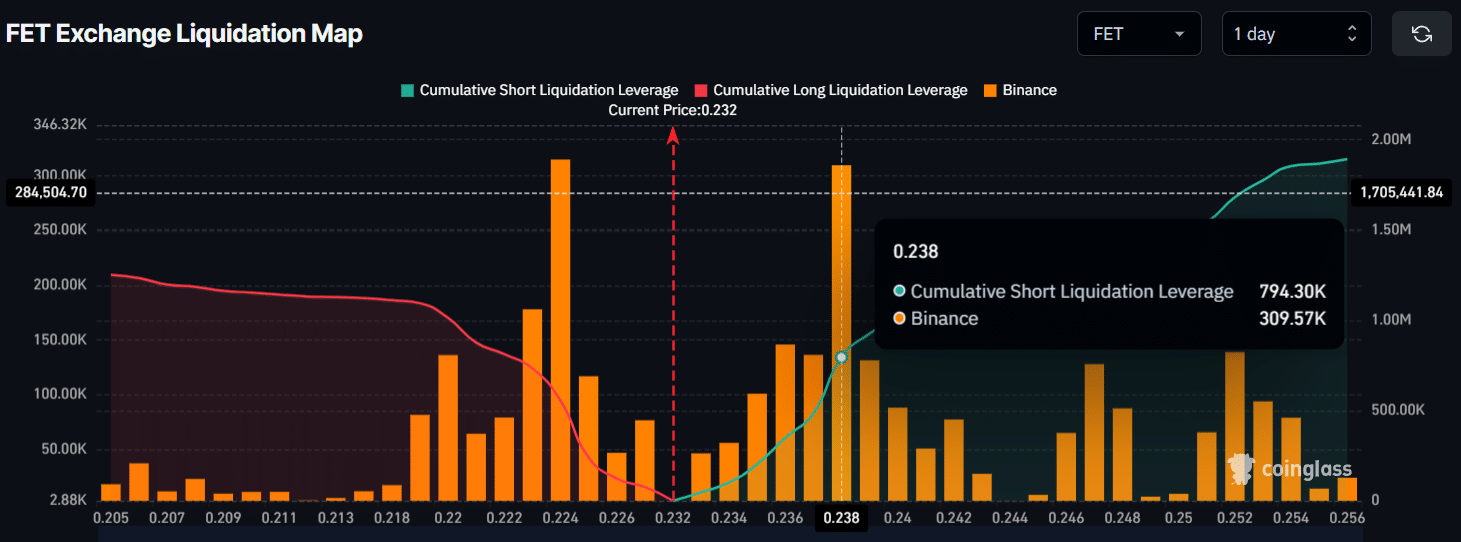
According to the FET exchange liquidation map, traders have shown strong interest around $0.224 on the downside and $0.238 on the upside. At these levels, they have built approximately $294K worth of long-leveraged positions and $794K worth of short-leveraged positions.

These bets indicate that bears are currently dominating the asset in the short term, while bulls appear to be exhausted.
Source: CoinGlass

In fact, a crypto analyst recently echoed a similar outlook on FET’s price. In a post on X, the analyst explained that the asset was retracing into a supply zone and showing clear signs of exhaustion. Moreover, FET appears positioned to grab liquidity before turning lower. For this potential decline, the expert outlined target levels, noting that FET could drop to $0.20 and $0.1737.

FET price action and key levels to watch

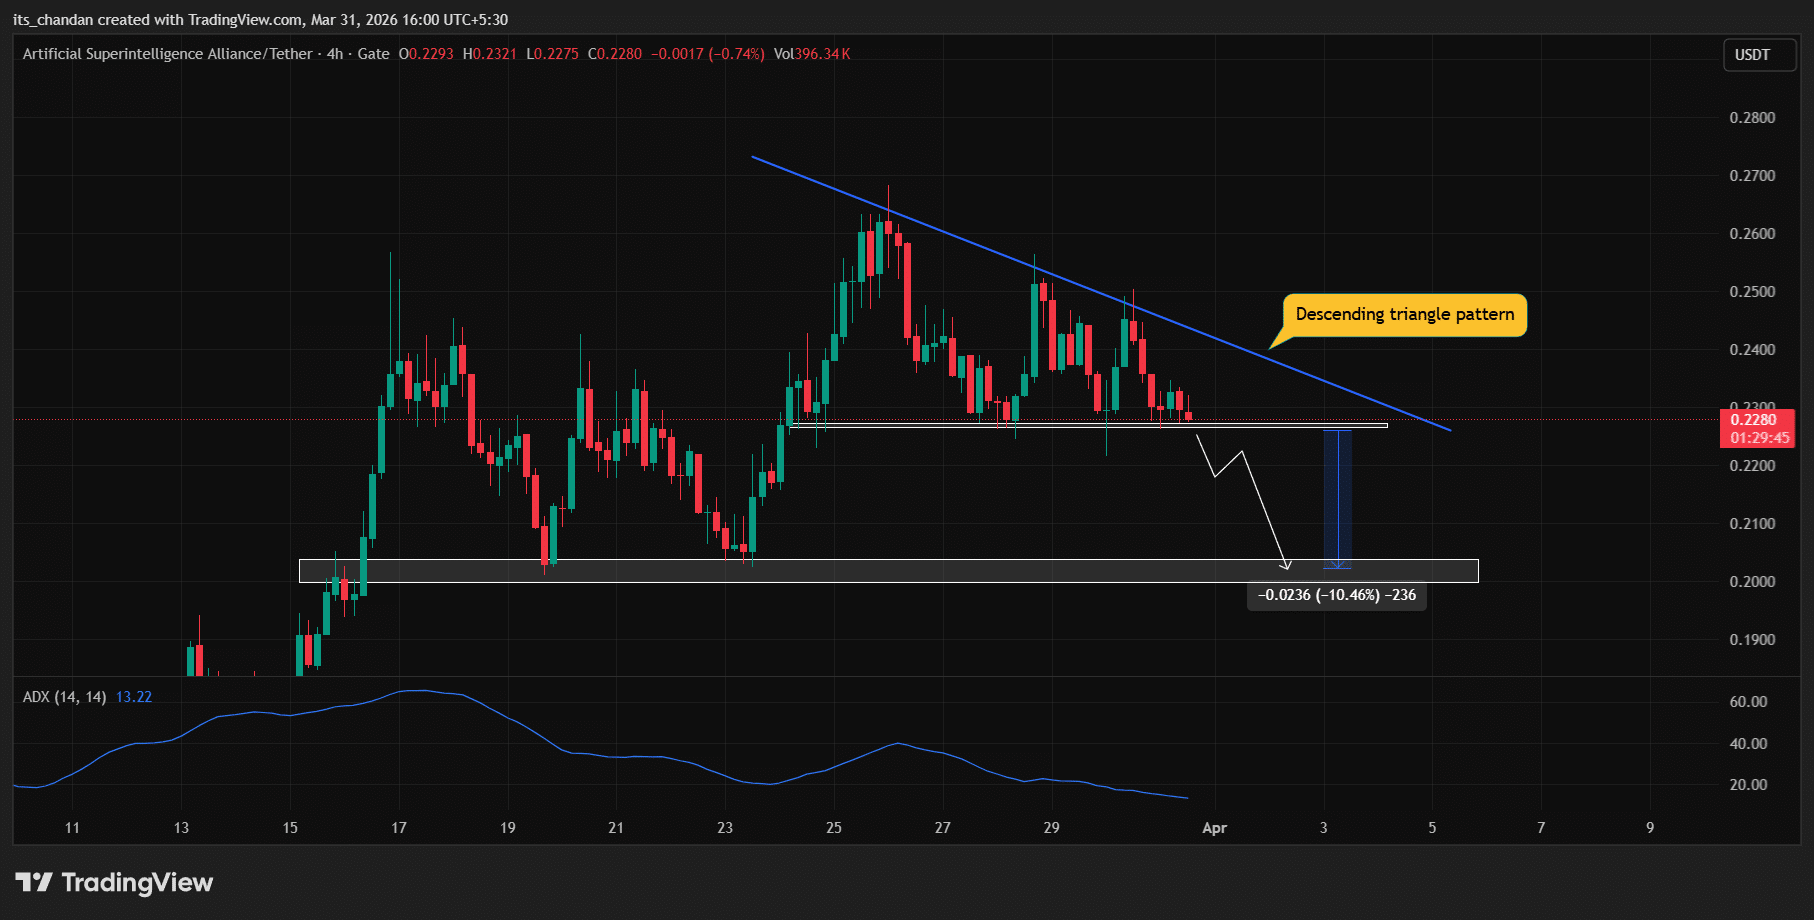
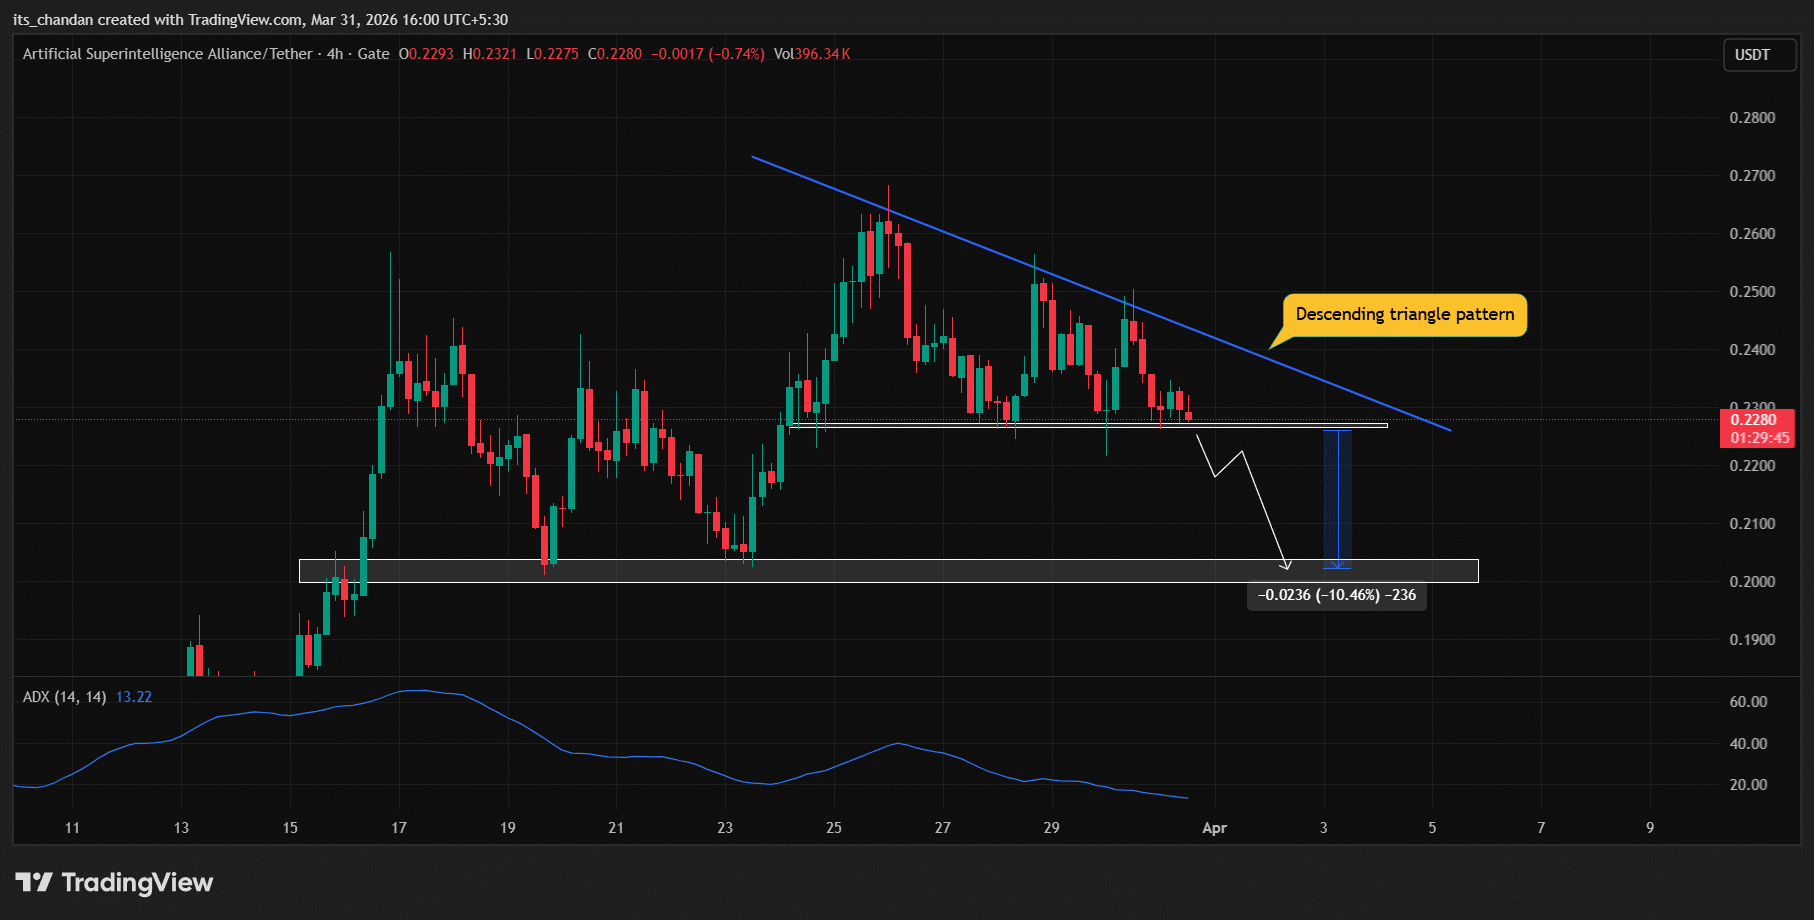
On the four-hour chart, FET appears bearish, as the token’s drop has brought the price to a make-or-break level, a level the asset has consistently held since the 26th of March 2026. In fact, the chart suggests that FET has formed a descending triangle pattern and is now poised for a breakdown.
Source: TradingView

Based on the current price action, if FET fails to hold its key support level of $0.2270 and closes a four-hour candle below it, the price could potentially decline by another 10%, reaching the $0.20 level in the coming days.

However, a reversal is also possible if the price remains above the $0.2270 level. An upside move would likely only begin if FET breaks out above the descending trendline of the pattern.

Alongside this, the technical indicator Average Directional Index (ADX) stood at 13.22, below the key threshold of 25, indicating weak directional momentum. This suggests that the asset may struggle before continuing its downward move.

Top 100 addresses increase holdings

Despite all these bearish developments over the past 24 hours, analytics tool Nansen indicates that FET’s long-term outlook remains bullish.

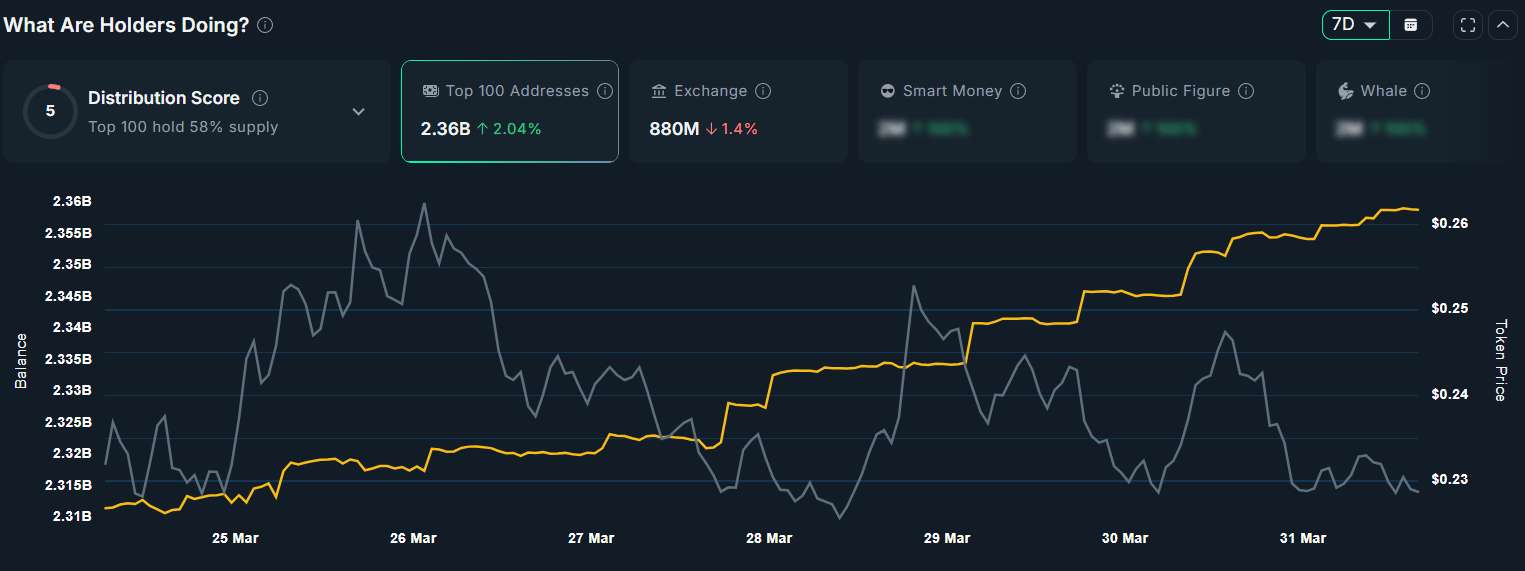
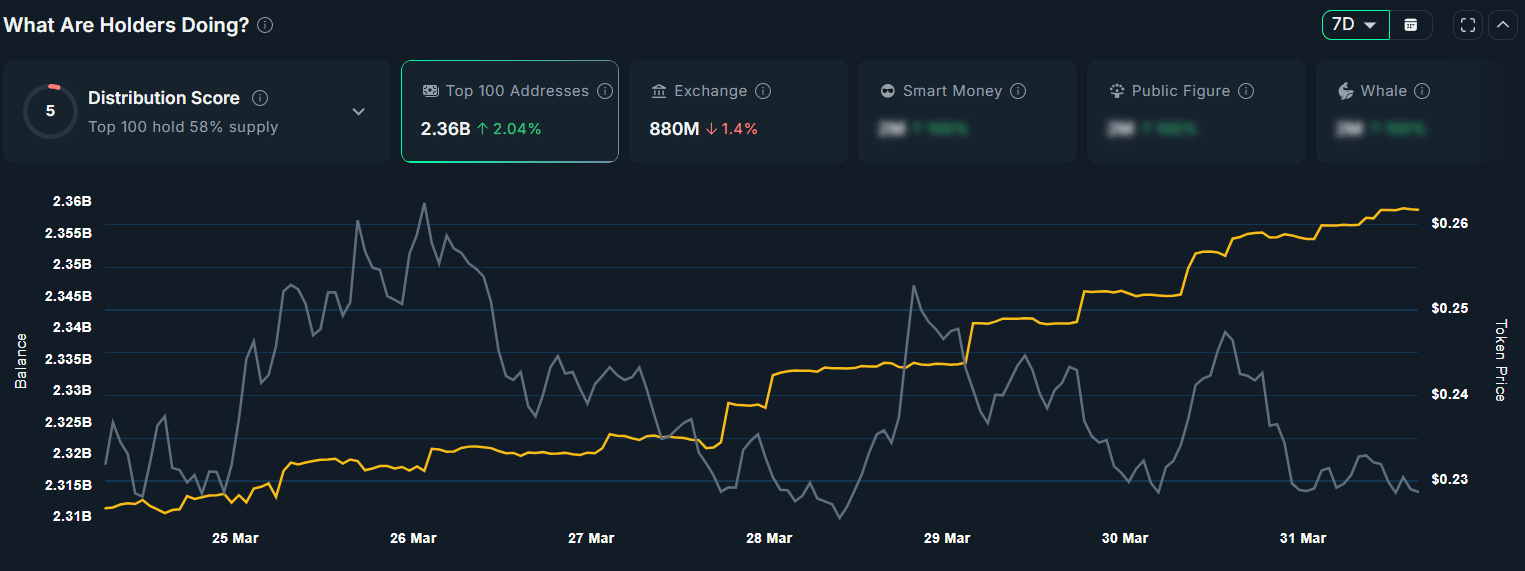
The data shows that the top 100 wallet addresses have increased their holdings by 2.04% over the past week, signaling potential accumulation. Meanwhile, Exchange Reserves have declined by 1.40% during the same period, further suggesting accumulation by long-term holders.
Source: Nansen

Final Summary

  • FET has declined over 8%, and its price action hints at a potential 10% drop if it falls below the $0.2270 level.
  • An expert has outlined a bearish outlook for the asset, eyeing downside targets of $0.20 and $0.1737.


Trending Cryptos

Related Questions

QWhat is the current price of FET and why is it considered a make-or-break level?

AFET is trading near $0.229 at press time, which is considered a make-or-break level because it's a key support level that the asset has consistently held since March 26, 2026. A break below this level could lead to further significant declines.

QAccording to the CoinGlass data, what do the liquidation levels and leveraged positions indicate about market sentiment?

AThe CoinGlass data shows strong trader interest at $0.224 (downside) and $0.238 (upside), with approximately $294K in long-leveraged positions and $794K in short-leveraged positions. This indicates that bears are currently dominating in the short term, while bulls appear exhausted.

QWhat specific price targets did the crypto analyst outline for FET's potential decline?

AThe crypto analyst outlined two specific downside targets for FET: $0.20 and $0.1737, suggesting these are potential levels the asset could drop to if the bearish scenario plays out.

QWhat technical pattern has FET formed on the four-hour chart and what does it suggest?

AFET has formed a descending triangle pattern on the four-hour chart, which is typically considered a bearish pattern and suggests the asset is poised for a potential breakdown if it fails to hold its key support level.

QDespite the bearish short-term outlook, what data from Nansen suggests a potentially bullish long-term perspective?

ANansen data shows that the top 100 wallet addresses have increased their FET holdings by 2.04% over the past week, while Exchange Reserves have declined by 1.40%, suggesting accumulation by long-term holders and indicating a potentially bullish long-term outlook.

Related Reads

Within Strategy's Framework, STRC's Dividend Yield Remains at 12% as Share Price Stays Below Par Value

Michael Saylor, Executive Chairman of Strategy (MSTR), confirmed that the dividend rate for its STRC perpetual preferred shares will remain at 12.00% through August 2026. The rate has increased from 9% at its July 2025 launch to the current high via a "ratchet" mechanism, which permanently raises the rate by 0.5% whenever the share price falls below $95. This mechanism is intended to push the price back toward its $100 par value and support Strategy's "at-the-market" (ATM) program for issuing new shares to fund Bitcoin purchases. However, the mechanism has not worked as intended. STRC shares closed at $89.46 on July 31, remaining about 10-11% below par value despite the record-high dividend. Competition from rival Strive's higher-yielding SATA securities has pressured demand. The persistent discount has forced Strategy to suspend new STRC issuances via its ATM program, limiting this funding channel for Bitcoin acquisitions. STRC's struggles reflect Bitcoin's own volatility, as the preferred shares historically move in tandem. Analysts have warned the ratchet structure carries long-term, one-way risk. A law firm is investigating Strategy's ability to maintain dividend payments if Bitcoin's price stays low. Retail investors own roughly 83% of outstanding STRC shares, a group seen as prone to panic selling during downturns. In response, Strategy has established financial reserves, including a liquidity cushion covering about 26 months of dividend/interest obligations, and a $2 billion share buyback program alongside a Bitcoin monetization framework, though the company emphasized it is not obligated to sell any Bitcoin.

cryptonews.ru37m ago

Within Strategy's Framework, STRC's Dividend Yield Remains at 12% as Share Price Stays Below Par Value

cryptonews.ru37m ago

Analyst: Bitcoin's Price Will Drop to $60k in August, Then Rebound to $70k

Financial analyst Andrey Poroshin has provided a new forecast for Bitcoin's price dynamics in August. Poroshin, an analyst at the Bitbanker exchange, expects the cryptocurrency market to experience a downturn this month, with prices retesting the $60,000 level due to a lack of supportive macroeconomic catalysts. He noted that the recent US Federal Reserve decision to hold interest rates did not significantly impact the market, while inflation remains above the 2% target. Poroshin stated that Bitcoin is ending July under pressure from moderate volatility and a lack of new macroeconomic stimuli, leading to continued market caution. According to his base scenario, Bitcoin will drop to a range of $60,000 to $62,000 before recovering to $70,000. He pointed out that even $70,000 remains below the cost of mining in the US, which has prompted some miners to shift towards AI data center operations. Poroshin cited the winding down of BitMEX's operations as a potential catalyst for a price rebound, suggesting the exit of weaker players often coincides with market reversals and reduced short-term selling pressure. He believes Bitcoin is currently less susceptible to geopolitical shocks, such as the Iran-US conflict, and does not expect significant market changes in August related to the pending CLARITY Act. Looking ahead, Poroshin forecasts that September will bring more active price fluctuations driven by potential Fed rate decisions and possible discussions or approval of the CLARITY Act.

cryptonews.ru37m ago

Analyst: Bitcoin's Price Will Drop to $60k in August, Then Rebound to $70k

cryptonews.ru37m ago

Trading

Spot

Hot Articles

How to Buy FET

Welcome to HTX.com! We've made purchasing FETCH.ai (FET) simple and convenient. Follow our step-by-step guide to embark on your crypto journey.Step 1: Create Your HTX AccountUse your email or phone number to sign up for a free account on HTX. Experience a hassle-free registration journey and unlock all features.Get My AccountStep 2: Go to Buy Crypto and Choose Your Payment MethodCredit/Debit Card: Use your Visa or Mastercard to buy FETCH.ai (FET) instantly.Balance: Use funds from your HTX account balance to trade seamlessly.Third Parties: We've added popular payment methods such as Google Pay and Apple Pay to enhance convenience.P2P: Trade directly with other users on HTX.Over-the-Counter (OTC): We offer tailor-made services and competitive exchange rates for traders.Step 3: Store Your FETCH.ai (FET)After purchasing your FETCH.ai (FET), store it in your HTX account. Alternatively, you can send it elsewhere via blockchain transfer or use it to trade other cryptocurrencies.Step 4: Trade FETCH.ai (FET)Easily trade FETCH.ai (FET) on HTX's spot market. Simply access your account, select your trading pair, execute your trades, and monitor in real-time. We offer a user-friendly experience for both beginners and seasoned traders.

2.9k Total ViewsPublished 2024.03.29Updated 2026.06.02

How to Buy FET

Discussions

Welcome to the HTX Community. Here, you can stay informed about the latest platform developments and gain access to professional market insights. Users' opinions on the price of FET (FET) are presented below.

活动图片












