Odaily invited market analyst Conaldo, Master of Financial Statistics from Columbia University, USA, has focused on quantitative trading of US stocks since university, and gradually expanded to digital assets such as Bitcoin, constructing a systematic quantitative trading model and risk control system in practice; possesses keen data insight into market fluctuations, and is determined to continue深耕 in the professional trading field, pursuing steady returns; will deeply explore changes in BTC technology, macro, and capital aspects every week, review and display practical strategies, and preview major events worth paying attention to in the near future for reference.

Core Summary of Trading Weekly Report:
• The three-week consecutive rebound has entered its final stage, with bullish momentum明显衰竭. Technically, the market is facing key resistance levels, and a short-term pullback to test lower levels may be imminent, perhaps a secondary bottoming行情即将来临.
• Last week's trading strictly followed the established strategy, successfully completing three short-term operations, achieving a cumulative return of 6.15%. The following will详细回顾行情预判, strategy execution, and specific trading process.
I. Bitcoin Last Week's Market Review (12.08~12.14)
1. Review of Core Views and Operation Strategies Last Week:
In last week's journal, the author clearly stated that the currency price would most likely maintain range-bound fluctuations, and accordingly proposed a short-term operation strategy of "selling high on rallies, buying the dip for rebounds". The following is a review and analysis of the strategy for further optimization reference.
1. Review of Market Trend Prediction:
Last week, the author divided the盘面 into three areas, namely $94,200~$91,000~$87,500~$83,500. Then, corresponding plans were formulated based on the direction choice of the行情.
• Core Resistance Levels:
• First Resistance Area: $91,000
• Second Resistance Area: $94,000~$96,500 area
• Third Resistance Area: $98,500~$100,000 area
• Core Support Levels:
• First Support Level: $85,500~$88,000 area
• Second Support Level: $83,500
• Important Support Level: $80,000
2. Review of Operation Strategy:
• Mid-term Strategy: Maintain about 65% mid-term short position仓位.
• Short-term Strategy: Because the行情 chose to fluctuate upwards at the beginning of the week, according to the plan,方案 A of selling high on rallies should be selected:
• Open Position: If the currency price rebounds to the $91,000~$94,200 area and encounters resistance, establish a 15% short position.
• Add Position: If the currency price continues to rebound to near $98,500 and encounters resistance again, add another 15% short position.
• Risk Control: Set stop loss for all short positions above $100,000.
• Close Position: After the rebound ends and the price moves downward, when it falls near the support level and shows resistance, consider partially or fully closing the position to take profits.
2. Last week, three short-term operations were successfully completed according to the plan (Figure 1), achieving a cumulative return of 6.93%. The specific trading details and review are as follows:
Bitcoin 30-minute K-line chart: (Momentum Quantitative Model + Price Difference Trading Model)
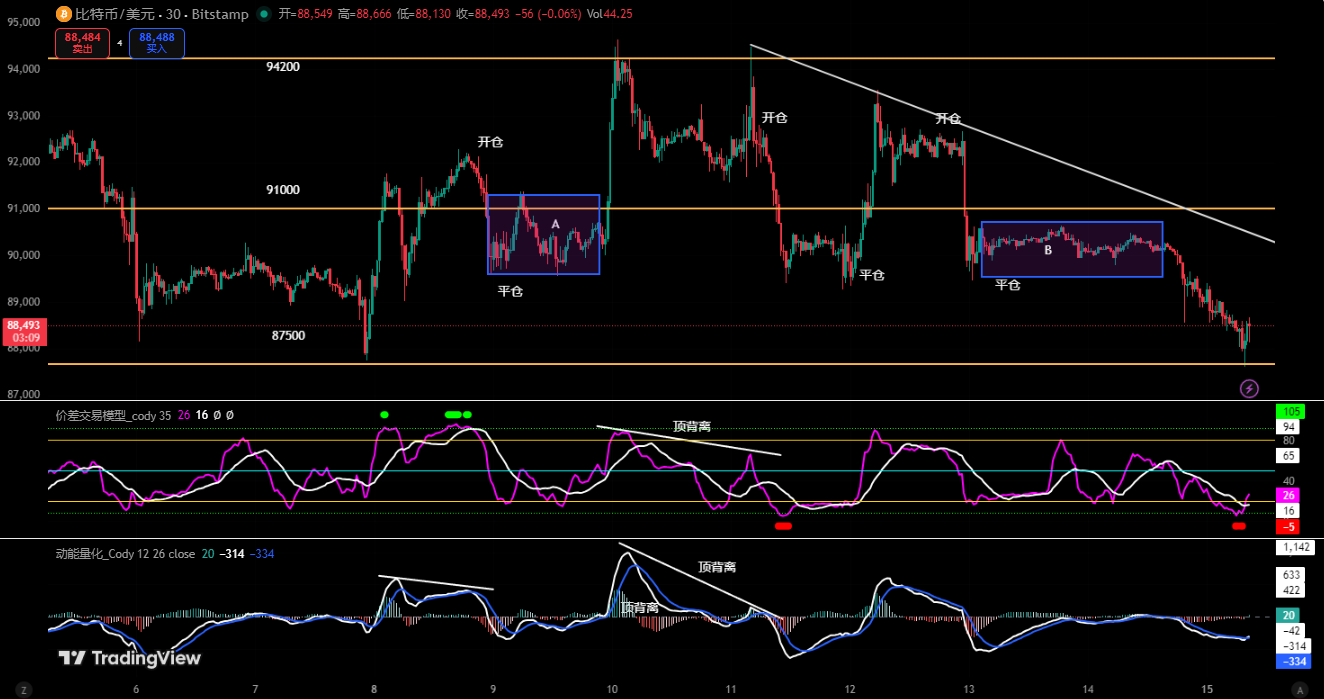
1. Trading Details Summary:
Trade Order Entry Time (UTC+8) Entry Price Position Direction Exit Time (UTC+8) Exit Price Return Rate
First Dec 08 20:30 $91,877 15% Short Dec 09 04:30 $90,477 +1.55%
Second Dec 11 07:30 $92,154 15% Short Dec 12 01:30 $90,083 +2.30%
Third Dec 12 20:00 $92,425 15% Short Dec 13 06:30 $90,349 +2.30%
2. Short-term Trading Review:
• First Trade (Profit 1.55%): Adhering to the idea of "selling high on rallies". After the currency price hit the key point of $94,200 and fell back after encountering resistance,同时触发 the Price Difference Trading Model and the Momentum Quantitative Model发出顶部信号, decisively established a 15% short position at $91,877, and finally took profits near the previous low support. Utilizing the multi-indicator resonance principle to improve trading success rate.
• Second Trade (Profit 2.30%): "Selling on rallies" mode. After the currency price hit $94,200 and fell back after encountering resistance, the K-line showed a "strong top分型" combination, the two models again共振发出信号, so according to the plan, established a 15% short position at $92,154, successfully capturing the subsequent callback wave, and took profits near $90,083.
• Third Trade (Profit 2.30%): "Selling on rallies" mode. After the currency price hit $94,200 and fell back after encountering resistance, it showed a narrow range fluctuation trend, the price was suppressed by the short-term downward trend line, and the buying momentum gradually衰竭. When the two models共振发出信号, decisively opened a short position at $92,425, position 15%. When it fell to the support level below and showed resistance signals, actively took profits.
3. Key Decision Node Analysis:
• The前瞻性判断 of the trend provided key basis for short-term trading decisions and risk control, and also greatly improved the winning rate of trades.
• Capturing technical reversal signals at key resistance levels, using the multi-model resonance principle to enhance their reliability, and locking in profits near support levels.
3. Review of Bitcoin Core Data Last Week:
• Opening Price: $90,406
• Lowest Price: $87,607 (Sunday)
• Highest Price: $94,652 (Tuesday)
• Closing Price: $88,164
• Price Change: Weekly decrease of 2.48%, maximum amplitude of 8.04%
• Turnover: $9.859 billion
• Trend: Rose then fell, turning into fluctuating decline, weekly K-line closed with an upper shadow line阴 K-line
4. Review of Actual Market Movement Last Week:
Last week, Bitcoin's movement showed a typical pattern of "rising on low volume then falling back and turning into decline". The whole week finally closed with a阴 K-line with an upper shadow line, closing down 2.48%, but the amplitude reached 8.04%, indicating fierce多空争夺. Specifically, the行情 continued to rebound at the beginning of the week, reached the weekly high of $94,652 in the middle of the week, then turned weak under pressure, and entered a fluctuating decline rhythm. In the second half of the week, the行情 turned into a fluctuating decline trend, the price gradually探至 near $87,607, closing近似 at the lowest price,最终 the weekly line formed a阴 K-line with a long upper shadow line, closing down 2.48%. It is worth emphasizing that the entire week's price movement轨迹, perfectly fit within the fluctuation framework划定 by the author last week. And the mid-week high of $94,652, differed from the previously locked upper resistance of $94,200 by only $452, an error of less than 0.5%. This once again verifies the effectiveness of the author's technical positioning of key supply and demand areas (resistance and support), and also provides a strong basis for the continuation of the "high抛低吸 within the structure" tactic.
II. Systematic Technical Analysis: Comprehensive Research and Judgment Based on Multiple Models and Dimensions
Combining last week's market operation, the author will conduct an in-depth analysis of the evolution of Bitcoin's internal structure using a multi-dimensional analysis model.
Bitcoin Weekly K-line Chart: (Momentum Quantitative Model + Sentiment Quantitative Model)
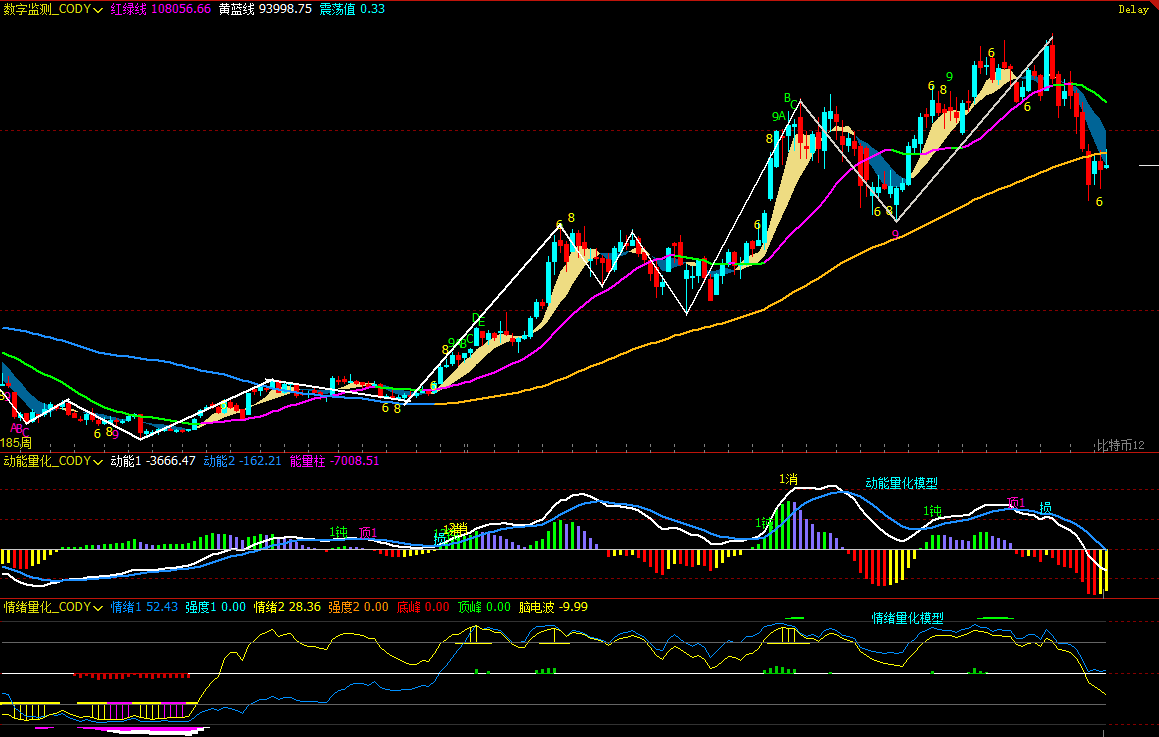
Figure 2
1. As shown in (Figure 2), analysis from the weekly chart:
• Momentum Quantitative Model: After last week's market movement, the two momentum lines continued their downward trend and both fell below the zero axis. On the weekly level, this is usually regarded as a technical signal that the bearish power is continuously strengthening and the market is turning bearish.
Momentum Quantitative Model Indicates: Currency price decline index: High
• Sentiment Quantitative Model: Blue sentiment line value 52.43, intensity zero; yellow sentiment line value 28.36, intensity zero, peak value is 0.
Sentiment Quantitative Model Indicates: Currency price pressure and support index: Neutral
• Digital Monitoring Model: No digital signals shown.
The above data indicates: Bitcoin is in a downward trend, and has entered a bear market on the weekly level.
Bitcoin Daily K-line Chart:
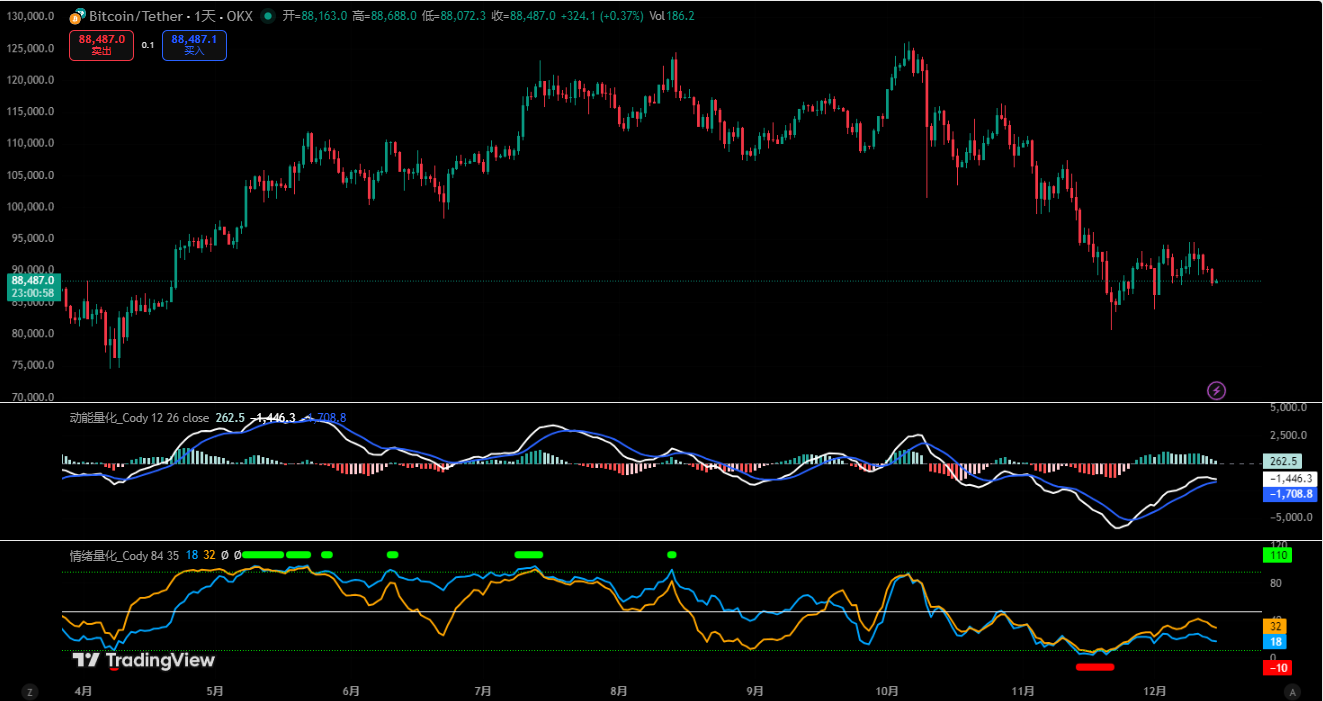
Figure 3
2. As shown in (Figure 3), analysis from the daily chart:
• Momentum Quantitative Model: After a week of rebound, the two momentum lines continued to rise below the zero axis, gradually approaching the zero axis. However, momentum line 1 began to flatten, gradually approaching line 2, and the energy柱较前几日逐渐缩短.
Momentum Quantitative Model Indicates: The momentum of the bullish rebound is gradually衰竭, and the two momentum lines are about to "dead cross".
• Sentiment Quantitative Model: After last week's daily close, blue sentiment line value 18, intensity zero; yellow sentiment line value 32, intensity zero.
Sentiment Quantitative Model Indicates: Pressure and support index: Neutral
The above data suggests: The daily level is in a bear market, and the oversold rebound行情 has entered its final stage.
III. This Week's Market Prediction (12.15~12.21)
1. After three consecutive weeks of oversold rebound (21 days is a变盘时间窗口), the bullish momentum has shown衰竭, and the market faces a direction choice. Currently, the currency price has encountered resistance and fallen back at the key resistance area. It is expected that this week's trend will be mainly fluctuating adjustments. Focus on observing the gain or loss of the $87,500~$89,000 area; if effectively broken below, the行情 may start a secondary bottoming.
2. Core Resistance Levels:
• First Resistance Area: $92,500~$94,500 area
• Second Resistance Area: $96,500~$98,500 area
• Important Resistance Area: $100,000
• Core Support Levels:
<极> • First Support Level: $87,500~$89,000 area• Second Support Level: $80,000~$83,500 area
• Important Support Level: $74,500~$76,000 area.
IV. This Week's Operation Strategy (Excluding Sudden News Impact) (12.15~12.21)
1. Mid-term Strategy: Maintain about 65% mid-term position (short).
2. Short-term Strategy: Use 30% of the position, set stop loss points, and look for "price difference" opportunities based on support and resistance levels. (Use 60 minutes/240 minutes as the operation cycle).
3. The author judges that this week will be mainly fluctuating adjustments, and the $87,500~$89,000 area will become an important watershed. For the gain or loss of this area, short-term operations will execute the following two sets of plans:
• Plan A: If the support in this area is effective:
• Open Position: If the currency price rebounds to the $92,000~$94,200 area and encounters resistance, establish a 30% short position.
• Risk Control: Set stop loss for short positions above $95,000.
• Close Position: When the currency price falls to the $87,500~$89,000 area and shows resistance, close all short positions to take profits.
• Plan B: If this area is effectively broken below:
• Open Position: If the currency price breaks below this area and is confirmed, establish a 30% short position.
• Risk Control: Set stop loss above $89,000.
• Close Position: When the currency price探至 the $80,000~$83,500 area and shows resistance, close all short positions to take profits.
V. Special Tips
1. When opening a position: Immediately set the initial stop loss level.
2. When profit reaches 1%: Move the stop loss to the entry cost price (break-even point) to ensure capital safety.
3. When profit reaches 2%: Move the stop loss to the position of 1% profit.
4. Continuous tracking: Thereafter, for every additional 1% profit the currency price makes, move the stop loss level同步 by 1%, dynamically protecting and locking in existing profits.
(Note: The above 1% profit trigger threshold can be flexibly adjusted by investors according to their own risk preferences and标的 volatility.)
VI. This Week's Macro Outlook and Key Events (12.15~12.21)
1. Fed Officials Dense Speeches
Multiple core and potential voters will speak about the economic outlook, their wording will affect the market's re-assessment of the "pace and sustainability of interest rate cuts", especially the guidance on long-term interest rate expectations.
2. Inflation Data Becomes Key Turning Point
The US November CPI and core CPI data released on Thursday will be the core variables determining the direction of the US dollar and interest rates.
· If CPI is lower than expected (currently about 3%, still above the 2% target), it will further verify the rationality of the interest rate cut cycle, the US dollar may be under pressure, and risk assets may get breathing space;
· If inflation rises again, it may weaken market confidence in持续宽松,推动 the US dollar to rebound and suppress the performance of high-valuation assets.
3. Employment and Inflation Expectation Indicators Supplementary Verification
Initial jobless claims and the University of Michigan consumer inflation expectation data will, from the "actual and expected" two levels, test whether the downward trend of inflation has sustainability.
Financial markets are changing rapidly, all market analysis and trading strategies need to be dynamically adjusted. All views, analysis models and operation strategies involved in this article are derived from personal technical analysis, and are only for personal trading log use, do not constitute any investment advice or operation basis. The market has risks, investment needs to be cautious, DYOR.