On June 3, USD/JPY touched 160.44 intraday, a new high since July 2024. On the same day, the Nikkei 225 index broke through 68,000 points for the first time, reaching a high of 68,634.74 points. These two figures together immediately triggered a familiar market narrative: 'The carry trade is about to collapse, August 2024 will repeat.'
This narrative is half right. The other half tells a completely opposite story according to the data.
Shorts Not Retreating, But Adding Instead
The most direct measure of the crowdedness of yen carry trades is the weekly Commitments of Traders (COT) report published by the US Commodity Futures Trading Commission (CFTC). It records the net long or net short positions of speculative traders in the yen futures market.
According to the CFTC report for the week ending May 26, the net short yen futures positions held by non-commercial accounts reached 114,667 contracts—112,993 long positions versus 227,660 short positions. This represented a further increase of 27,152 contracts in net short positions compared to the previous week.
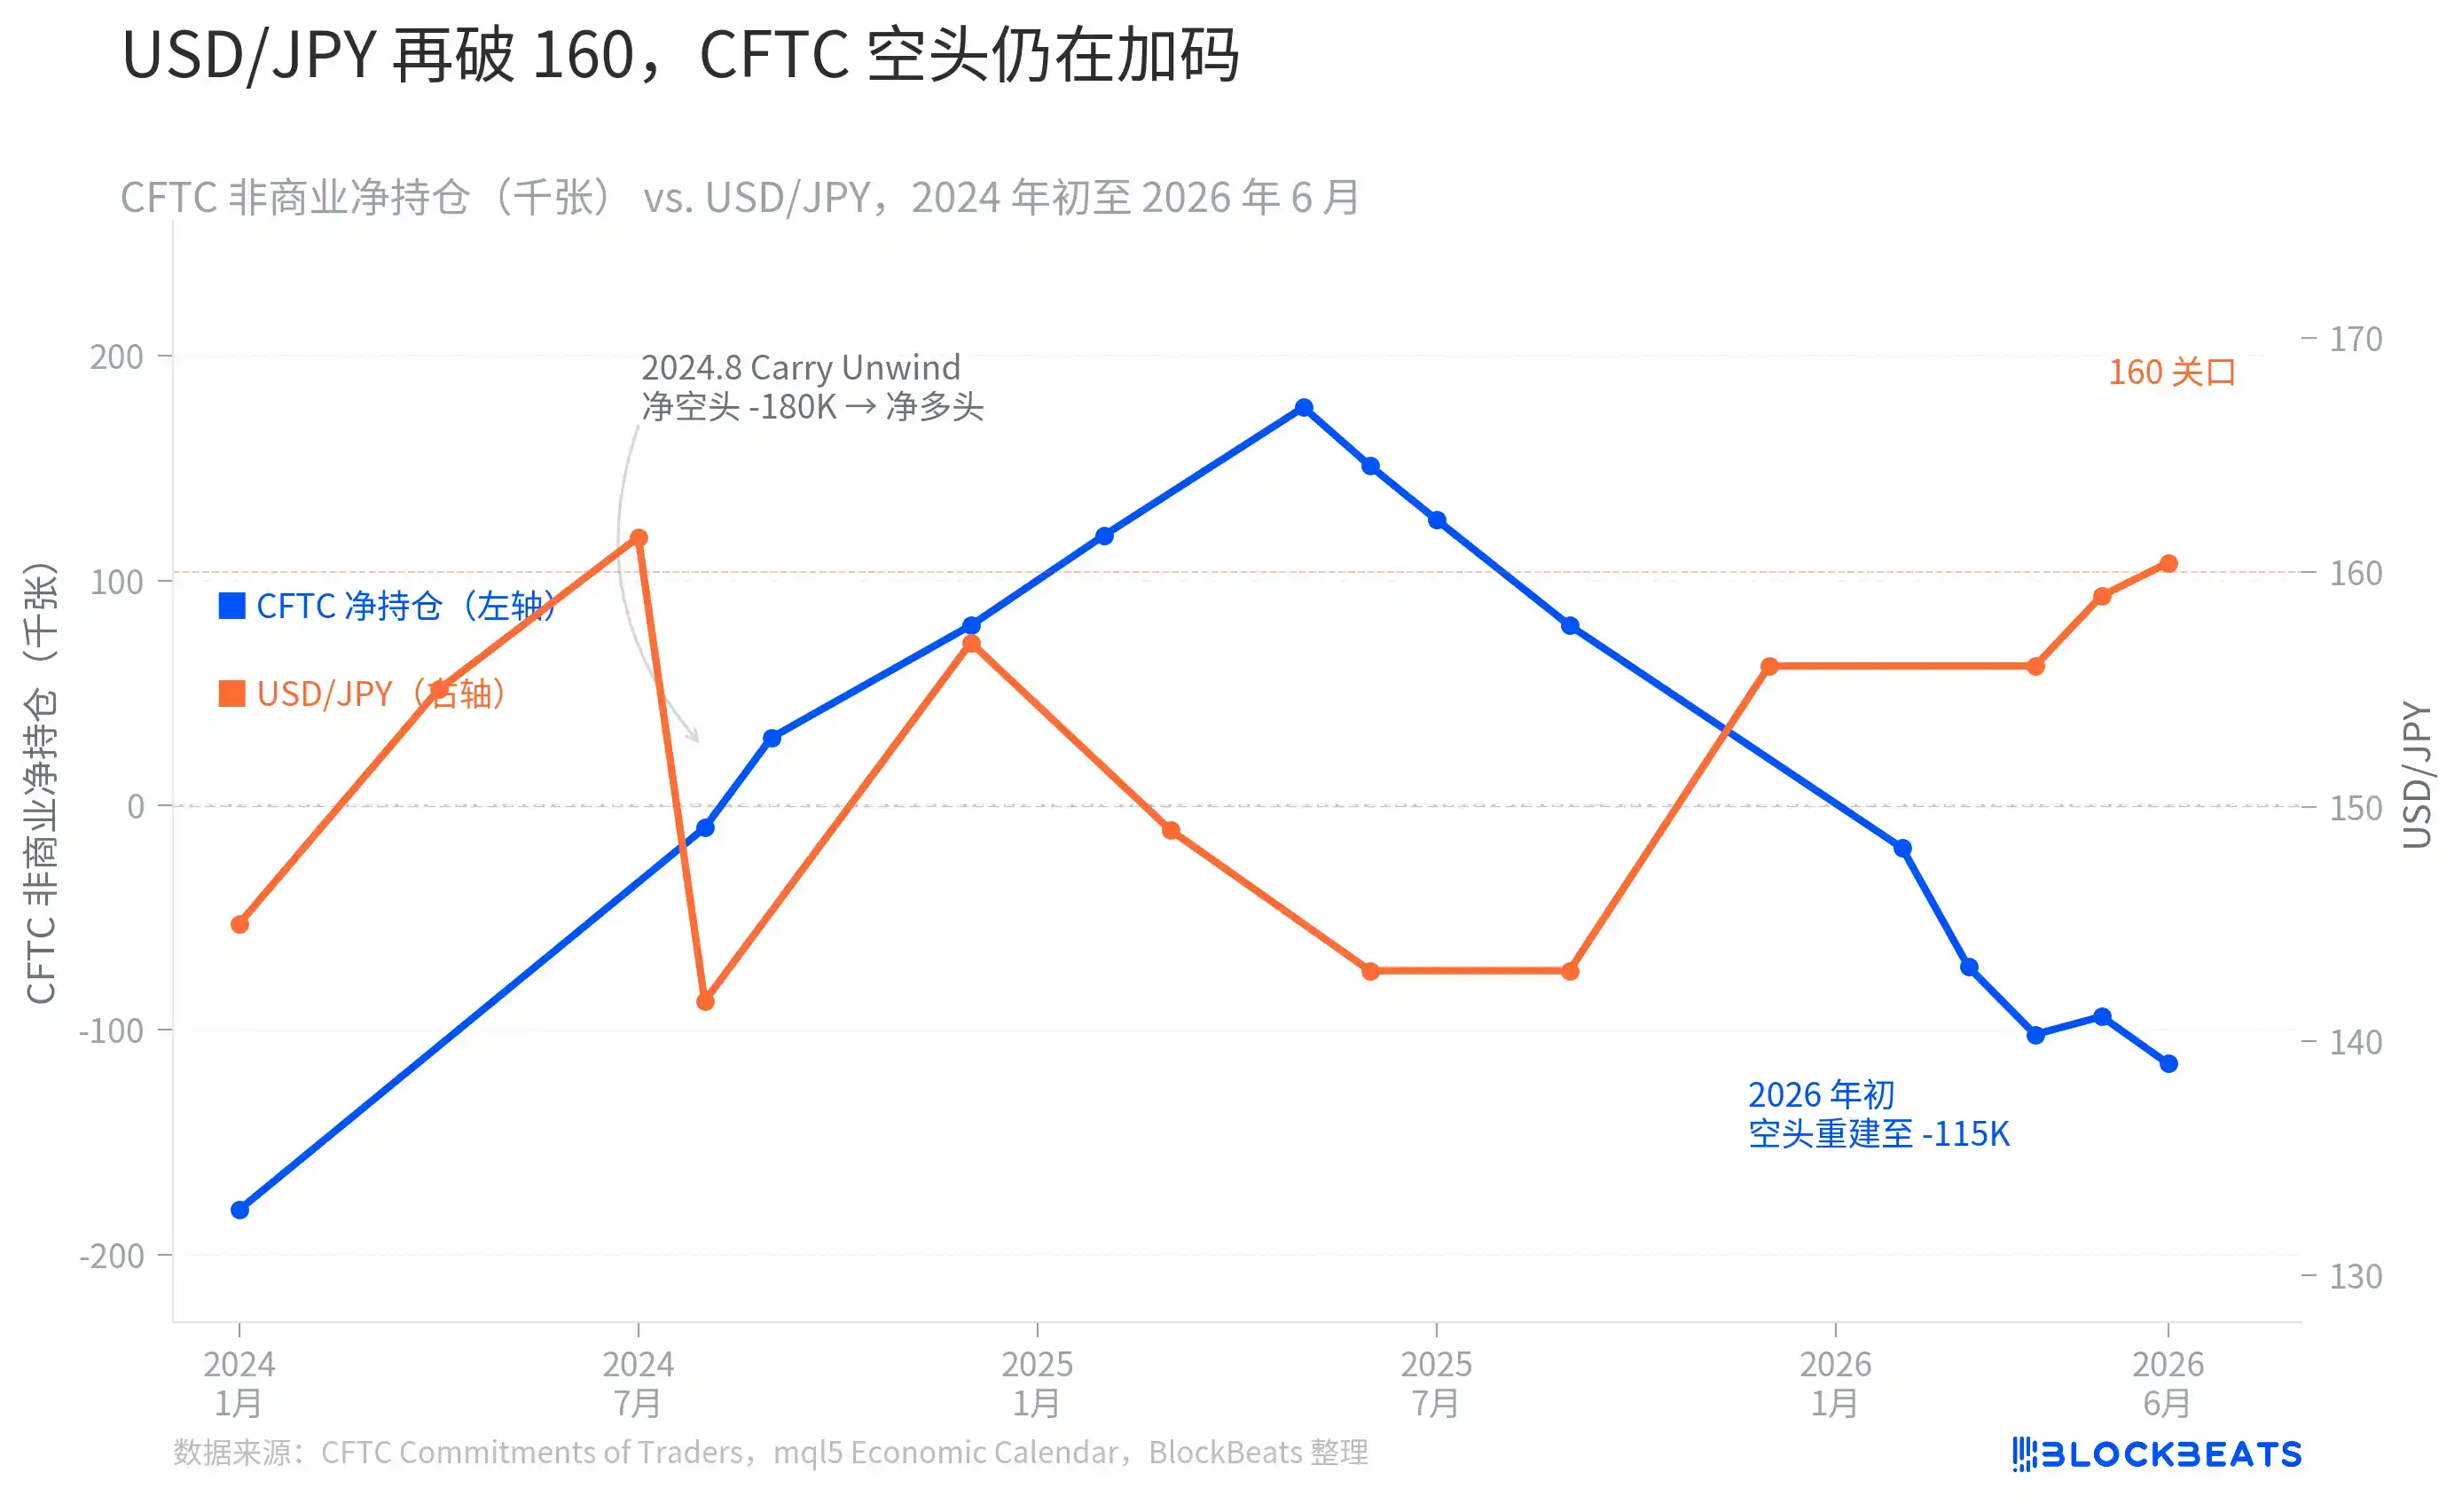
The chart reveals a somewhat counterintuitive trend. In July 2024, when USD/JPY approached highs around 161, the CFTC net short was near the historical extreme zone of about -180,000 contracts. Subsequently, in early August, a surprise rate hike by the Bank of Japan (BOJ) combined with a much-weaker-than-expected US non-farm payrolls report forced a massive unwinding of yen shorts within weeks. The net short position shrank sharply from about -180,000 contracts, even reversing to a net long position exceeding +177,000 contracts by Q2 2025—a systemic carry trade squeeze indeed occurred during that period.
But the subsequent trajectory went completely against the 'squeeze narrative.' Starting from late 2025, yen net short positions began accumulating again, turning negative in February 2026 and expanding rapidly to -102,000 contracts by April. As of May 26, the net short position had reached -114,667 contracts. When USD/JPY returned to around 160, global speculative capital wasn't fleeing, but rather continuing to add to their positions.
This means that if the BOJ sends a more hawkish signal at its July meeting, or if US economic data unexpectedly weakens again, this batch of -114,667 net short positions will face passive unwinding pressure highly similar to that of August 2024. Japan's Ministry of Finance is also aware of this—from April 28 to May 27, the MOF used a record 11.7349 trillion yen to buy yen and sell foreign currency, attempting to suppress the shorts.
Largest Single-Round Intervention Fails to Hold 160
Japan's Ministry of Finance has a history of foreign exchange intervention dating back to 1998. In the autumn of 2022, when the yen fell near 152, the MOF conducted its first 'yen-buying' operation since 1998: spending 2.84 trillion yen in September and adding another 6.34 trillion yen in October, totaling about 9.18 trillion yen. That round briefly pushed USD/JPY down from 152 to around 127, but the effect lasted only a few months.
In the spring of 2024, as USD/JPY again approached and briefly broke through 160, the MOF intervened with about 9.80 trillion yen, which was the largest single-round operation since 2022 at that time, and also 'the first confirmed buying intervention since 2022.'
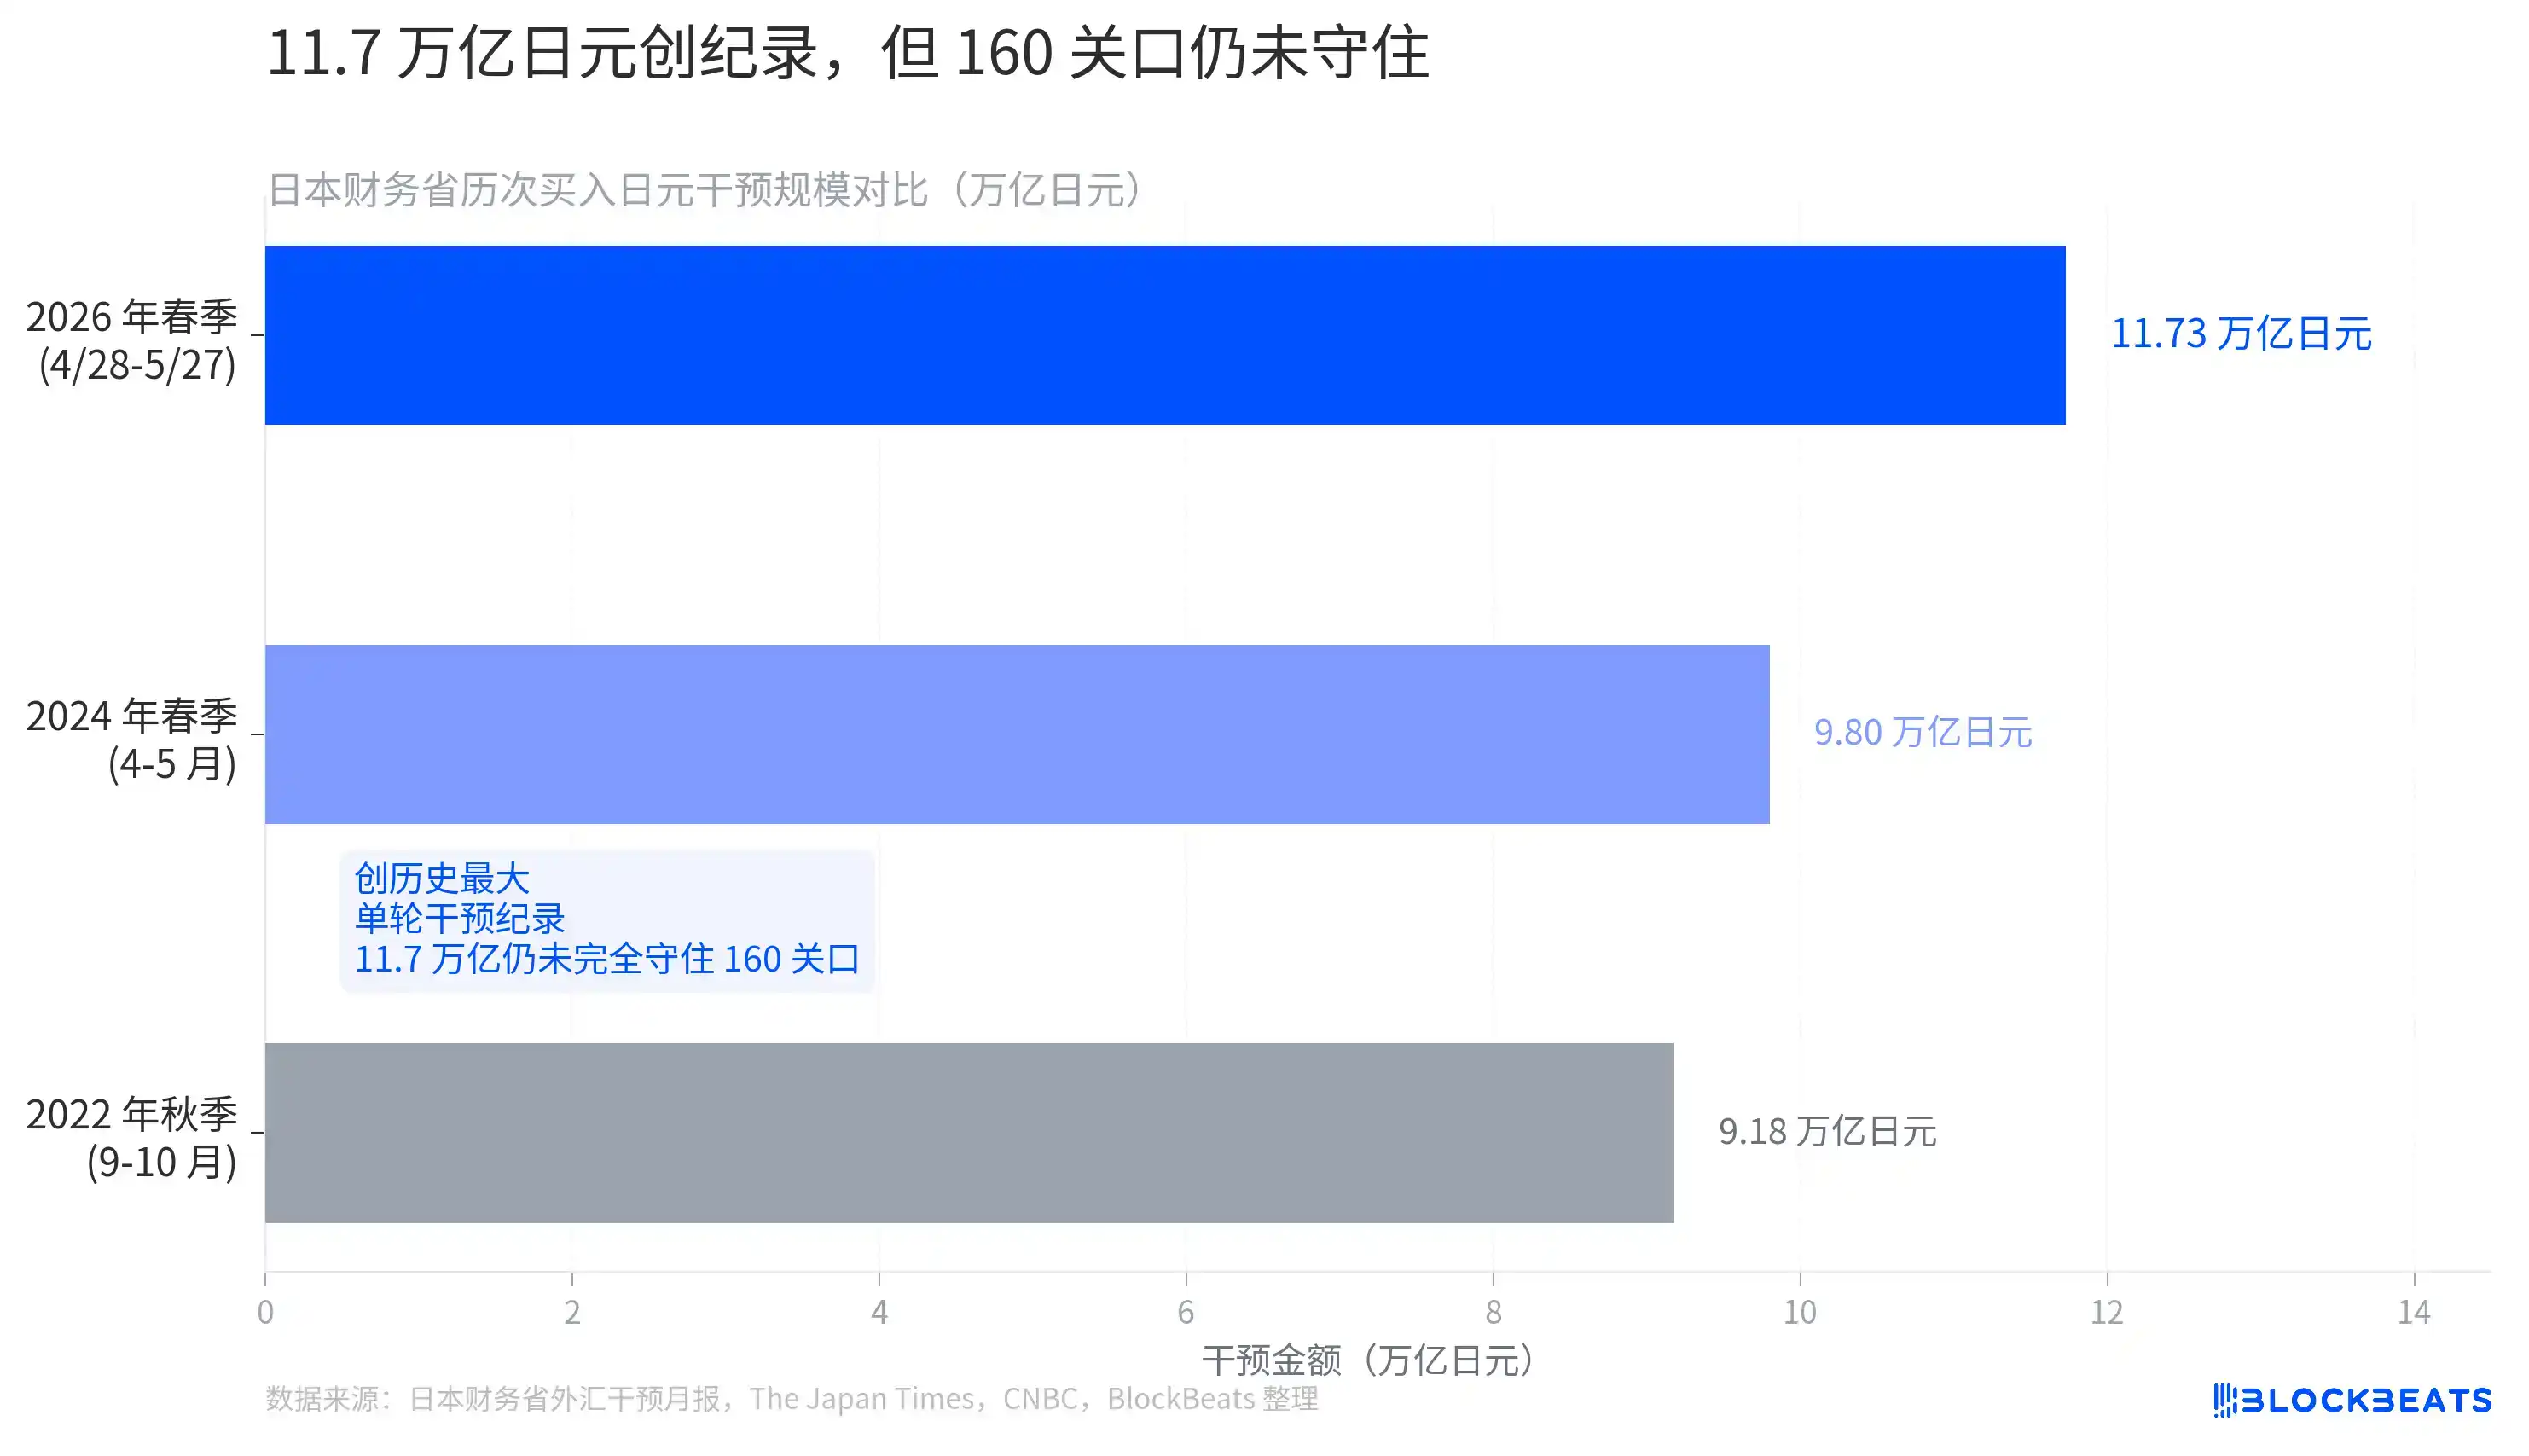
According to monthly intervention data released by Japan's Ministry of Finance on May 29, 2026, the operation scale from April 28 to May 27 was 11.7349 trillion yen (approximately 73.6 billion USD), making it the largest single-round intervention on record. It exceeded the total intervention amount for the entire year of 2022 and was nearly 2 trillion yen more than the spring 2024 intervention.
However, less than a week after the MOF disclosed these figures, USD/JPY still climbed back above the 160 level. The largest-ever intervention failed to completely hold this psychological barrier.
Foreign Funds Buying Japan Stocks Chase AI, Not Safe-Haven Flows from Carry Unwinding
If carry trades remain crowded, why is the Nikkei 225 still hitting new highs?
According to Reuters citing data from Japan Exchange Group (JPX), overseas investors had been net buyers of Japanese stocks for the 8th consecutive week as of the week ending May 23, with a weekly net purchase of 1.08 trillion yen. The cumulative net purchase amount for the year to date is close to 11.7 trillion yen.
During the same period in 2025, foreign investors' cumulative net purchase was only 742.1 billion yen. The 2026 figure is 15.8 times that amount.
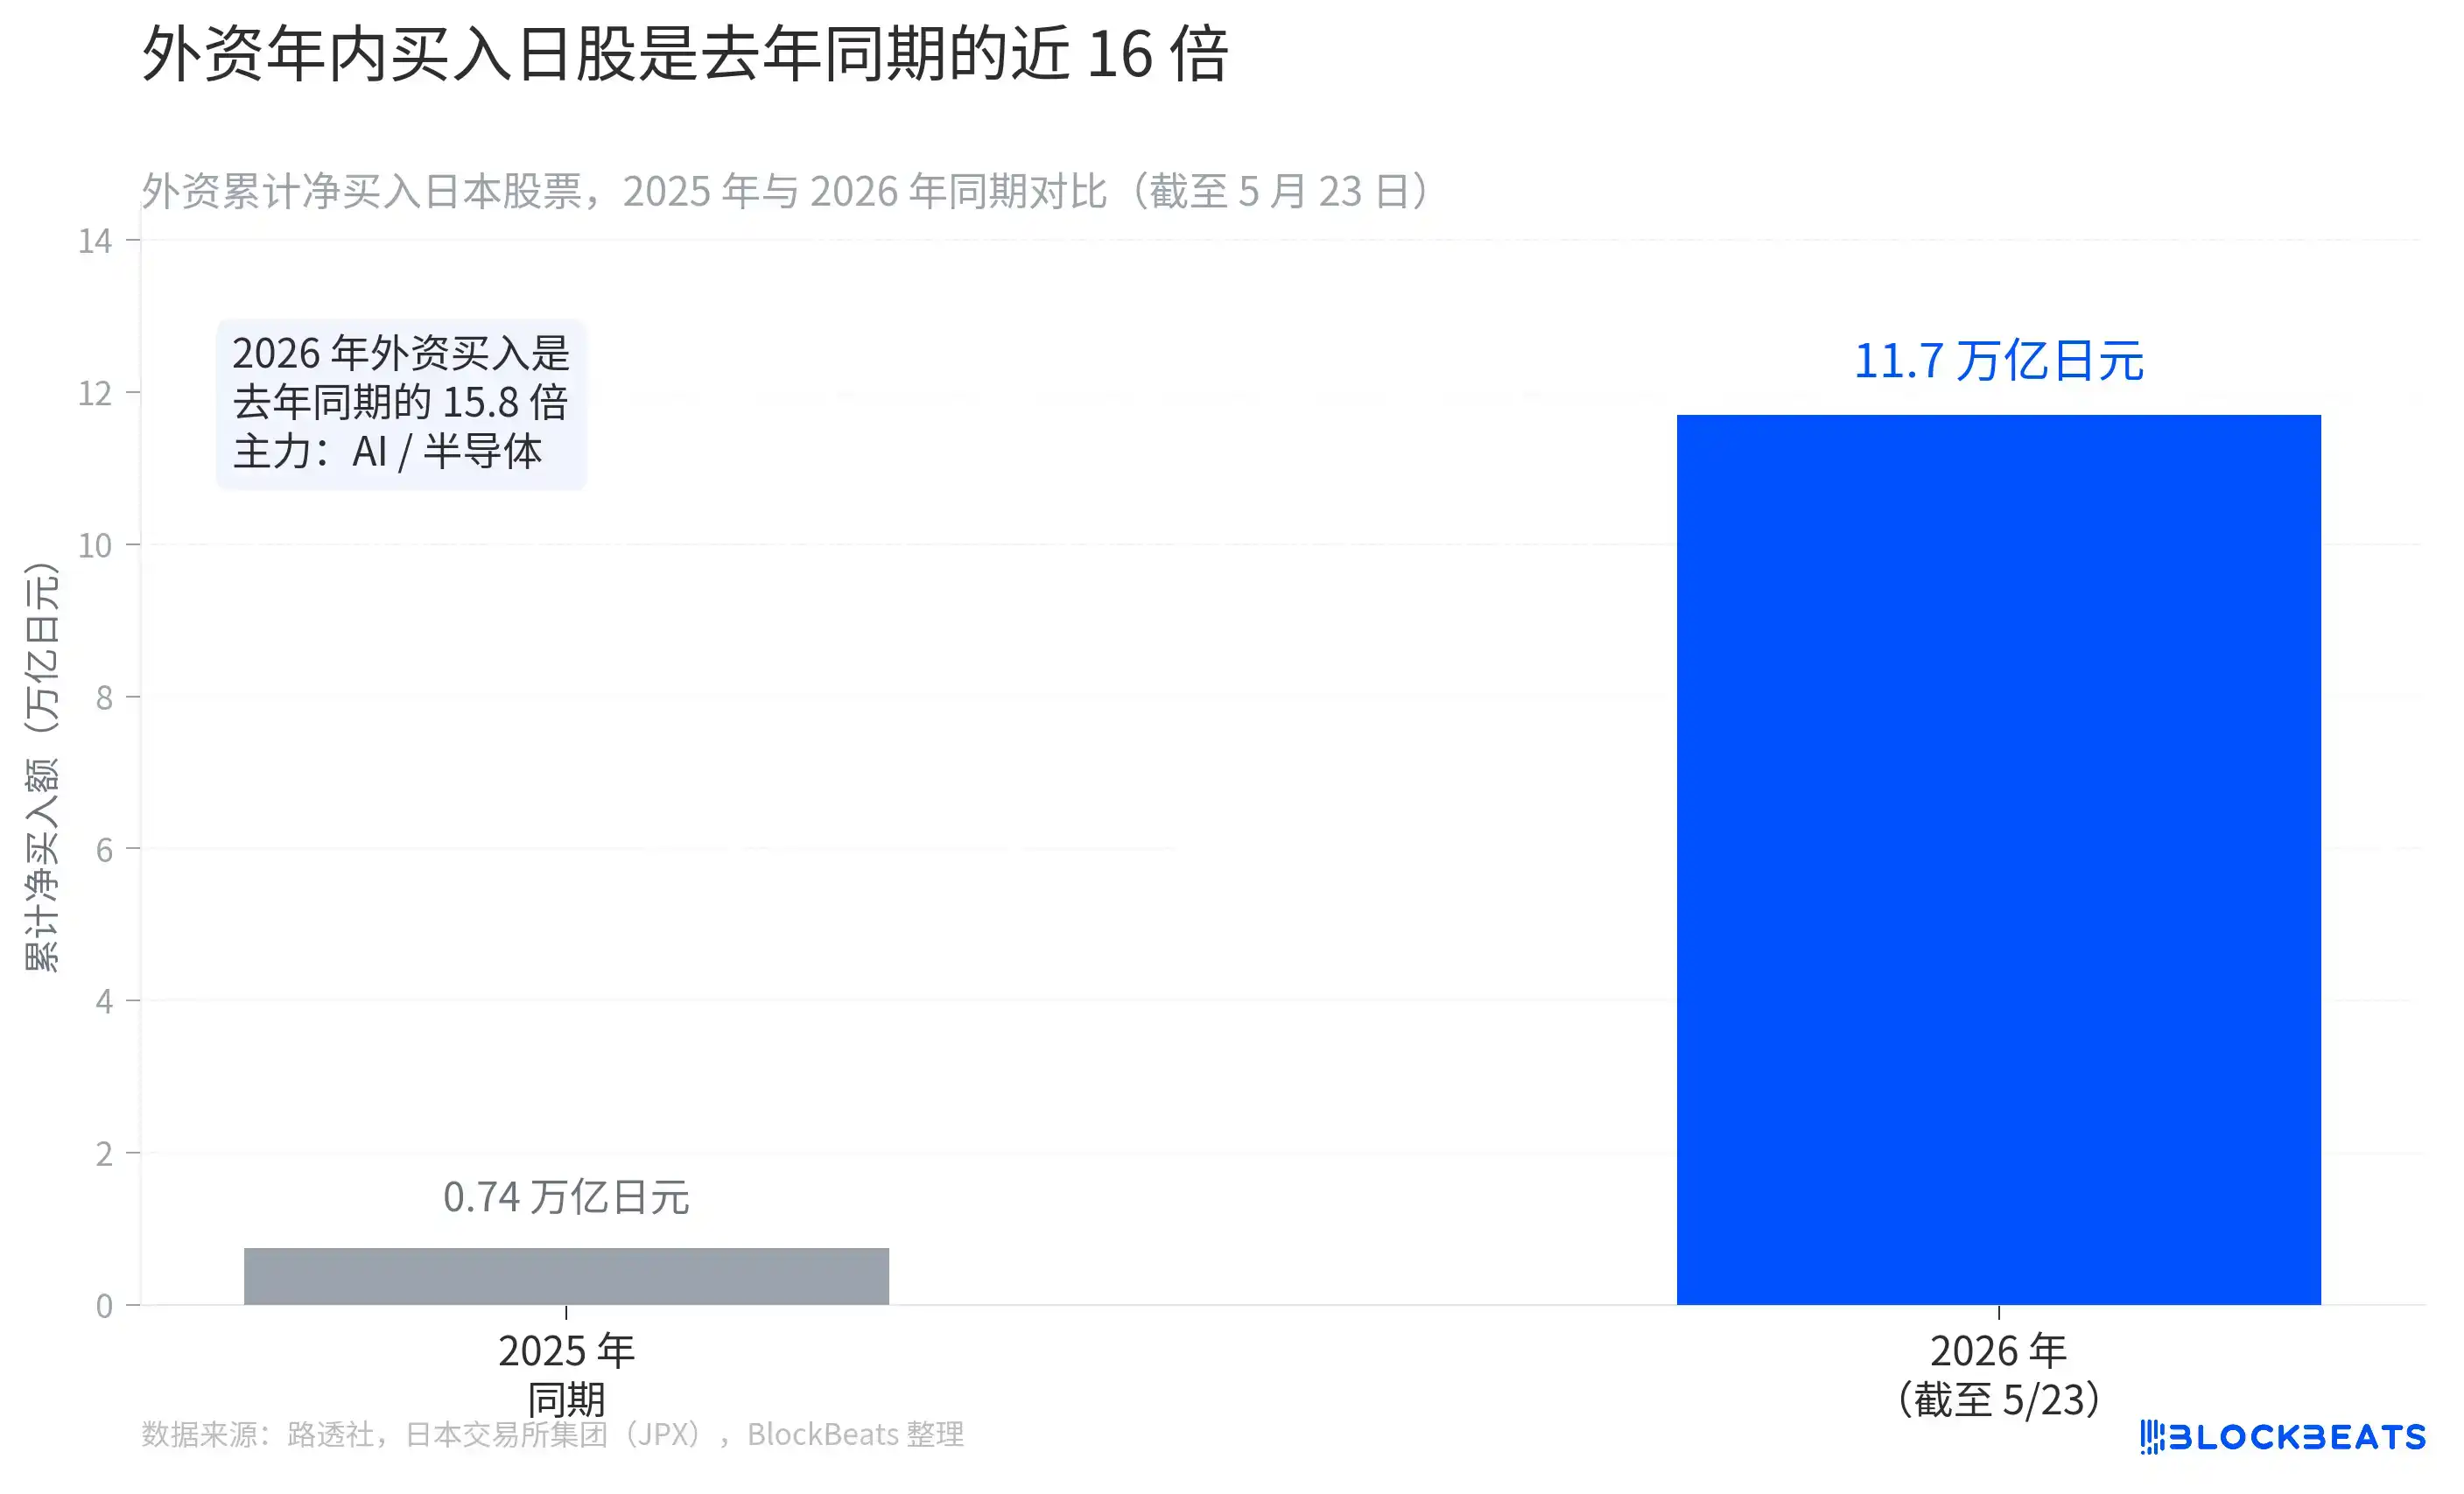
The destination of these funds is highly concentrated. Among the top-performing individual stocks during the same period, AI investment platform SoftBank Group rose 17.62% for the week, while chip designer Socionext gained 12.26%. The Reuters report directly explained the buying impetus: Nvidia's earnings outlook boosted prospects for AI and semiconductor demand, with foreign capital chasing this theme via the Japanese market.
This logic is completely different from the 'carry unwind triggers selling' logic of August 2024. Back then, it was forced de-risking and indiscriminate selling, with capital exiting the Japanese market. The foreign net buying in 2026 is an active choice to enter the Japanese market to pursue the AI reflation trade. Their driving mechanisms differ, and their implications for the Nikkei index are also different.
Rate Hikes Not Suppressing Stocks, But This Relationship Is Becoming More Fragile
Another counterintuitive aspect of the Nikkei 225 is its continued rise against the backdrop of consecutive BOJ rate hikes.
According to the Bank of Japan's policy decision announcements over the past two years, the rate hike path is as follows: March 2024 - ended negative interest rate policy, raising the policy rate from -0.1% to 0.1%; July 2024 - hiked again to 0.25%; January 2025 - hiked to 0.5%; December 2025 - hiked to 0.75%, the highest level since 1995. The April 2026 meeting maintained the rate at 0.75%, but passed by a 6-3 vote—three board members (Hajime Takata, Naoki Tamura, Junko Nakagawa) explicitly advocated for a hike to 1.0%.
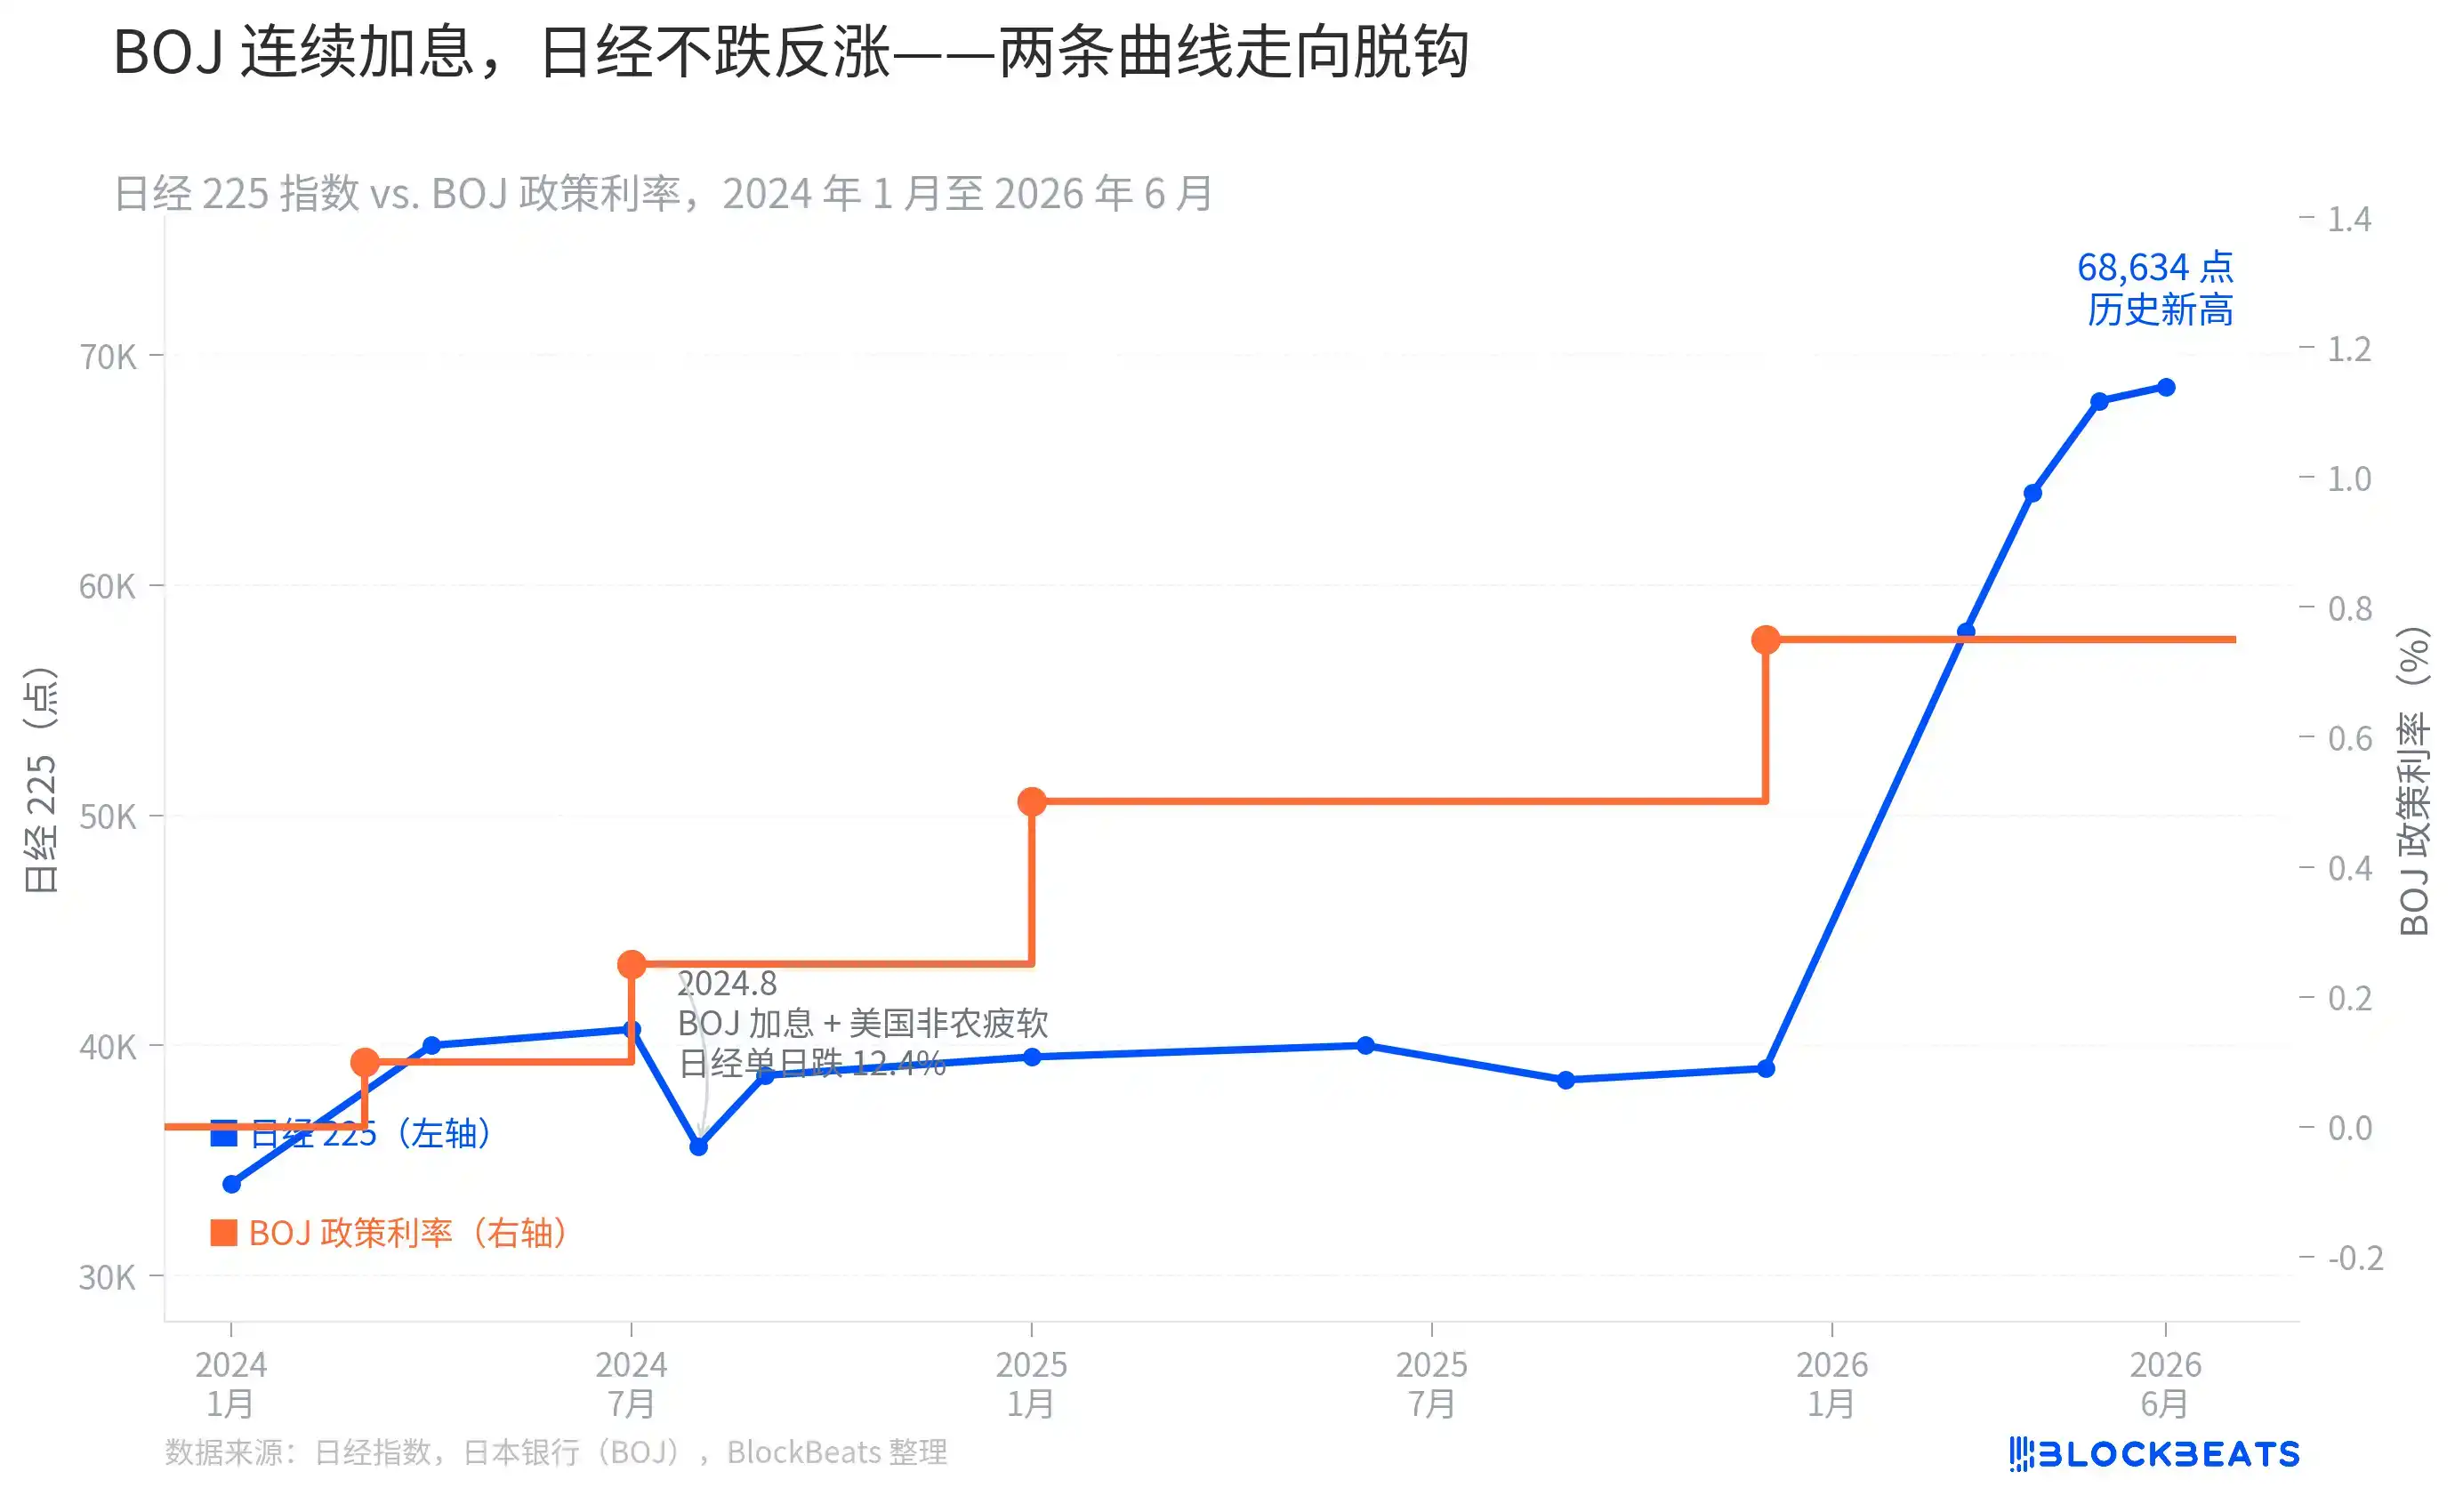
The chart clearly shows that the correlation between rate hike events and Japanese stock movements has been completely different across stages. The July 2024 rate hike triggered a historic crash in the Nikkei 225, with a single-day drop of 12.4%—that was because the BOJ hike and weak US jobs data coincided, directly igniting the carry unwind. However, the two rate hikes in January and December 2025 were accompanied by the Nikkei 225 climbing from around 40,000 points all the way to the current new high of 68,634 points.
The reason behind this is not complicated: when the logic driving foreign buying is chasing the AI reflation trade, rather than relying on low yen interest rate funding costs, the BOJ's modest rate hikes have a quite limited impact on this portion of capital. Of course, this relationship is not immutable—if the BOJ indeed pushes the rate to 1.0% at its July meeting, while the US dollar weakens due to other factors, sharply increasing the funding cost for carry trades, the trajectories of these two curves may recouple at that point.
Putting the three charts together provides a relatively complete cognitive framework: yen short positions remain crowded, the MOF's historically largest intervention failed to hold 160, but the driver of the Japanese stock market's new highs is the AI-driven foreign capital inflow—all three statements can be true simultaneously, they are not mutually contradictory, and none alone can predict what happens next.