Tracking Digital Asset Markets Beyond Crypto-Native Venues

insights.glassnodePublished on 2026-06-03Last updated on 2026-06-03

Abstract

Glassnode has expanded its platform with new metrics for tracking digital asset markets beyond crypto-native venues, focusing on US spot ETFs and US Digital Asset Treasury (DAT) companies. These additions allow users to access daily price and trading volume data for relevant ETFs and publicly listed treasury firms tied to specific crypto assets. The DAT metrics enable comparisons between equity behavior and underlying crypto assets, helping identify stocks that act as strong proxies versus those with more idiosyncratic profiles. ETF volume data offers insights into liquidity, participation, and institutional flows, revealing how much trading activity occurs through traditional finance channels compared to crypto-native markets. These tools provide a unified view of digital asset exposure across spot markets, ETFs, and listed vehicles, enhancing analysis for institutional and traditional finance integration.

Glassnode has continued to expand its Traditional Finance coverage in Studio, helping users connect crypto-native market activity with the growing universe of listed instruments tied to digital assets.

This expansion reflects the growing role of ETFs, treasury companies, and other listed vehicles in digital asset market analysis, as institutional exposure increasingly moves beyond spot markets.

Two new metric families are now live:

  • US Spot ETF Price & Volume
  • US Digital Asset Treasury Company Price & Volume.

For each selected crypto asset, users can now retrieve daily price and traded volume across the relevant US spot ETFs and publicly listed treasury companies, with one time series per ticker. This gives investors a more complete view of how crypto exposure is being expressed through traditional equity markets.

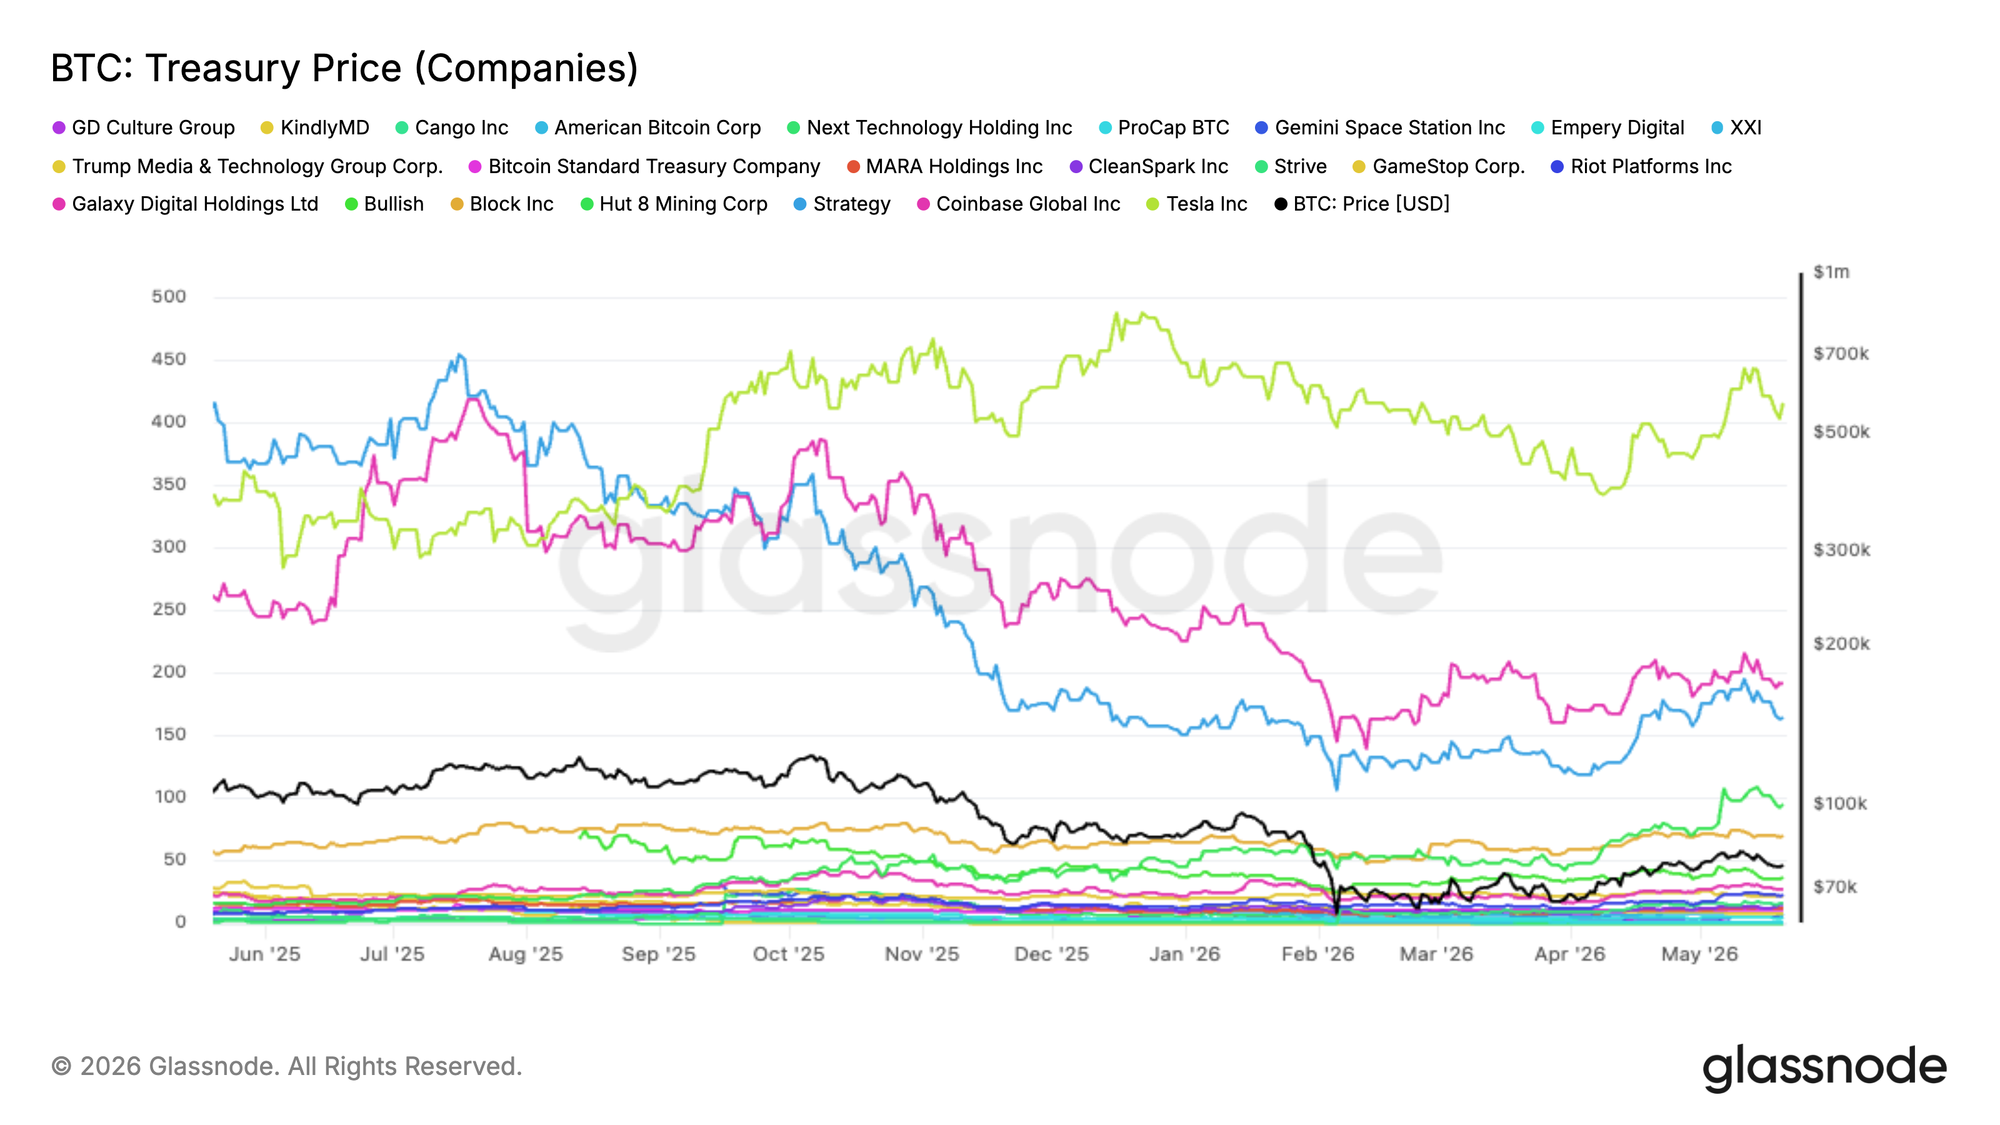
DATs: Analyzing Equity Behavior Relative to Crypto

For US Digital Asset Treasury (DAT) companies, the data makes it easier to compare how listed equities behave relative to the underlying crypto asset and assess which names exhibit stronger or weaker equity beta to crypto market movements.

For example, users can compare BTC performance against companies holding BTC on their balance sheet to identify which stocks behave more like direct crypto proxies, and which names trade with a more idiosyncratic equity profile.

View live chart

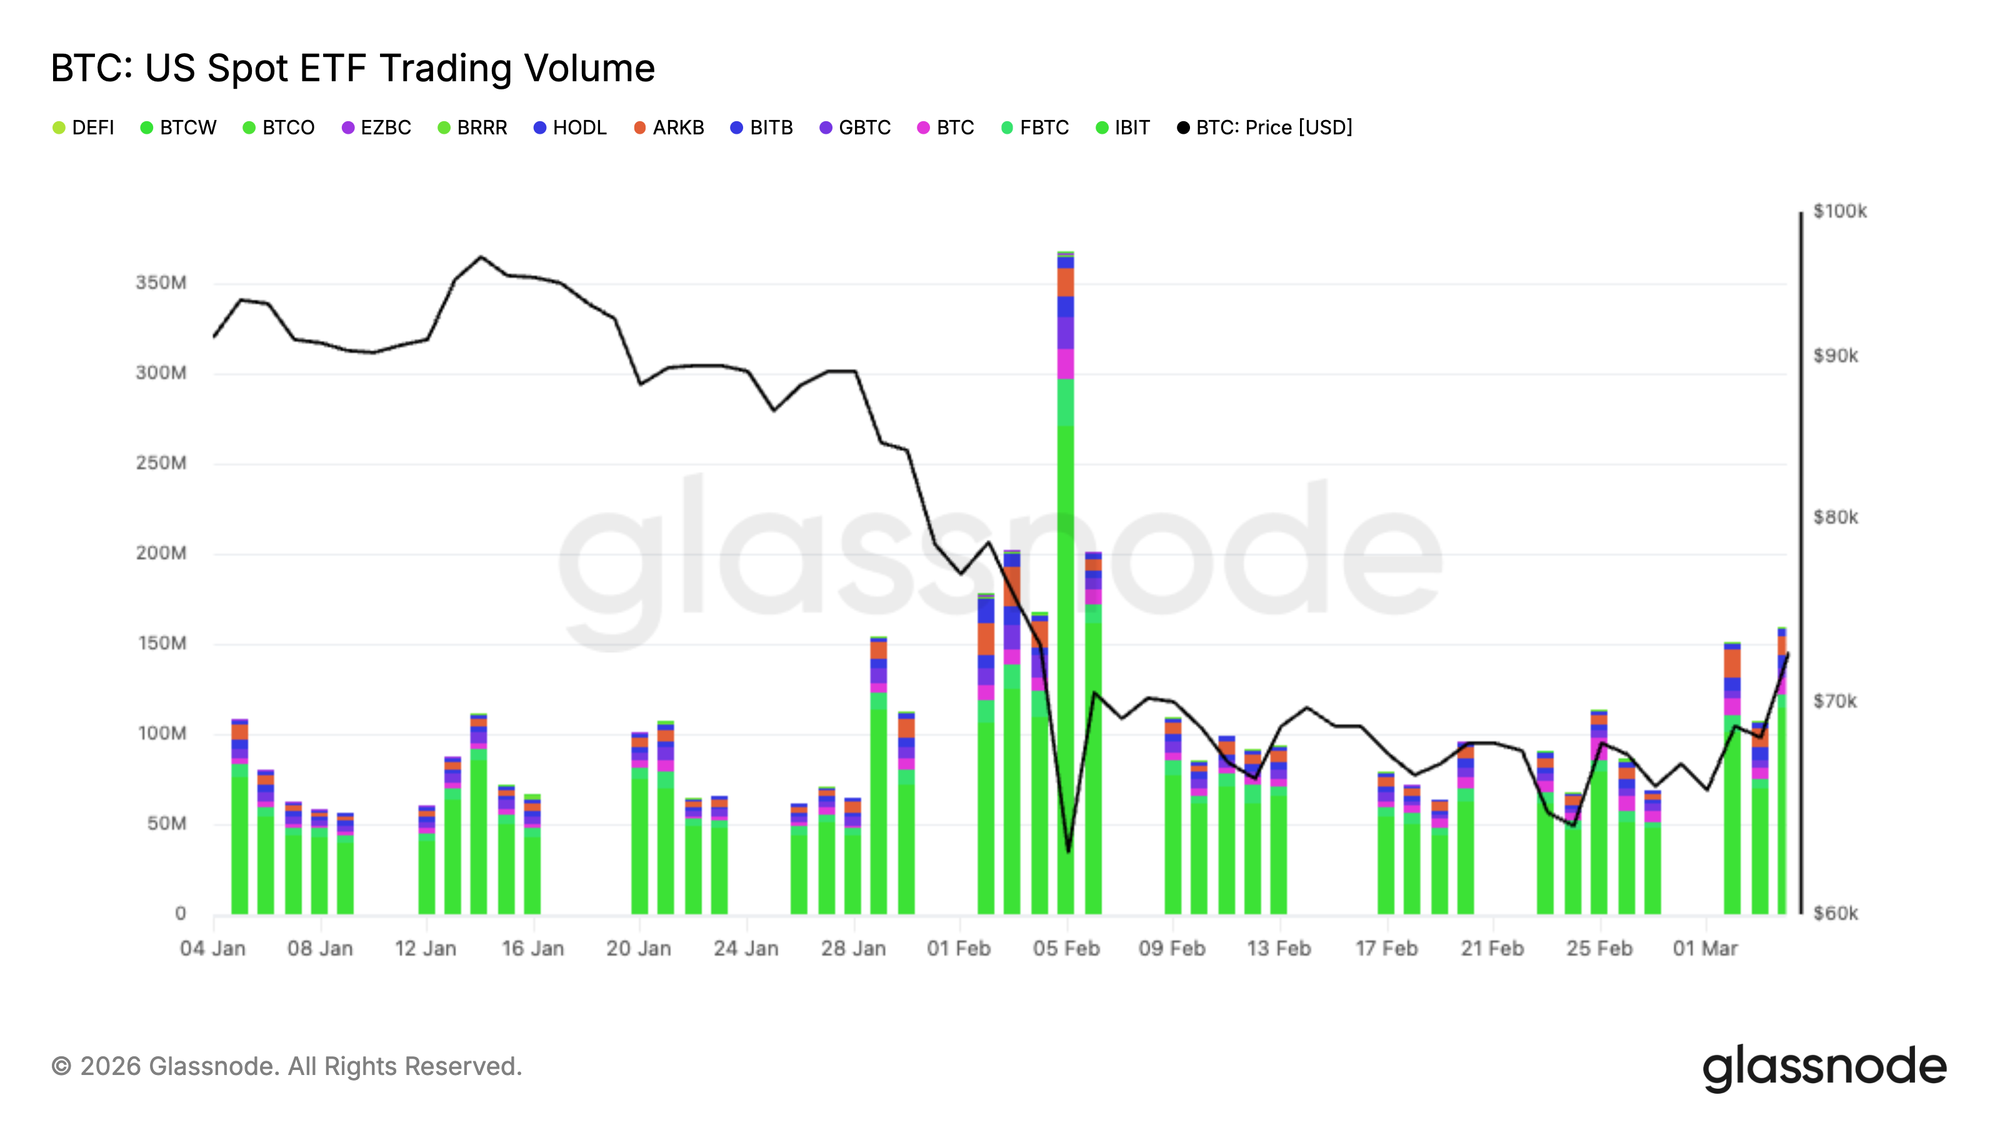
US Spot ETF Volume: Assessing Participation and Liquidity Conditions

The addition of trading volume is particularly useful for US spot ETFs. Trading volume provides insight into liquidity, participation, and conviction.

For example, a sharp spike in ETF trading volume around a major price move or macro event can signal heavy institutional repositioning — and comparing ETF volume against the underlying spot market shows how much real flow is moving through TradFi venues versus crypto-native ones. Sustained volume can confirm genuine demand behind a price trend, while thin volume on a move may warrant more caution.

View live chart

Together, these new metrics strengthen Glassnode’s ability to bridge crypto-native data with traditional market instruments, giving users a unified view of spot assets, ETFs, and listed treasury vehicles directly in Studio.

Explore the new metrics in Studio

  • DAT Price Companies
  • DAT Trading Volume Companies
  • US Spot ETF Price
  • US Spot ETF Trading Volume

  • Follow us on X for timely market updates and analysis
  • Join our Telegram channel for regular market insights
  • For on-chain metrics, dashboards, and alerts, visit Glassnode Studio

Disclaimer: This report is for informational and educational purposes only. The analysis represents a limited case study with significant constraints and should not be interpreted as investment advice or definitive trading signals. Past performance patterns do not guarantee future results. Always conduct thorough due diligence and consider multiple factors before making investment decisions.

Related Questions

QWhat two new metric families has Glassnode added to its Studio platform to track digital asset markets beyond crypto-native venues?

AThe two new metric families are US Spot ETF Price & Volume and US Digital Asset Treasury Company Price & Volume.

QAccording to the article, what advantage does tracking US Spot ETF trading volume provide for market analysis?

ATracking US Spot ETF trading volume provides insight into liquidity, participation, and conviction. It can signal institutional repositioning and help determine how much real flow is moving through traditional finance venues compared to crypto-native ones.

QHow can the data on US Digital Asset Treasury (DAT) companies help investors?

AThe data makes it easier to compare how listed equities of DAT companies behave relative to the underlying crypto asset, helping to assess which stocks have a stronger or weaker equity beta to crypto market movements and identify which act more like direct crypto proxies.

QWhat is the overall purpose of Glassnode's expansion with these new metrics, as described in the article?

AThe overall purpose is to bridge crypto-native data with traditional market instruments, giving users a unified view of how crypto exposure is expressed through spot assets, ETFs, and listed treasury vehicles in traditional equity markets.

QWhere can users access these new metrics and find additional market insights from Glassnode, based on the article's final sections?

AUsers can access the new metrics in Glassnode Studio. For timely updates, they can follow Glassnode on X, join their Telegram channel for market insights, and visit Glassnode Studio for on-chain metrics, dashboards, and alerts.

Related Reads

The Rally That Wasn't

The article analyzes Bitcoin's sharp decline amid a shift in macroeconomic expectations, with strong US job data leading markets to price out Fed rate cuts. Bitcoin fell 13% to around $67,000, triggering significant outflows from US spot ETFs and indicating institutional de-risking. On-chain data confirms a bearish structure. Price has dropped back into the "bear market range," with the Short-Term Holder Cost Basis falling below a key mean level—a pattern last seen in early 2022. The profitability bias has collapsed, with loss realization now dominating, mirroring a panic wave from February. Recent buyers who accumulated near the $82k top are under pressure, and loss realization is accelerating across both short-term and long-term holder cohorts. Off-chain, the rally failed at the aggregate US ETF cost basis near $83k, turning it into resistance. Spot market demand has deteriorated sharply, with sellers dominating order books. While a major long liquidation event cleared over $400M in leverage, spot buyers have not returned to absorb supply. Options markets show sustained demand for downside protection (elevated put premiums) but not panic, with volatility premiums near three-month highs. The conclusion is that the market remains fragile, with overhead supply from trapped ETF investors, weak spot demand, and accelerating losses. Without a return of spot buying and a reclaim of key cost bases, Bitcoin is vulnerable to further downside within the prevailing bear market structure.

insights.glassnode1h ago

The Rally That Wasn't

insights.glassnode1h ago

Trading

Spot
Futures
活动图片