BTC Market Pulse: Week 25

insights.glassnodePublished on 2026-06-15Last updated on 2026-06-15

Abstract

Bitcoin is attempting a modest rebound from oversold levels, but structural data indicates stabilization, not a trend reversal. Key shifts include a move from selling to buying pressure in perpetual futures and a near-flattening of spot selling. However, the bounce lacks conviction, evidenced by a 40% drop in spot volume and declining open interest, suggesting it is driven by short covering rather than new bullish bets. Market fear has receded sharply, with volatility spreads collapsing and ETF outflows narrowing. On-chain activity is subdued, with falling transaction volumes and continued capital exit. While capitulation is slowing and the supply is shifting to longer-term holders, profitability remains stressed. The overall picture is of a market building a consolidation base, lacking the volume and fresh institutional capital needed for a confirmed reversal.

Bitcoin is staging a tentative relief bounce from deeply oversold conditions, but the structural evidence points to stabilization rather than trend reversal. The defining development of the past week is a dramatic shift in taker aggression: Perpetual CVD reversed from -$770M to +$182M and Spot CVD flipped from -$205M to near breakeven. Price momentum confirms this, with RSI climbing 94.8% off extreme oversold levels, yet at 29.1 it remains pinned near its lower statistical band, short of any sustained buyer dominance.

The recovery is happening on thin ice. Spot volume collapsed 40.4% to $5.8B and Futures Open Interest declined another 3% to $30.6B, a sign the bounce is being driven by covering rather than fresh conviction. Long-side funding payments fell 22.3% and ETF trade volume dropped 38.1% to $11.1B. The market is lighter, not healthier.

Fear is receding nonetheless. The Volatility Spread compressed 85% in a single week, from 27.71% to 4.07%, as options participants rapidly repriced tail risk lower. The 25-Delta Skew eased from 19.07% to 15.99%, reflecting reduced demand for downside hedges. ETF net outflows improved 65.5%, narrowing from -$1.3B to -$465M, and the ETF MVRV has crept back above 1.0 to 1.06. Capitulation is decelerating: the Realized P/L ratio improved 46% and the NUPL narrowed 14%, though both remain in net-loss territory.

On-chain fundamentals confirm a quieter market. Active addresses fell 6.3% and entity-adjusted transfer volume dropped 38.8% to $3.9B, well below its lower statistical band. Realized Cap Change deepened to -1.3%, signaling that capital continues to exit the network. The one encouraging read is supply composition: Hot Capital Share and the STH-to-LTH ratio have both broken below their lower bounds, indicating that recent-vintage supply has been largely flushed and the holder base is becoming more long-term dominated.

Profitability remains stressed. Just over half the circulating supply (50.8%) is held at a profit, below the 55.1% low band, suppressing sell-side pressure while extending the duration of investor stress.

Capitulation intensity is fading, sentiment hedging is unwinding, and taker behavior has shifted constructively. But the absence of volume, the declining derivatives footprint, and ongoing capital outflows mean this is a consolidation base being built, not a confirmed reversal. Conviction and institutional re-engagement remain the missing catalysts.

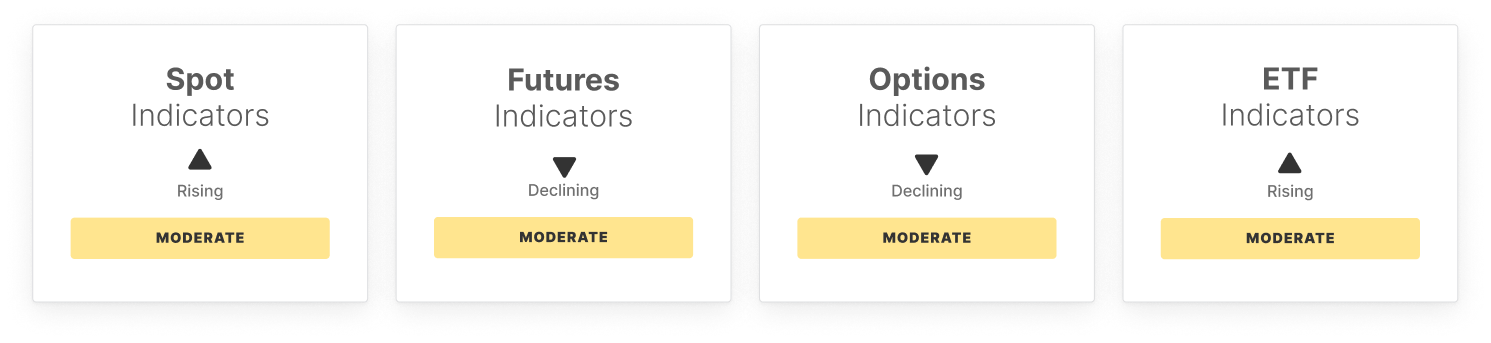
Off-Chain Indicators
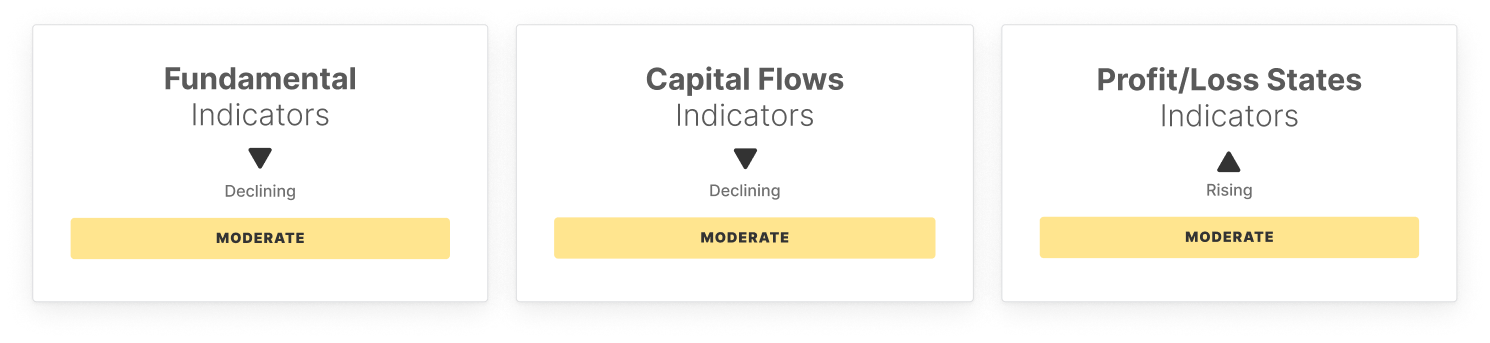
On-Chain Indicators

🔗 Access the full report in PDF

Don't miss it!

Smart market intelligence, straight to your inbox.

Subscribe now
  • Follow us and reach out on X
  • Join our Telegram channel
  • For on-chain metrics, dashboards, and alerts, visit Glassnode Studio

Disclaimer: This report does not provide any investment advice. All data is provided for information and educational purposes only. No investment decision shall be based on the information provided here and you are solely responsible for your own investment decisions.

Exchange balances presented are derived from Glassnode’s comprehensive database of address labels, which are amassed through both officially published exchange information and proprietary clustering algorithms. While we strive to ensure the utmost accuracy in representing exchange balances, it is important to note that these figures might not always encapsulate the entirety of an exchange’s reserves, particularly when exchanges refrain from disclosing their official addresses. We urge users to exercise caution and discretion when utilizing these metrics. Glassnode shall not be held responsible for any discrepancies or potential inaccuracies.

Please read our Transparency Notice when using exchange data.

Related Questions

QWhat are the key data points indicating a shift in taker behavior during the past week, according to the article?

AThe article states that Perpetual CVD reversed from -$770M to +$182M and Spot CVD flipped from -$205M to near breakeven, indicating a dramatic shift from selling aggression to constructive buying from takers.

QWhy does the article suggest the market bounce is happening 'on thin ice'?

AThe bounce is considered to be on thin ice because spot volume collapsed 40.4% and Futures Open Interest declined another 3%, suggesting the move is driven by short covering rather than fresh, high-conviction buying. The market is described as lighter, not healthier.

QWhat on-chain supply metric indicates a positive shift in the holder base structure?

AThe supply composition shows a positive shift: both the Hot Capital Share and the STH-to-LTH ratio have broken below their lower statistical bounds. This indicates that recently acquired supply has been largely flushed out and the holder base is becoming more dominated by long-term holders.

QHow did market fear and hedging behavior change, as shown by volatility and options metrics?

AFear receded significantly. The Volatility Spread compressed 85% in a week (from 27.71% to 4.07%) as options traders rapidly repriced tail risk lower. The 25-Delta Skew also eased from 19.07% to 15.99%, reflecting reduced demand for downside protection hedges.

QWhat is the article's overall conclusion about the current market condition for Bitcoin?

AThe article concludes that while capitulation is fading and some metrics have improved constructively, the absence of volume, declining derivatives activity, and ongoing capital outflows mean this is a period of consolidation and base-building, not a confirmed trend reversal. The market lacks the catalysts of strong conviction and institutional re-engagement.

Related Reads

Ray Dalio: AI Bull Market Continues to Soar, Should Investors Go All In or Cash Out and Leave the Field?

In his latest notes, Ray Dalio addresses a critical question for investors amid the AI-driven stock market surge: how should one allocate assets during a transformative technological revolution? Dalio emphasizes that technological advancement does not automatically make related stocks attractive. Historical tech cycles—marked by excitement, crowding, volatility, and eventual shakeouts—show that even long-term winners like Microsoft and Apple experienced severe drawdowns. Today's AI sector faces similar uncertainties: overinvestment, intensifying competition, geopolitical tensions (e.g., Taiwan's chip supply), tax policy shifts, anti-AI sentiment, and potential disruption from future technologies like quantum computing. Dalio's core argument focuses on the highly concentrated market structure, where a few tech giants dominate major indices. He warns investors against unknowingly holding concentrated, correlated exposures. Instead of chasing a handful of AI leaders, he advocates for a robust, diversified portfolio of 15 or more high-quality, uncorrelated investments, risk-balanced to match an investor's volatility tolerance. Mathematically, such diversification significantly improves the risk-return ratio—for example, holding 15 uncorrelated assets can boost the ratio by over four times compared to a single concentrated bet. Dalio cautions that future equity returns appear low, with his bubble indicator suggesting real returns could be negative over the next 5-10 years. He stresses that knowing what you don't know is as important as knowing what you do. In an environment of high uncertainty and concentration, avoiding large, concentrated bets on AI stocks is prudent. The optimal strategy is disciplined diversification—the "holy grail" of investing—to navigate this technologically driven cycle with lower risk and comparable or better returns.

marsbit3m ago

Ray Dalio: AI Bull Market Continues to Soar, Should Investors Go All In or Cash Out and Leave the Field?

marsbit3m ago

The World Cup has only been played for a few days, but some AI prediction models have already been crowned as oracles, while others have stumbled badly.

The 2026 FIFA World Cup has sparked significant interest not only on the pitch but also in AI-driven match prediction. Major models like Qwen, Copilot, and ChatGPT are being used to forecast outcomes, scores, upsets, red cards, and key player performances. Qwen gained early attention by accurately predicting Mexico's 2-0 win over South Africa (including a red card risk) and South Korea's 2-1 victory over the Czech Republic in the opening matches. Copilot's pre-tournament predictions had notable successes, such as correctly calling the Mexico 2-0 scoreline, South Korea's 2-1 win, and Brazil's 1-1 draw with Morocco. However, it also had clear misses, failing to predict upsets like Australia's 2-0 win over Turkey or Switzerland's draw with Qatar. ChatGPT provided detailed analytical reasoning, correctly predicting Mexico's 2-0 win, but its full-tournament predictions tended to favor favorites, missing several underdog results and draws. Tests pitting multiple models (ChatGPT, Gemini, Grok, Claude) against the same match, like Mexico vs. South Africa, showed varying predictions, with only some hitting the exact score. In summary, while AI models like Qwen have shown promising early results in specific match details, and others have had isolated successes, they collectively struggle to consistently identify upsets and underdog performances. AI is becoming an additional reference tool for prediction markets but is far from a definitive source.

marsbit4m ago

The World Cup has only been played for a few days, but some AI prediction models have already been crowned as oracles, while others have stumbled badly.

marsbit4m ago

Missed Out on SpaceX's IPO? Take a Look at SpaceX's Complete Supply Chain

SpaceX is now public, but its high valuation and losses may deter some investors. However, the real opportunity, as seen with Apple, Tesla, and Nvidia, may lie in its extensive supply chain. SpaceX, funded primarily by its profitable Starlink service, spends hundreds of billions annually on components for its rockets, satellites, and planned orbital AI data centers, creating significant revenue streams for suppliers. Key suppliers are categorized by their indispensability. The first group includes irreplaceable players like **NVIDIA** (GPUs for AI supercomputers), **Eutelsat (SATS)** (spectrum rights), **Filtronic** (millimeter-wave amplifiers), **Materion (MTRN)** (beryllium alloys), and **STMicroelectronics (STM)** (phased array chips). The second category comprises suppliers costly to replace due to long certification cycles or deep integration, such as **Honeywell (HON)** (flight controls), **Carpenter Technology (CRS)** (specialty steel), **Hexcel (HXL)** (carbon fiber), **Broadcom (AVGO)** (data switching), and **Linde** (industrial gases). The third group involves high-volume, cost-critical manufacturers for mass-produced items like Starlink terminals. Major players here include Taiwanese contract manufacturer **Wistron NeWeb (6285)** and several Chinese-listed firms: **Sunway Communication (300136)**, **Parker Advanced Materials (605123)**, **Western Superconducting (002149)**, and **Yingliu Co., Ltd. (603308)**. Other niche providers include **Tianyin Electromechanical**, **Tongyu Communication**, **Trimble (TRMB)**, **Astronics (ATRO)**, and **CTSH**. The timing is now relevant because: 1) SpaceX's procurement is accelerating with plans for 100 launches in 2026, 30 million Starlink terminals, and orbital data centers. 2) Its IPO has brought unprecedented transparency to its supply chain. 3) This phase mirrors early days of the Tesla supply chain boom. The investment thesis shifts from betting on SpaceX's stock to betting on the steady, order-book-driven revenues of its essential suppliers. Risks remain, such as commodity cycles, geopolitical factors, and technological shifts, but the supply chain offers a potentially less speculative path to participate in SpaceX's growth.

marsbit22m ago

Missed Out on SpaceX's IPO? Take a Look at SpaceX's Complete Supply Chain

marsbit22m ago

Jane Street: The Most Powerful Behind-the-Scenes Operator in the Crypto Industry

Jane Street: Crypto's Most Powerful Behind-the-Scenes Operator A recent 13F filing revealed Jane Street, the secretive Wall Street quant giant, drastically reduced its Bitcoin ETF holdings while increasing stakes in Ethereum ETFs. This move highlights its role not as a directional investor, but as a critical infrastructure player extracting "tolls" from crypto's institutionalization. The firm, founded in 2000 and famously lacking a CEO, has systematically embedded itself across crypto markets. It acts as a key Authorized Participant (AP) and market maker for major Bitcoin and Ethereum ETFs, profiting from arbitrage between ETF shares and underlying assets. Its approach combines quantitative prowess with a willingness to hold positions for structural arbitrage, differing from pure high-frequency traders. Jane Street faces allegations related to the 2022 Terra (LUNA) collapse. A lawsuit claims it used non-public information to withdraw $85 million in UST minutes before a critical withdrawal by Terraform Labs, allegedly exacerbating the crash and avoiding over $200 million in losses. The company denies the claims. Further indicating its reach, a wallet suspected to be operated by Jane Street ("JaneStreetIndia") was identified on the prediction market Polymarket. This bot executed over 11,000 high-frequency trades on short-term crypto price movements with a near-perfect win rate, showcasing a套利 strategy divorced from traditional prediction. Beyond trading, Jane Street holds equity in crypto infrastructure like Kraken, 1inch, and Arbitrum, and mining stocks. Its strategy is clear: avoid betting on winners, but secure a position in the market's essential plumbing. By becoming a ubiquitous part of the liquidity infrastructure—from ETFs to OTC trading and potentially链上 markets—Jane Street operates as a market force itself, raising questions about whether crypto's decentralized,散户-friendly alpha is being permanently eroded by traditional finance's most sophisticated players.

Foresight News25m ago

Jane Street: The Most Powerful Behind-the-Scenes Operator in the Crypto Industry

Foresight News25m ago

U.S.-Iran Ceasefire: How Much of a Bitcoin Rally Can a Truce Agreement Support?

Headline: "U.S.-Iran Truce: How Much Can a Ceasefire Agreement Propel Bitcoin's Rebound?" On June 15th, Bitcoin rebounded to around $67,255, marking its first return to the $67,000 level since falling below $60,000 earlier in June. Ethereum and Solana also saw significant gains. The immediate driver for this market-wide recovery in crypto and global risk assets was the signing of a U.S.-Iran ceasefire memorandum, with a formal ceremony scheduled for June 19th. The agreement, which includes reopening the Strait of Hormuz, caused oil prices to plunge roughly 5%, easing inflation expectations and boosting prospects for Federal Reserve rate cuts. This macroeconomic shift fueled a rally in U.S. equities, with the Dow Jones hitting a record high. SpaceX's spectacular post-IPO performance further energized market sentiment. However, on-chain and derivatives data from Glassnode suggest this move is more indicative of a technical rebound from deeply oversold conditions rather than a confirmed trend reversal. The crypto market is undergoing noticeable capital rotation. While Bitcoin ETFs recently saw their worst outflows on record, the bleeding has slowed significantly. Meanwhile, new altcoin ETFs for assets like XRP and Solana are attracting substantial inflows, causing Bitcoin's market dominance to drop to 58%. Despite the rebound, the Crypto Fear & Greed Index remains in "Extreme Fear" territory at 22. The price quickly retreated after touching the $67,000 resistance level, indicating selling pressure persists. Analysis shows short-term speculative supply has been heavily washed out, with holder structure shifting toward a more long-term profile. While panic is subsiding and some on-chain metrics point to accumulation at lower prices, the market currently lacks the strong, sustained institutional buying needed to establish a new bullish trend.

Foresight News41m ago

U.S.-Iran Ceasefire: How Much of a Bitcoin Rally Can a Truce Agreement Support?

Foresight News41m ago

Trading

Spot
Futures

Hot Articles

What is $BITCOIN

DIGITAL GOLD ($BITCOIN): A Comprehensive Analysis Introduction to DIGITAL GOLD ($BITCOIN) DIGITAL GOLD ($BITCOIN) is a blockchain-based project operating on the Solana network, which aims to combine the characteristics of traditional precious metals with the innovation of decentralized technologies. While it shares a name with Bitcoin, often referred to as “digital gold” due to its perception as a store of value, DIGITAL GOLD is a separate token designed to create a unique ecosystem within the Web3 landscape. Its goal is to position itself as a viable alternative digital asset, although specifics regarding its applications and functionalities are still developing. What is DIGITAL GOLD ($BITCOIN)? DIGITAL GOLD ($BITCOIN) is a cryptocurrency token explicitly designed for use on the Solana blockchain. In contrast to Bitcoin, which provides a widely recognized value storage role, this token appears to focus on broader applications and characteristics. Notable aspects include: Blockchain Infrastructure: The token is built on the Solana blockchain, known for its capacity to handle high-speed and low-cost transactions. Supply Dynamics: DIGITAL GOLD has a maximum supply capped at 100 quadrillion tokens (100P $BITCOIN), although details regarding its circulating supply are currently undisclosed. Utility: While precise functionalities are not explicitly outlined, there are indications that the token could be utilized for various applications, potentially involving decentralized applications (dApps) or asset tokenization strategies. Who is the Creator of DIGITAL GOLD ($BITCOIN)? At present, the identity of the creators and development team behind DIGITAL GOLD ($BITCOIN) remains unknown. This situation is typical among many innovative projects within the blockchain space, particularly those aligning with decentralized finance and meme coin phenomena. While such anonymity may foster a community-driven culture, it intensifies concerns about governance and accountability. Who are the Investors of DIGITAL GOLD ($BITCOIN)? The available information indicates that DIGITAL GOLD ($BITCOIN) does not have any known institutional backers or prominent venture capital investments. The project seems to operate on a peer-to-peer model focused on community support and adoption rather than traditional funding routes. Its activity and liquidity are primarily situated on decentralized exchanges (DEXs), such as PumpSwap, rather than established centralized trading platforms, further highlighting its grassroots approach. How DIGITAL GOLD ($BITCOIN) Works The operational mechanics of DIGITAL GOLD ($BITCOIN) can be elaborated on based on its blockchain design and network attributes: Consensus Mechanism: By leveraging Solana’s unique proof-of-history (PoH) combined with a proof-of-stake (PoS) model, the project ensures efficient transaction validation contributing to the network's high performance. Tokenomics: While specific deflationary mechanisms have not been extensively detailed, the vast maximum token supply implies that it may cater to microtransactions or niche use cases that are still to be defined. Interoperability: There exists the potential for integration with Solana’s broader ecosystem, including various decentralized finance (DeFi) platforms. However, the details regarding specific integrations remain unspecified. Timeline of Key Events Here is a timeline that highlights significant milestones concerning DIGITAL GOLD ($BITCOIN): 2023: The initial deployment of the token occurs on the Solana blockchain, marked by its contract address. 2024: DIGITAL GOLD gains visibility as it becomes available for trading on decentralized exchanges like PumpSwap, allowing users to trade it against SOL. 2025: The project witnesses sporadic trading activity and potential interest in community-led engagements, although no noteworthy partnerships or technical advancements have been documented as of yet. Critical Analysis Strengths Scalability: The underlying Solana infrastructure supports high transaction volumes, which could enhance the utility of $BITCOIN in various transaction scenarios. Accessibility: The potential low trading price per token could attract retail investors, facilitating wider participation due to fractional ownership opportunities. Risks Lack of Transparency: The absence of publicly known backers, developers, or an audit process may yield skepticism regarding the project's sustainability and trustworthiness. Market Volatility: The trading activity is heavily reliant on speculative behavior, which can result in significant price volatility and uncertainty for investors. Conclusion DIGITAL GOLD ($BITCOIN) emerges as an intriguing yet ambiguous project within the rapidly evolving Solana ecosystem. While it attempts to leverage the “digital gold” narrative, its departure from Bitcoin's established role as a store of value underscores the need for a clearer differentiation of its intended utility and governance structure. Future acceptance and adoption will likely depend on addressing the current opacity and defining its operational and economic strategies more explicitly. Note: This report encompasses synthesised information available as of October 2023, and developments may have transpired beyond the research period.

368 Total ViewsPublished 2025.05.13Updated 2025.05.13

What is $BITCOIN

Discussions

Welcome to the HTX Community. Here, you can stay informed about the latest platform developments and gain access to professional market insights. Users' opinions on the price of BTC (BTC) are presented below.

活动图片