One of the biggest changes to the crypto market today compared to the last bear market is the different types of assets that exist.
Instead of choosing between Dash, Litecoin, Ethereum, Bitcoin, etc., people can invest in NFTs and plots of digital land in the metaverse.
Common sense indicates that these new, experimental assets are riskier compared to BTC and ETH. While it’s difficult to objectively measure risk, we can use on-chain data to assess price volatility.
With the bear market fully underway, now is the perfect time to compare these assets and see what the ultimate blue-chip assets could be going forward: Crypto, NFTs, or metaverse land.
Here, we’ll compare three hypothetical investors: Abe, Bob and Cathy. One year ago, each put their money into a different asset class within the crypto space.
Abe’s portfolio: 50% BTC & 50% ETH.
Bob’s portfolio: 50% BAYC & 50% CryptoPunks.
Cathy’s portfolio: 50% Decentraland Land & 50% Sandbox parcels.
These comparisons arent’s 1-to-1 (buying 3 Bored Apes at $6,000 each one year ago is a very different move than investing $6,000 in a longstanding “safe” token like ETH.) So, we’ve created 3 “reasonable” portfolios along these 50/50 lines that aren’t exactly the same. To be explained later.
In this article, we’ll track how each of these investors’ portfolio’s performed and explore why some of these investments are more volatile than others.
Abe’s Token Portfolio
One of the upsides of investing in tokens instead of NFTs is liquidity and divisibility. We are able to put a precise USD dollar value on BTC and ETH on any given day, buy any amount we want, and receive a fair market rate.
On this day a year ago, June 28, 2021, BTC cost $35,867. For ease of calculation, we’ll round this to the nearest hundred—$35,900. ETH was $2,160—rounded to $2,200.
Our token investor chose an excellent time to jump in. After the enthusiasm of the Coinbase listing on April 13, 2021, and the Federal Reserve dropping interest rates to 0.25% to stimulate the economy, the market roared. However, it was temporarily sent crashing primarily due to a wave of strict regulations in China, and it was roughly here when Abe aped in.
In hindsight, Abe bought the bottom of the cycle, putting $50,000 into BTC and $50,000 into ETH (getting about 1.39 BTC and 22.7 ETH.)
The insane climb upward continued until November 8, 2021, when Abe’s initial investment was worth $203,767.52.
But then, speculative enthusiasm for cryptocurrencies started waning as retail and investors cut back on risky assets.
From January to June, the Federal Reserve raised interest rates by 75 basis points in quick succession, the largest margin in 28 years.
In February, the war in Ukraine triggered a downturn in macroeconomic conditions, resulting in a bearish environment for the crypto market.
To top it off, the flash crash of Terra Luna in May looked like the beginning of a series of blockchain industry car wrecks.
All these events have driven down the price of BTC and ETH—assets which, to the vast majority of the non-crypto public, are stand-ins for the “price of crypto” itself.
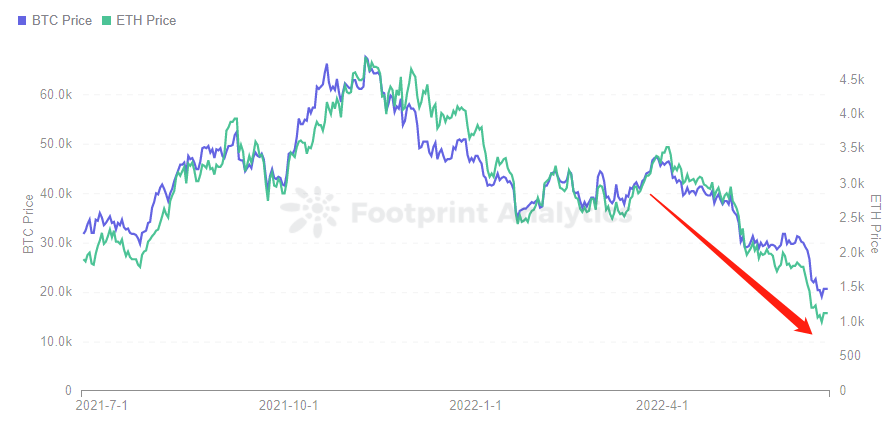
Footprint Analytics – BTC Price & ETH Price
On June 28, 2022, Abe’s 1.39 BTC and 22.7 ETH portfolio was worth $54,197.7, down 45.8%. The drop from the all-time high was 73.4%.
The NFT Portfolio
Although NFTs are not as liquidity as BTC or ETH, they are unique and collectible. And when the market is in a better state, holders can also get a specific dollar value from it.
What did the NFT market look like in June 2021?
- Germination and construction period:
In June 2017, CrytoPunks, the world’s first NFT project, was officially born, bringing the NFT concept to a climax. Led by OpenSea, NFT trading has become more convenient and perfect, making NFT application areas gradually expand from games and artworks.
- Expansion period.
By 2021, Axie Infinity sales were rising rapidly, driving the growth of the NFT market. The same year, BAYC was also established and entered the public eye.
This is the perfect time for Bob to enter the market when NFTs are in their infancy. Because NFT abides by a rule, the sooner its attributes are rarer, the higher the value and the lower the price is more balanced (the NFT trading market is immature, and the transaction frequency is low).
BAYC and CryptoPunks rank among the top NFTs in terms of trading volume in 2021.
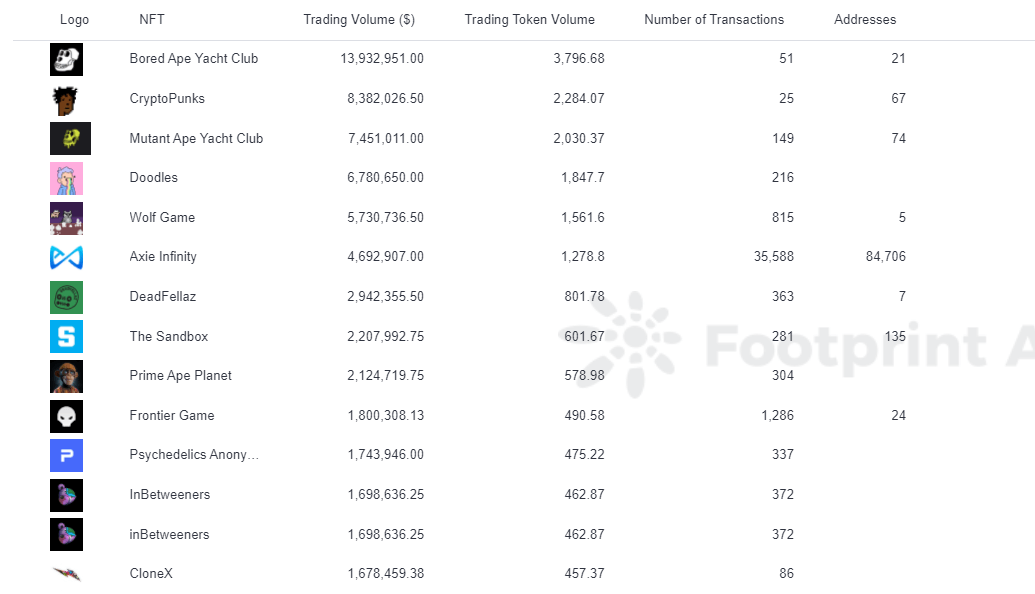
Footprint Analytics – NFT Projects by Trading Volume in 2021
Assuming Bob buys 1 BAYC (3.5713 ETH) and 1 CryptoPunk (28.9191 ETH) on June 28, 2021, at an average price, his initial investment is worth $71,478.88 at that time.
In 2021, world economic development was severely impacted by the epidemic, and fiscal easing in major economies brought inflation and currency devaluation, driving users to crypto markets such as artwork, NFT, and BTC. trading activity in the NFT market continued to increase from August to March 2021.
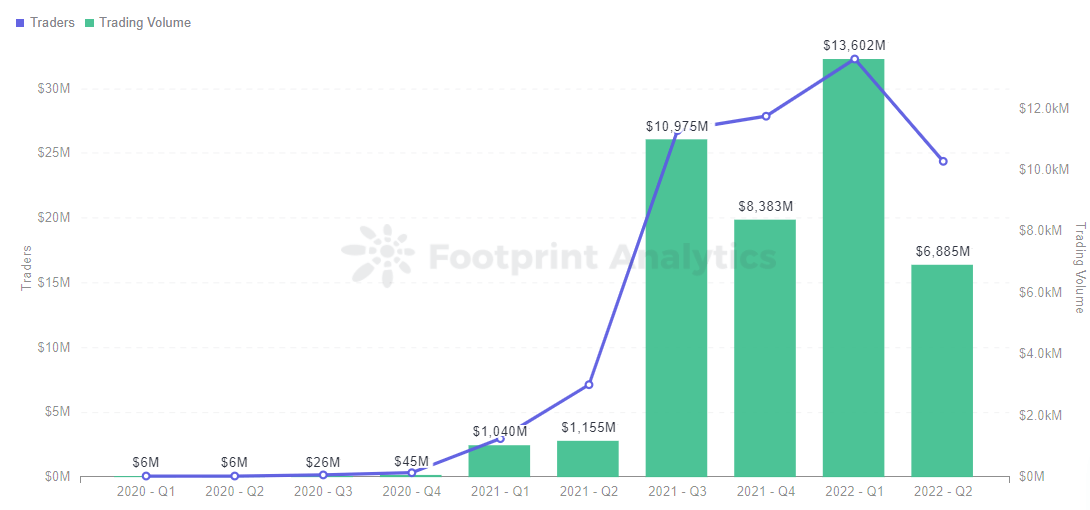
Footprint Analytics – NFT Traders & Trading Volume
If Bob had followed ETH and sold it at its peak on November 8 (ETH at $4,826.25), when the average prices of BAYC and CryptoPunk were 43.8835 ETH and 98.5848 ETH, respectively, his portfolio would have been worth $687,587.63, an increase of 861.95%.
The Crypto market crash led to a decline in investor interest in NFT, significantly impacting its overall trading volume and market cap decline. Over the past 90 days, total trading volume has fallen by 63.84% and total market capitalization by 38.07%.
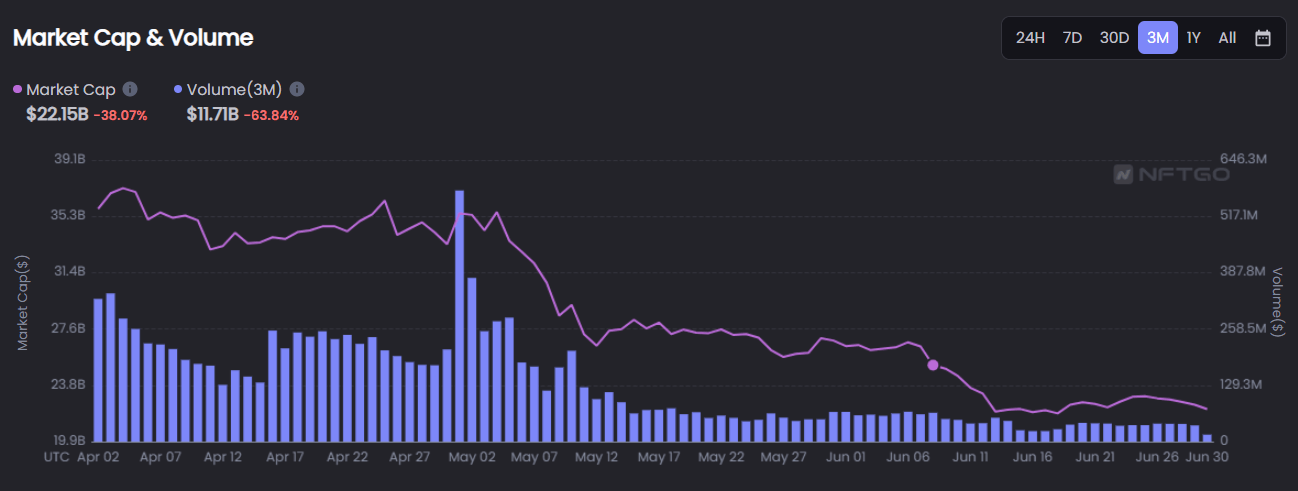
Screenshot Source – nftgo – Market Cap & Volume
As of June 28, 2022, ETH is trading at $1,144, BAYC at 113.5035 ETH, and CryptoPunk at 77.6991 ETH. Bob’s portfolio is worth $218,735.77, up 206.01% year-over-year. It is down 68.19% from its all-time high.
Clearly, blue-chip NFTs, as of the beginning of summer 2022, aren’t as volatile as many people think compared to the so-called “safe” crypto investments BTC and ETH.
*Since investing half your portfolio into BAYC NFTs would have been quite insane in June 2021, we’re taking a different approach to 50/50 in this portfolio. Bob bought 1 Punk and 1 Ape.
The Land Portfolio
By being interested in the metaverse in June 2021, Cathy can be considered an early adopter. At that time, the word “metaverse” had not yet become a household name.
Facebook’s rebranding to Meta was still four months away.
Was the metaverse some new version of Second Life? Did you need a VR headset to access it? Almost nobody who wasn’t deep in the crypto rapithole already knew.
But the rumblings were there. On June 4, Sotheby’s opened a virtual gallery in Decentraland, and the game made waves as the first to break 1 million in a metaverse land sale.
On June 28, 2021, Cathy became a metaverse landlord. Her purchase was one of 37 NFT sales in Decentraland, which generated $148,500 in total.
Because all the transactions on the blockchain are on a public ledger, we can actually see and analyze all the LAND sold on this date.
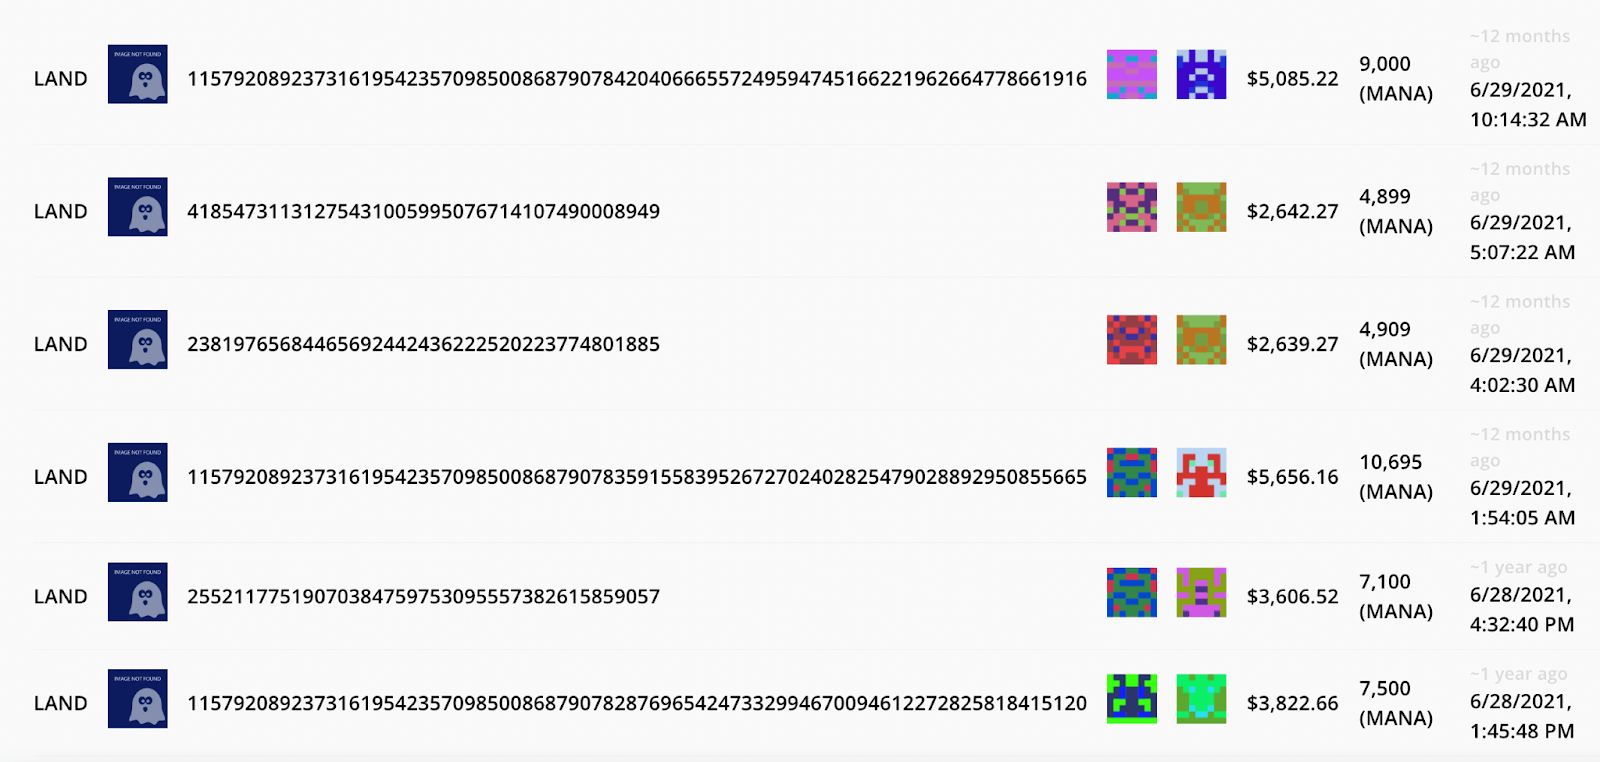
Screenshot Source – nonfungible
The average sale price on June 28 was about $4,000, which seems like a reasonable assessment looking at these sales. (I.e., if there were a single sale at an astronomical price, it would make the average a bad yardstick for how much Cathy could have paid.)
So, dipping her toes into the metaverse, Cathy bought one plot of land for $4,000—perhaps this one:

Screenshot Source – nonfungible
She also added a parcel in The Sandbox. At that time, the search term “Sandbox” hardly brought to mind the metaverse title that would take over news headlines in just a few months for the 3842% jump in its token price.
On June 28, 46 NFTs were sold, bringing in $43,500, an average price of $945. This is a few hundred higher than the median price for the day but is still accurate enough to do a general analysis.
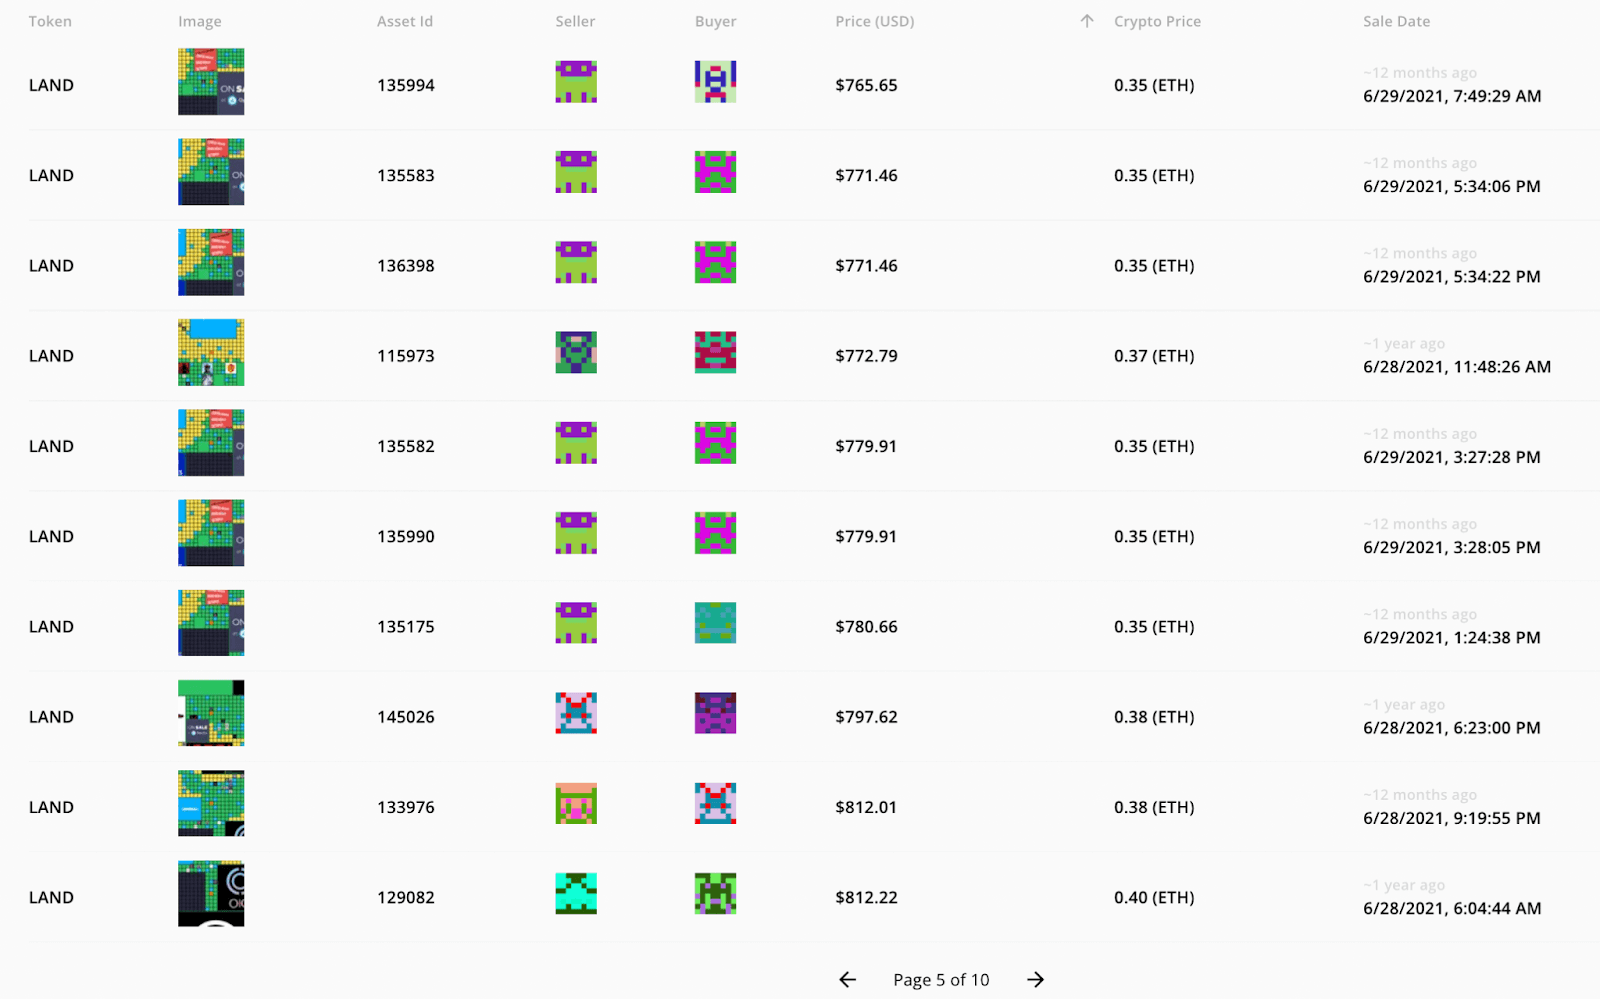
Screenshot Source – nonfungible
So, to maintain a nearly 50/50 allocation in the two biggest-name products in the asset category, Cathy bought one plot of Decentraland land at $4,000 and 4 Sandbox lands at $945 each—a total metaverse land portfolio of $7,780.
Her judgment would prove visionary. By November 8, 2021, when ETH BTC peaked, the average sale price in Decentraland increased by 3.0469 ETH to $14,705. The average price of The Sandbox land skyrocketed to $6,096, a 734.62% percent increase.
If we’re just going by averages, her 1 Decentraland plot and 4 Sandbox parcels would be worth $39,089.
If we instead look at the real asset shown above that cost just under $4,000 on June 28, 2021, then it increased by $59,135. It flipped hands for $55,313 on November 15, 2021, the closest sale to the ETH peak.
Over the next year, the prices of metaverse land declined sharply as the volume in Decentraland and The Sandbox decreased to ATLs by 76.81% and 79.03% respectively.
On June 28, 2022, Cathy’s portfolio was down by $14,811 from ATH (-62%). A big hit, but still way up from her original investment. Metaverse land is clearly extremely volatile and can still be called a Hail Mary play rather than a safe blue-chip.
Summary
While the bull market saw enormous gains for NFTs and metaverse land, the on-chain data for top projects indicates that prices are not as volatile as many people believe relative to “safe” assets like BTC and ETH.
In this article, we created three hypothetical portfolios and found that the safe crypto bet had a steeper fall from ATH (as of June 28) than investments into NFTs and metaverse land. The gains over the bull market would have also been significantly higher for the latter two “riskier” assets.
While there are several possible explanations for this (e.g., harder for institutions to push down the prices of NFTs and land), this data supports the idea thesis that the top NFTs and metaverse land projects have performed exceptionally well through the entirety of the last year—booms, busts, crashes and all.