What The Rise In Open Interest Means For The Dogecoin Price

bitcoinistPublished on 2025-12-29Last updated on 2025-12-29

Abstract

Dogecoin's open interest, which had reached all-time highs in September, crashed to 2024 lows by mid-December, reflecting declining investor participation amid a falling price. However, it has since recovered, climbing back above $1.5 billion, suggesting traders are returning. Historically, rising open interest has often preceded price recoveries, as seen in September when it peaked alongside a near $0.3 DOGE price. This trend indicates a potential price bottom is forming. Despite this, daily trading volume remains at yearly lows, consistent with broader crypto market bearishness and extreme fear, where low liquidity suppresses prices.

After the Dogecoin open interest hit new all-time highs back in September, it has seen a significant crash, culminating in the open interest dropping to levels not seen since 2024. This was a reflection of the decline in market participation from investors due to the rapid drop in the Dogecoin price. However, the open interest seems to have put in a bottom, and there has been a recovery in this major metric, something that could carry positive implications for the meme coin’s price.

Dogecoin Open Interest Recovers Above $1.5 Billion

On December 19, the Dogecoin open interest fell below the $1.3 billion mark, following the decline in participation. But the performance so far suggests that this could be a possible bottom. The week following this bottom saw a significant spike in the open interest, as it jumped above the $1.5 billion mark, as shown on Coinglass.

Since then, the Dogecoin price interest has consistently come in above $1.5 billion, suggesting that crypto traders are moving back into the meme coin. This is because the open interest measures the total outstanding futures or options contracts for a particular asset, and as the open interest rises, it means investors are opening more positions on Dogecoin.

Source: Coinglass

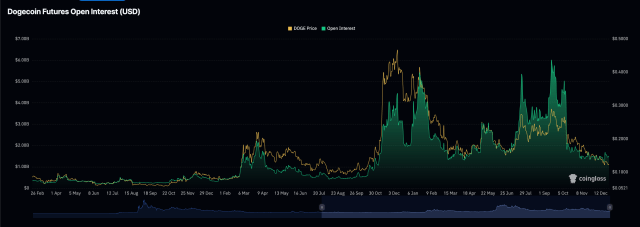
This carries a positive implication, going by historical performance, because times when the open interest has risen have often coincided with times when the price has seen a recovery. An example is the Dogecoin price reaching close to $0.3 back in September when the open interest rose to its current peak of $6.01 billion.

Given this trend, if the Dogecoin open interest continues to rise, then it is likely that the price will follow the same trajectory. Therefore, the DOGE price could be getting ready to mark a bottom, especially as the crypto market readies to usher in a new year.

Volume Refuses To Bugde

While the open interest has seen a recovery, the Dogecoin daily trading volume remains low. According to Coinglass data, the daily trading volume is sitting at one of the lowest points for the year 2025. This also plays into the fact that participation has been muted for the digital asset.

However, this muted volume is not relegated to Dogecoin lately, given that the entire crypto market has been in a bearish trend. The Crypto Fear & Greed Index is currently sitting at a score of 24 at the time of this writing. This shows that there is Extreme Fear in the market, and it is a time when liquidity is low, leading to lower prices.

DOGE stages another recovery | Source: DOGEUSDT on Tradingview.com

Trending Cryptos

Related Questions

QWhat does the recent recovery in Dogecoin's open interest suggest about investor behavior?

AThe recovery in Dogecoin's open interest above $1.5 billion suggests that crypto traders are moving back into the meme coin, as it indicates investors are opening more futures or options positions.

QWhat was the lowest point for Dogecoin open interest mentioned in the article, and when did it occur?

AThe Dogecoin open interest fell below the $1.3 billion mark on December 19, which was identified as a possible bottom.

QAccording to the article, what historical correlation exists between Dogecoin's open interest and its price?

AHistorically, times when the Dogecoin open interest has risen have often coincided with times when the price has seen a recovery, such as when the price reached close to $0.3 in September as open interest hit a peak.

QHow does the current Dogecoin daily trading volume compare to its performance in 2025?

AThe Dogecoin daily trading volume is sitting at one of the lowest points for the year 2025, indicating muted participation.

QWhat is the current reading of the Crypto Fear & Greed Index, and what does it imply for the market?

AThe Crypto Fear & Greed Index is currently at a score of 24, indicating Extreme Fear in the market, which is a time when liquidity is low and leads to lower prices.

Related Reads

Critical Game Week: BTC Retracement Confirmation vs. HYPE Support Battle | Guest Analysis

This weekly analysis outlines a critical juncture for BTC and HYPE markets, focusing on key price level confirmations. **BTC Analysis:** BTC is at a pivotal point after a five-wave rally from the June 5th low of $59,100. The price has broken below a short-term rising channel's lower boundary, with the current move seen as a pullback to test this breakdown. Failure to reclaim this level could lead to a retest of the $59,000-$60,000 support zone. The core scenario hinges on this channel retest outcome. * **Key Levels:** Resistance at $64,500-$65,000 (channel boundary) and $69,500-$70,500. Support at $59,000-$60,000 and $55,000. * **Strategy:** A core bearish stance is maintained (20% short from last week), with short-term plans for tactical trades. Three detailed contingency plans (A/B/C) are provided for short positions on resistance tests or breakdowns, emphasizing strict stop-loss discipline. **HYPE Analysis:** HYPE shows strong momentum but is currently in a corrective phase after hitting a new high of $76.94. The price is retesting the crucial $64-$66 support area. * **Key Levels:** Resistance near $77 and $80-$82. Support at $64-$66 and $52-$54. * **Strategy:** The short-term approach is "buy on dips, avoid chasing rallies." A long position is considered only if clear stabilization signals appear at the $64-$66 or deeper $52-$54 support zones, with tight risk controls. **General Risk Management:** A standardized trailing stop-loss protocol is emphasized: set initial stop, breakeven at +1% profit, then trail stops upward to lock in gains. *Disclaimer: All analysis is presented as a personal trading framework, not investment advice. Market conditions are complex and require dynamic adjustment.*

marsbit16m ago

Critical Game Week: BTC Retracement Confirmation vs. HYPE Support Battle | Guest Analysis

marsbit16m ago

Research Report Interpretation: Citi Attends AWS Summit, Bullish on Cloud Business Acceleration but Data Governance Remains Key Variable

Citi analyst Tyler Radke's team attended the AWS New York Summit (June 17-18), engaging with over 10 clients and partners. In a June 19 report, they highlighted the summit's focus on scaling agent AI for enterprise deployment. Citi maintains a "Buy" rating on Amazon, forecasting AWS revenue growth to accelerate to 37% in FY27 from 30% in FY26, noting this estimate may be conservative. Key takeaways: 1. **AWS Strategy Shift:** AWS is moving from proof-of-concepts to scalable deployment. New offerings like AWS Context (building enterprise knowledge graphs), Amazon Quick (cross-application AI assistant), and security tool Continuum address core enterprise pain points for AI adoption. 2. **Data Infrastructure Beneficiaries:** Data infrastructure companies like Snowflake, Elastic, Oracle, and ClickHouse are seen as direct beneficiaries of scaling AI workloads, as evidenced by strong growth and use cases presented. 3. **Critical Role of Data Governance:** As AI agents scale from hundreds to thousands, effective data governance becomes the key variable for deploying AI in core business processes. AWS Context represents AWS's strategic extension from providing compute/models to offering a data governance infrastructure layer. The report emphasizes that without solving data governance, AI will remain confined to pilot projects. The investment thesis focuses on AWS revenue acceleration and data infrastructure vendors' growth, while monitoring signals like AWS's quarterly revenue growth, Bedrock AgentCore task volume, and pricing impacts on companies like Elastic.

marsbit23m ago

Research Report Interpretation: Citi Attends AWS Summit, Bullish on Cloud Business Acceleration but Data Governance Remains Key Variable

marsbit23m ago

Crucial Week of Contention: BTC Tests Support and HYPE's Key Level Battle | Special Analysis

**Market Enters Critical Week: Bitcoin Pullback Test and HYPE Support Battle** The market enters a crucial phase of contention this week. The marginal shifts in Federal Reserve policy expectations continue to dictate the pricing rhythm for risk assets. Meanwhile, in the crypto market, following a period of sideways consolidation, the divergence between bulls and bears is becoming concentrated at key price levels. **Bitcoin (BTC) Analysis & Strategy** * **Technical View:** The 4-hour chart suggests BTC is in a five-wave structure since the June 5th low near $59,100. Price action shows a short-term rising channel. The recent drop below this channel's lower boundary is now being followed by a pullback attempt (wave 40-41). The outcome of this retest is critical. * **This Week's Outlook:** The core focus is whether BTC can reclaim and hold above the channel's lower boundary. * **Bullish Scenario:** A successful hold could lead to a continued rebound, potentially challenging the $69,500 - $70,500 resistance zone. * **Bearish Scenario:** Failure to hold may trigger a renewed test of the $59,000 - $60,000 core support area, with $55,000 as a deeper support level. * **Operational Strategy:** The author maintains a 20% mid-term short position initiated last week near $64,500, based on a model signaling a shift to a bearish structure. Short-term tactics involve using 30% capital for potential "spread" trades, with three contingency plans (A, B, C) outlined for reacting to resistance tests, breakouts, or support breakdowns. **HYPE Analysis & Strategy** * **Technical View:** On the 4-hour chart, HYPE shows strong momentum, having recently broken to a new high since January. The current pullback presents a clear three-wave correction structure, bringing the price back to the critical $64 - $66 support zone. * **This Week's Outlook:** The focus is on the battle for the $64 - $66 support area. * **Bullish Scenario:** Holding this support could signal a continuation of the uptrend from the June 10th low, leading to new highs. * **Bearish Scenario:** A breakdown could extend the correction, potentially testing the deeper $52 - $54 support band. * **Operational Strategy:** The recommended short-term approach is "buy on dips, avoid chasing rallies." A light long position (under 30% capital) could be considered if HYPE shows stabilization signals at the $64-$66 or $52-$54 support zones, confirmed by model signals. Strict stop-loss discipline is emphasized. **General Risk Management:** A strict trailing stop-loss protocol is advised: set an initial stop; move to breakeven at +1% profit; lock in profits progressively thereafter. *Disclaimer: All analysis is presented as the author's personal technical perspective and trading log, not as investment advice. Markets are complex and dynamic; risk control is paramount.*

Odaily星球日报23m ago

Crucial Week of Contention: BTC Tests Support and HYPE's Key Level Battle | Special Analysis

Odaily星球日报23m ago

AI Agents Also Need 'Credit Checks': ERC-8126 is Filling the Gap in On-chain Trust

The article discusses ERC-8126, a proposed standard designed to address the lack of trust and verification for AI Agents operating on-chain. While ERC-8004 provides AI Agents with a basic on-chain identity (answering "Who are you?"), it does not guarantee trustworthiness. ERC-8126 aims to fill this gap by establishing a verification layer (answering "Are you reliable?"). It standardizes how independent verification providers can assess an agent's associated risks across five key areas: Token/Contract Verification (ETV), Media Content Verification (MCV), Solidity Code Verification (SCV), Web Application Verification (WAV), and Wallet Verification (WV). These providers generate a standardized risk score (0-100) and proofs based on their checks, without acting as a single authoritative certifier. This allows wallets, marketplaces, dApps, and other agents to consume these risk signals—for example, to display warnings, filter listings, or make interaction decisions. The standard also incorporates concepts like Private Data Verification (PDV) and Zero-Knowledge Proofs (ZKP) to allow verification without exposing sensitive underlying data. Positioned alongside ERC-8004 (Identity) and ERC-8183 (Commerce for agents), ERC-8126 represents a step toward building a verifiable and accountable infrastructure for the emerging on-chain AI Agent economy, shifting trust assessment from purely user-based judgment to standardized, consumable signals.

marsbit41m ago

AI Agents Also Need 'Credit Checks': ERC-8126 is Filling the Gap in On-chain Trust

marsbit41m ago

Rented Conviction: How Much Real Money Is Behind the Bitcoin ETF Flows

Borrowed Belief: How much of Bitcoin ETF flows are real money? Weekly Bitcoin ETF flows, often interpreted as a measure of institutional conviction, are heavily influenced by a hidden arbitrage trade rather than genuine directional buying. A cash-and-carry arbitrage, where traders buy the ETF while simultaneously shorting Bitcoin futures on the CME to lock in a basis spread (the price difference between futures and spot), drives roughly half of the week-to-week flow volatility. This delta-neutral activity appears as ETF inflows but is unrelated to price views. Data shows a strong correlation (0.70) between weekly ETF inflows and increases in hedge fund short positions on CME futures, while Bitcoin’s weekly price returns have almost no explanatory power. However, this arbitrage activity dominates short-term *fluctuations*, not the cumulative *stock* of investments. Of the total ~$55 billion in net ETF inflows since launch, only about $1 billion currently represents net arbitrage exposure. The vast majority consists of steady, directional buying averaging around $400 million per week. The arbitrage trade has been unwinding for two years, with hedge fund short positions peaking near $14 billion in late 2024 and declining to ~$4.5 billion. Recent ETF outflows partly reflect this ongoing unwind as the basis compresses, not a loss of faith in Bitcoin. Thus, ETF flows overstate the *volatility* of belief, not its *level*. The headline number is more a gauge of arbitrage desk activity than conviction. For accurate interpretation, monitor the CME basis relative to Treasury yields and hedge fund net shorts—these reveal how much of the reported “demand” is truly directional.

marsbit43m ago

Rented Conviction: How Much Real Money Is Behind the Bitcoin ETF Flows

marsbit43m ago

Trading

Spot
Futures

Hot Articles

Upland: Rebuilding the World in the Open Metaverse

The innovative gameplay of corresponding virtual properties in the Upland game to physical addresses of the real world has attracted many players.

28.6k Total ViewsPublished 2024.08.09Updated 2024.08.09

Upland: Rebuilding the World in the Open Metaverse

Discussions

Welcome to the HTX Community. Here, you can stay informed about the latest platform developments and gain access to professional market insights. Users' opinions on the price of OPEN (OPEN) are presented below.

活动图片