Natcats一周十倍,DMT概念小图片究竟是什么?

Odaily星球日报Published on 2024-03-01Last updated on 2024-03-01

Abstract

「基于比特币区块数据的生成艺术」

过去的一周,在比较不被人注意到的角落,有一个比特币生态的小图片项目在没有正式上架任何比特币 NFT 交易市场的情况下狂涨了 10 倍,目前 OTC 地板价来到了 0.08 比特币,这就是 Natcats。

Natcats一周十倍,DMT概念小图片究竟是什么?

Natcats

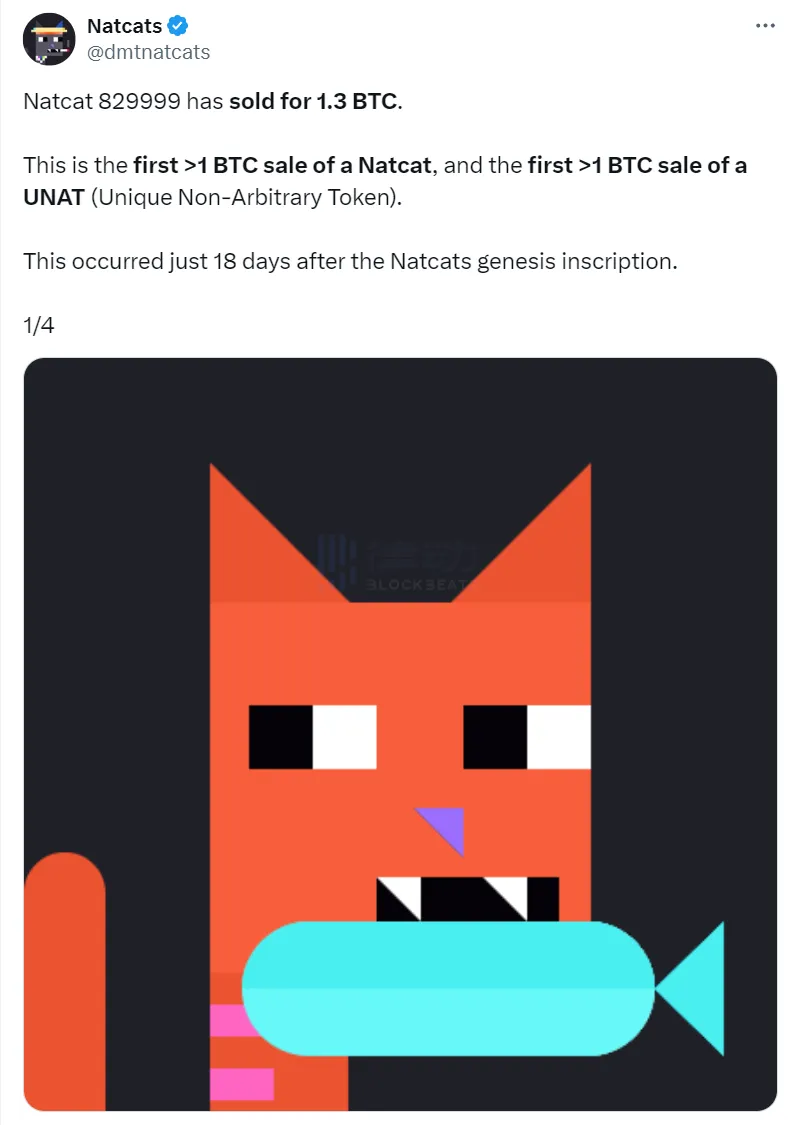
几天前,Natcats 829999 以 1.3 比特币的价格成交,成为目前单个成交价格最高的 Natcat。

Natcats一周十倍,DMT概念小图片究竟是什么?

而就在昨天,两个 DMT 概念的小图片项目 NATTRIBUTES 和 Natdogs 在 Magic Eden 上架后,都立马跻身成交量日榜。NATTRIBUTES 单日成交超过 11 比特币,Natdogs 单日成交超过 5 比特币。

什么是 DMT 概念小图片呢?

DMT 理论

大家熟知的 Bitmap 就是 DMT 理论的应用。这个理论看文档是挺晦涩的,简而言之,比特币区块链中有很多种类的数据,比如区块哈希值、区块大小、区块高度、区块目标难度等等。基于这些数据来创造特定的数字资产,是 DMT 理论希望实现的目的。

Natcats一周十倍,DMT概念小图片究竟是什么?

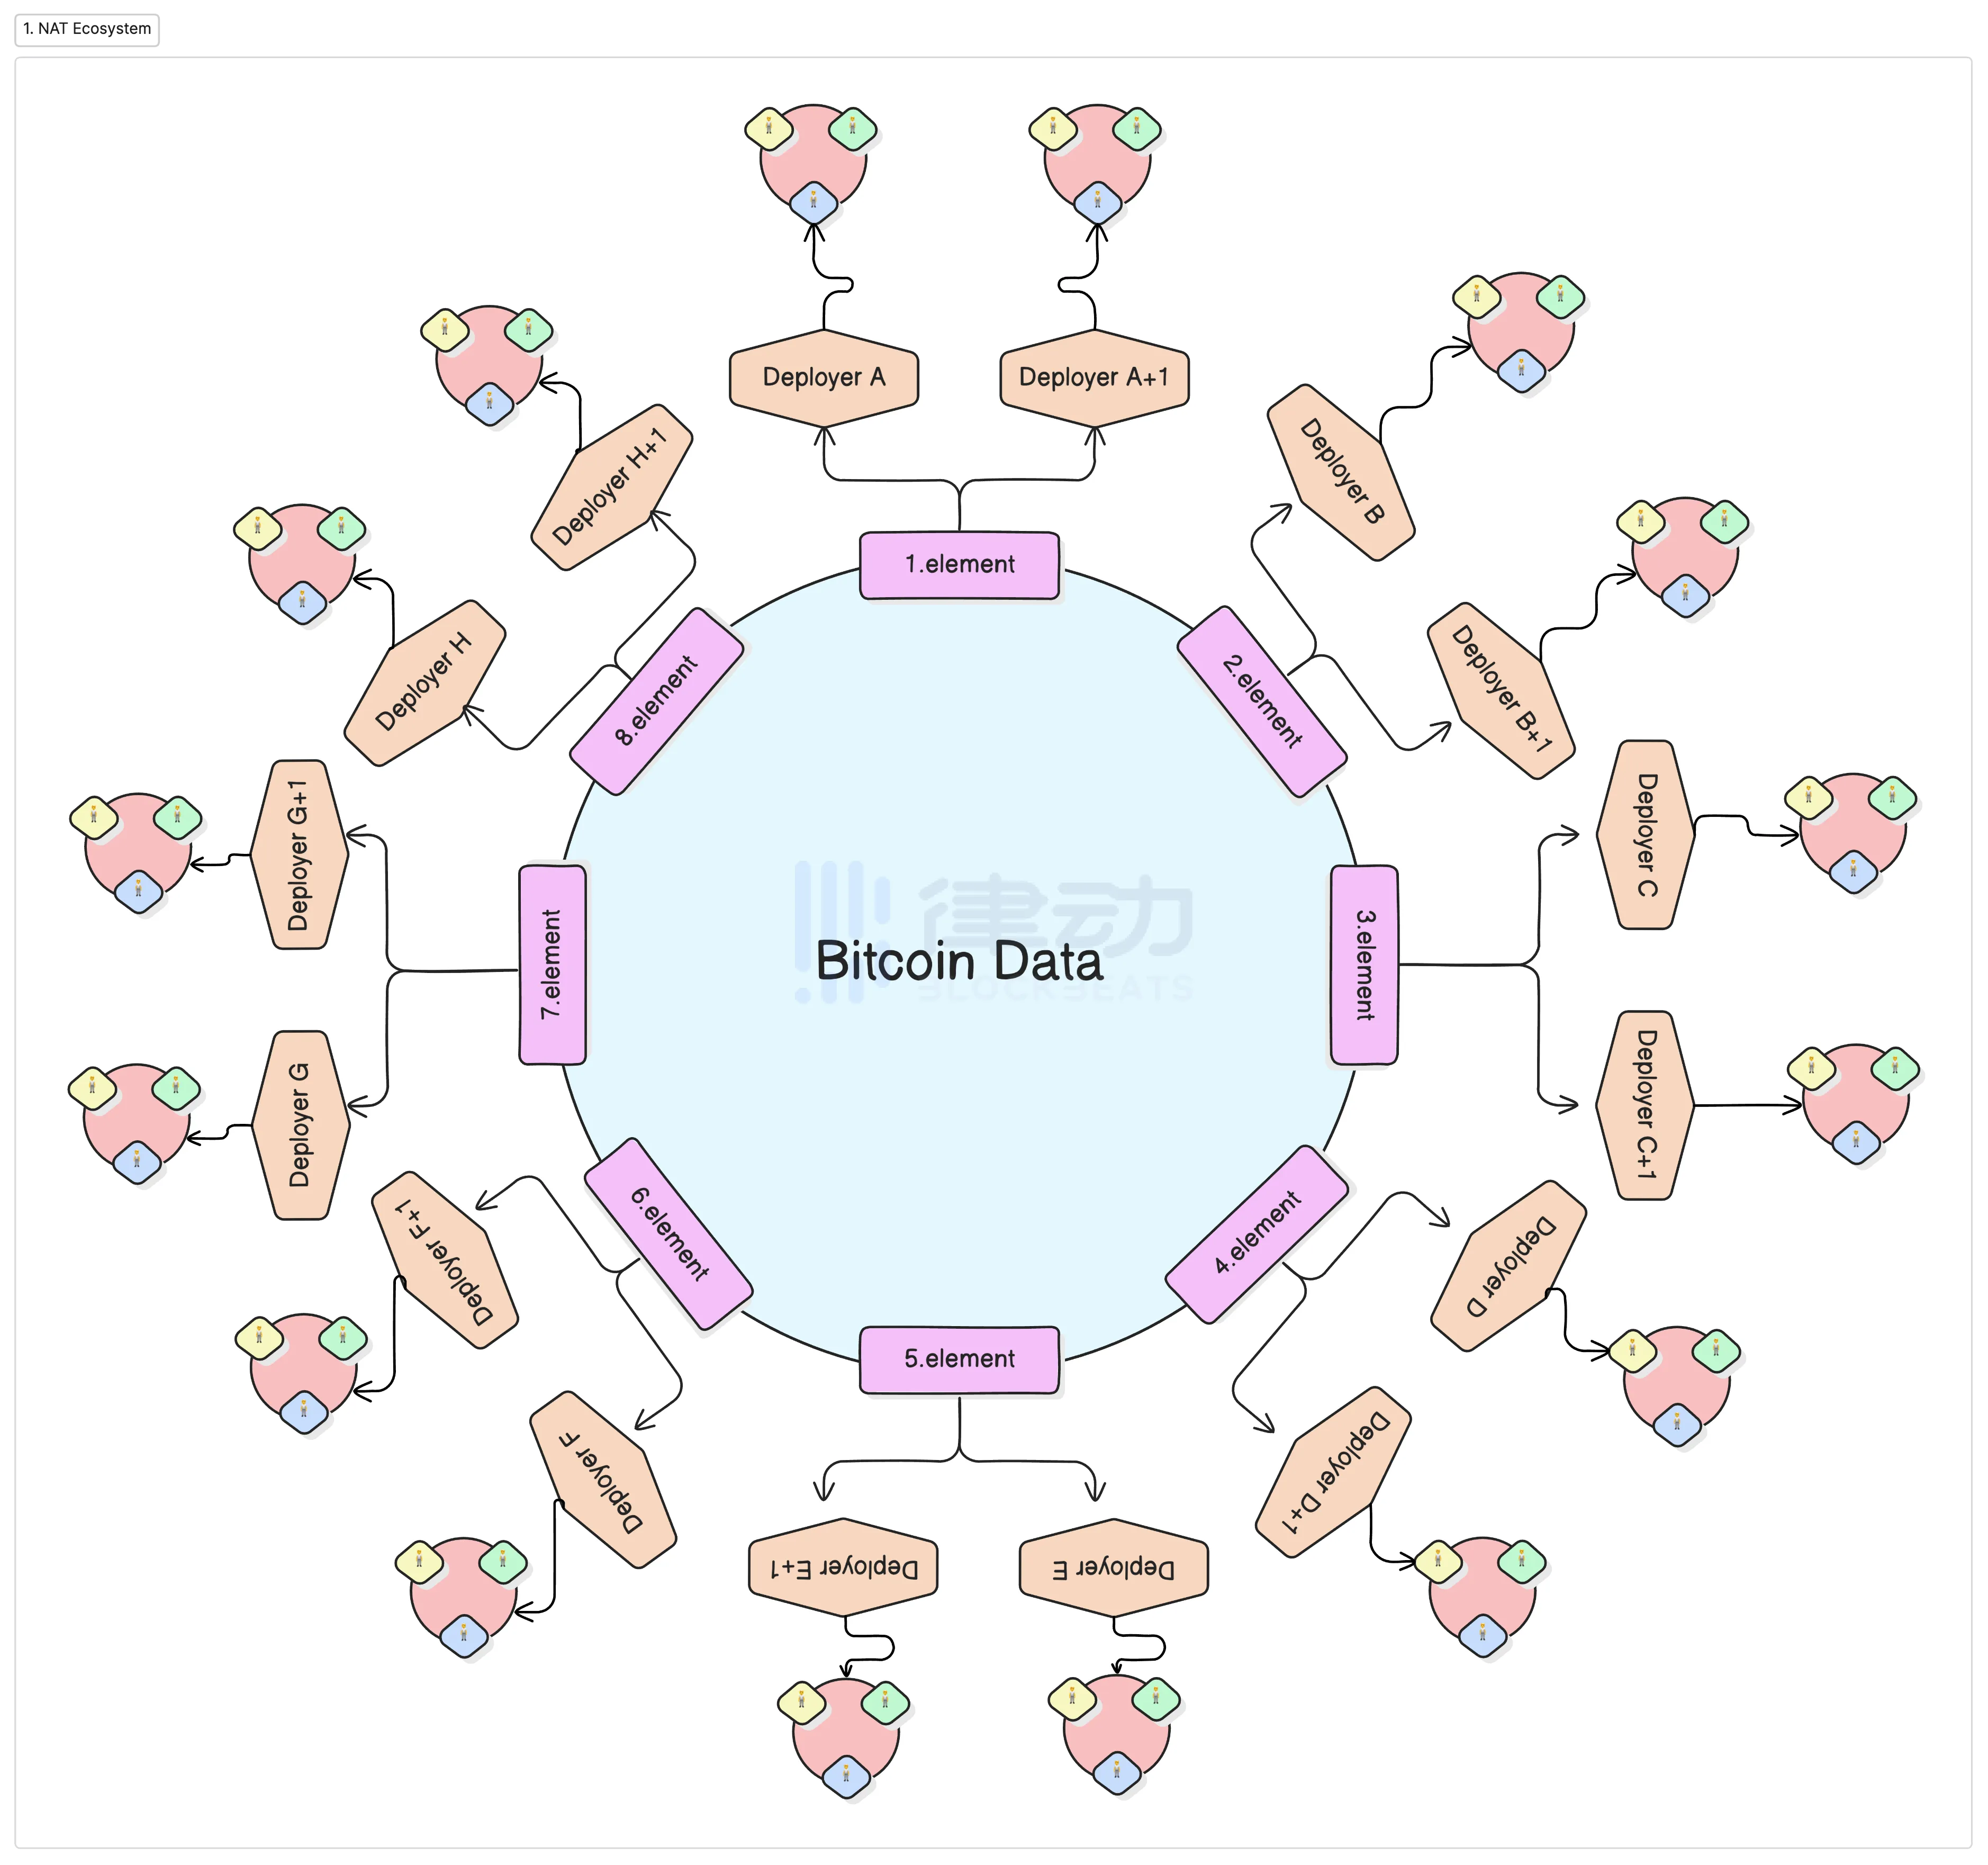
每个人会如何利用比特币区块链的数据来创造特定的数字资产?这个挖掘比特币区块链数据价值的过程,就像在自然界中发现化学元素。同种数据类型下可以注册多种「元素」,但元素不可以重名,相当于同种类型的数据可以有多种使用方法。

第一个被注册且命名的「元素」是 DMT,该「元素」利用的是比特币的区块目标难度数据,而 Natcats、NATTRIBUTES 和 Natdogs 都使用了该「元素」,即利用比特币的区块目标难度数据来创造小图片。那么 Natcats 具体又是如何使用该「元素」的呢?

Natcats 的创造过程

首先,你看到的 DMT 小图片都是代码渲染后的结果。现在您如果到 Magic Eden 上查看 NATTRIBUTES 和 Natdogs 的合集,会发现是这样的:

Natcats一周十倍,DMT概念小图片究竟是什么?

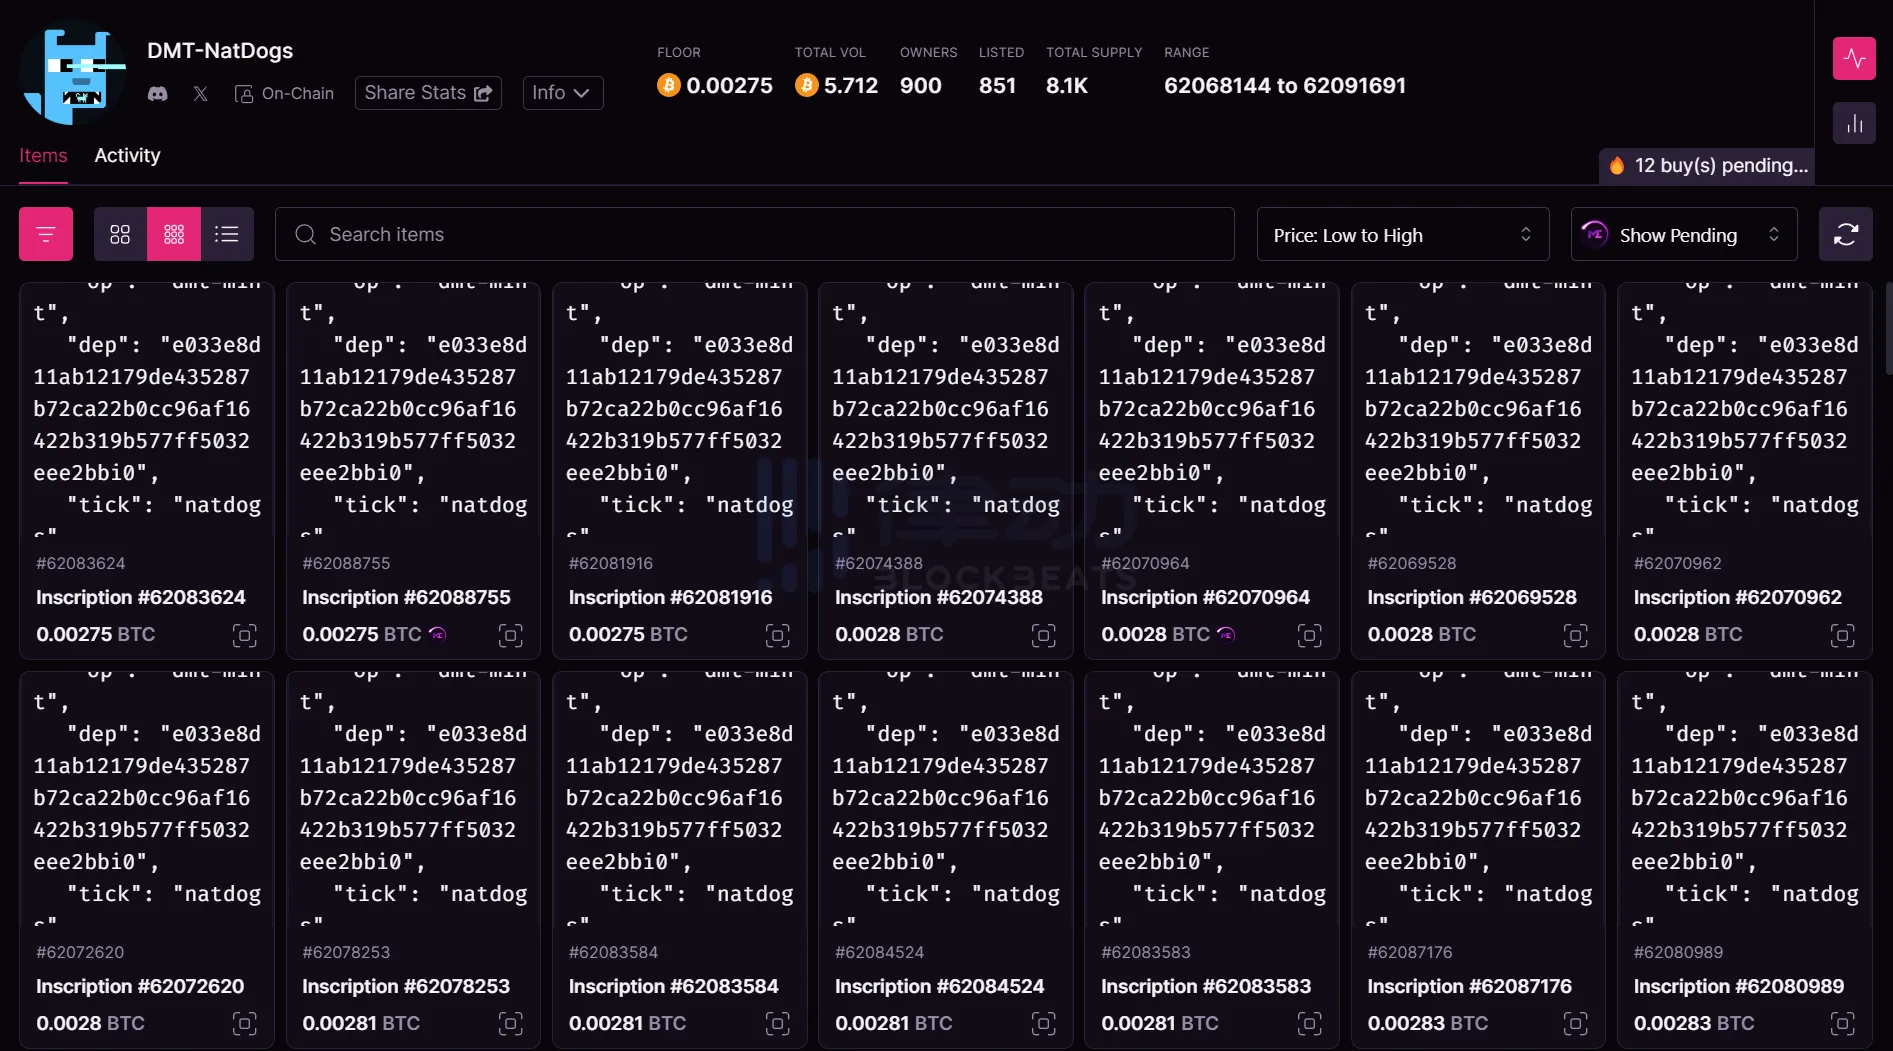
这是因为 Magic Eden 在前端还没有支持 DMT 小图片渲染。和「递归铭文」有些相似,现在你看到的大部分比特币小图片实际上都是层层指针调用内容、根据代码渲染后的结果。

Natcats一周十倍,DMT概念小图片究竟是什么?

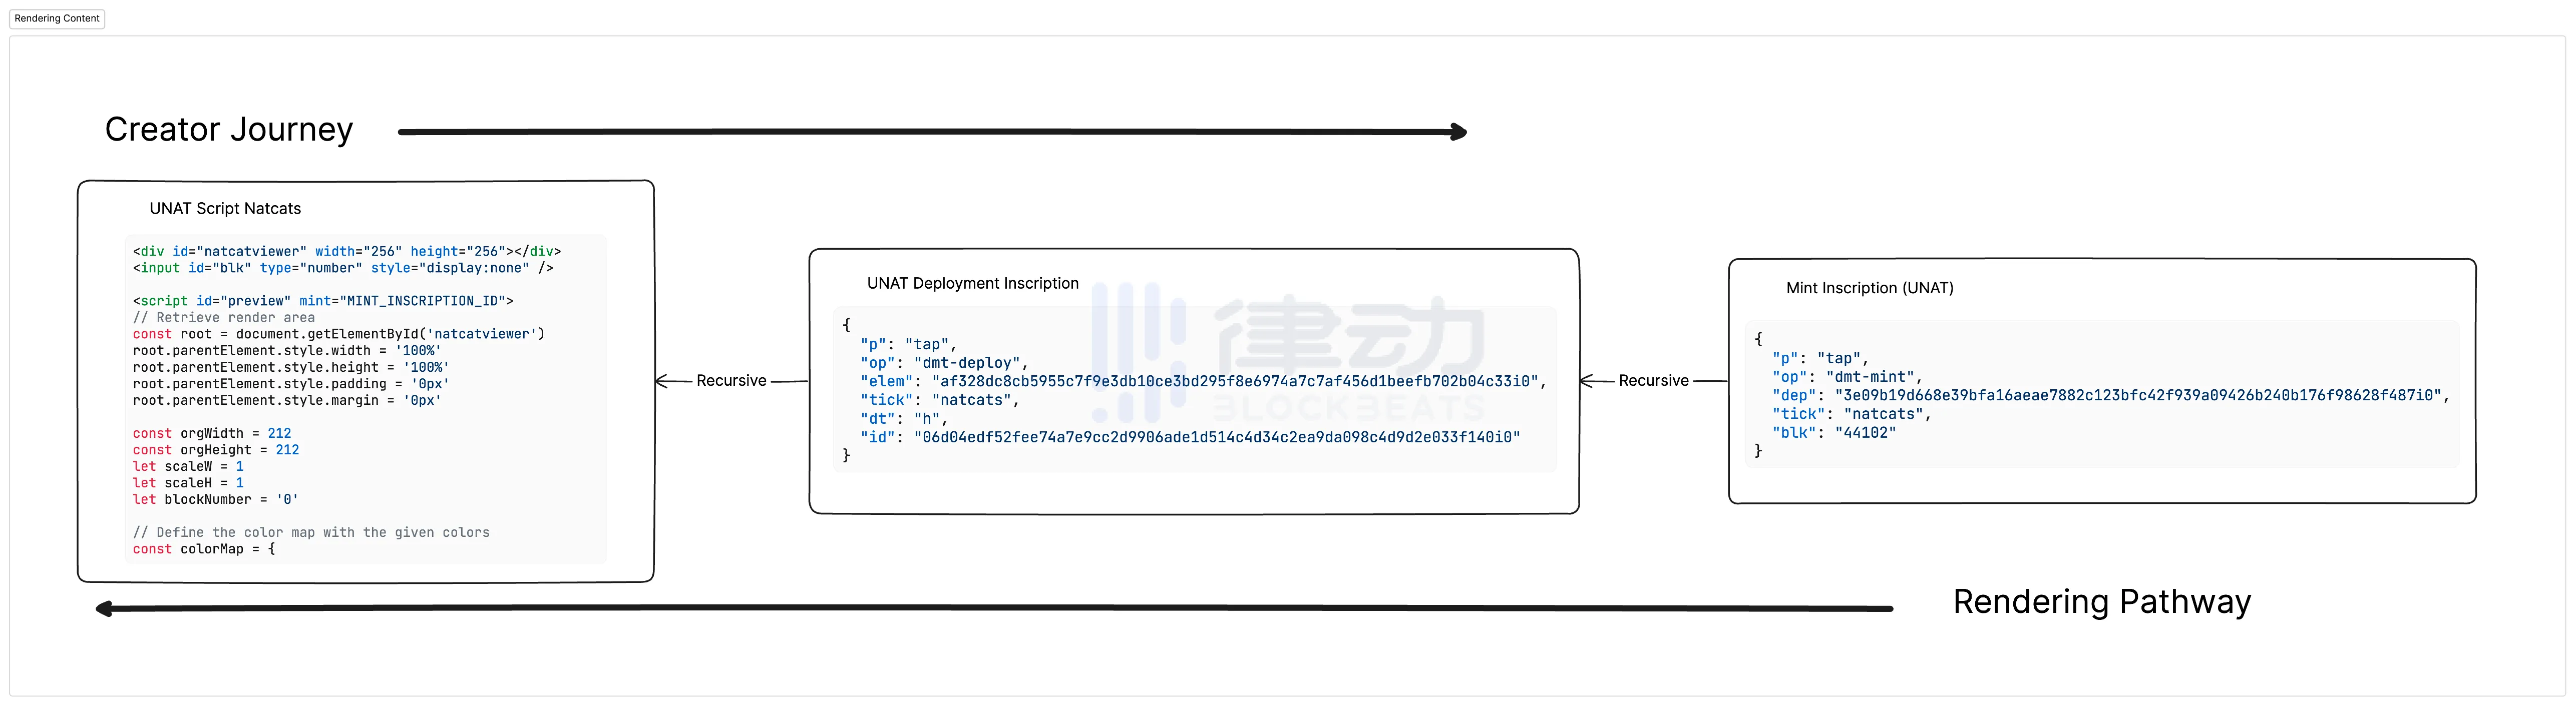
上图从左到右分别是渲染 Natcats 图像的渲染代码(以 JavaScript 形式刻录到了链上)、Natcats 部署铭文以及 Natcats 铸造铭文。铸造铭文中的「dep」字段指向部署铭文,而部署铭文中的「id」字段又指向了包含图像渲染代码的链上铭文。

您可以这么理解:根据链上的数据指向,Natcats 是根据特定的脚本来生成图像的,但是需要做额外的工作把代码运行的结果展现出来,毕竟比特币自己是不会做这个事情的。我们通常把这个过程叫作「索引」,比如将 BRC-20 的余额展现在您的眼前,就需要「索引器」的工作,再把正确的结果显示到您的浏览界面。

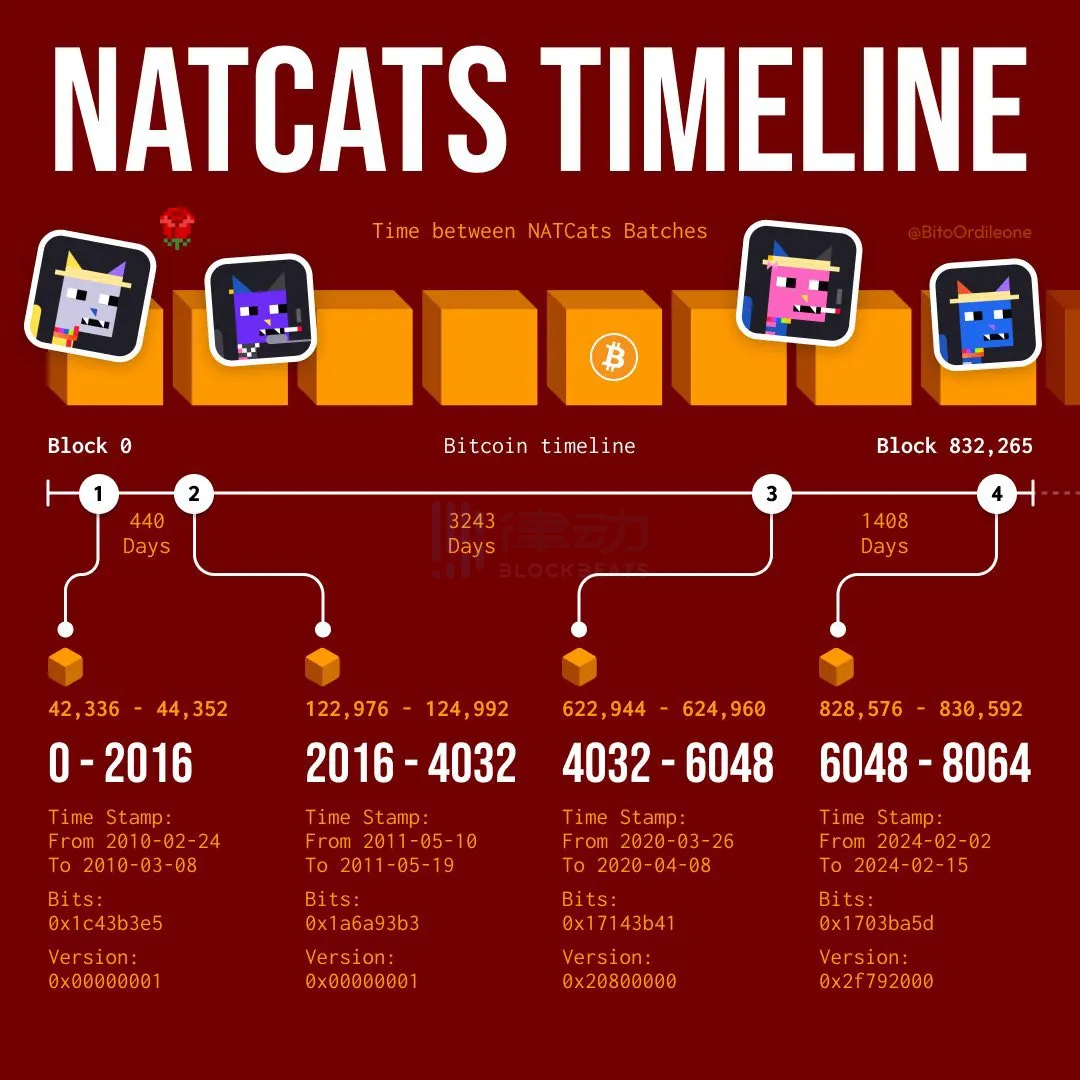
现在来解释 Natcats 是如何利用比特币的区块目标难度数据来创造小图片。和 Bitmap 相似,一个 Natcats 对应一个区块,但是 Natcats 在区块数据的要求上做了限制条件——只有比特币的区块目标难度数据(16 进制字段)中包含了「 3 b」,该区块铸造出的 Natcats 才会被认作是有效的。

比特币的区块目标难度数据每 2016 个区块调整一次(大概 2 周),而出现「 3 b」,目前在比特币历史上只有 4 次,每次 2016 个区块,所以目前 Natcats 的总供应量就是 2016* 4 = 8064 个。至于以后还会不会出现这样的区块,尚未可知,可能以后还会出现新的「 3 b」区块,那就会有新的 Natcats 可供铸造。

Natcats一周十倍,DMT概念小图片究竟是什么?

以上只是决定了 Natcats 是否可以「诞生」,而决定 Natcats 的「基因」(即 Natcats 长什么样),是根据其生成区块的区块高度来决定的。比如,您「占领」了区块高度为 123008 的「 3 b」区块(即使用该区块来铸造一只 Natcat),因为该区块高度包含了「 00 」,那么这只 Natcat 就会有耳环。

特征的生成规则细讲下去比较复杂,比如耳环的颜色又根据区块高度第 3 位数字的不同而有变化,但都是这样的思路。也因此,有一些特征在现在还没有被生成出来,比如区块高度中包含「 00000 」的 Natcat 会有一个外星人皇冠。总之,因为「 3 b」区块啥时候出现不可预测,其区块高度也就不可预测,从系列供应量到特征稀有性都存在着未知。因此 Natcats 也被称为是「基于比特币区块数据的生成艺术」。

NATTRIBUTES 和 Natdogs 的逻辑总体上和 Natcats 也是一样的,只是在具体的规则上有不同,这里就不再赘述了。

结语

最后再提醒大家一次,Natcats 截止目前还没有正式上架任何比特币 NFT 交易市场。Ordinals Wallet 上虽然有合集,但很明显是不完整的,现在大部分交易都在其官方 Discord 以 OTC 形式进行。

而 NATTRIBUTES 和 Natdogs 在 Magic Eden 上已经被 FOMO 过了。投资有风险,大家需要万分谨慎。

Related Reads

Report Interpretation: J.P. Morgan Details Micron's Pre-Earnings Sentiment, Current Hardware Sector Dynamics

Morgan Stanley analyst Joshua Meyers' report (June 21, 2026) highlights key trends in the hardware and semiconductor sector ahead of Micron's earnings. The core takeaways are: 1. **Micron & Memory:** Memory remains a high-conviction long theme, driven by strong AI demand and rising ASPs. However, investor focus is shifting to the sustainability of Micron's >80% gross margins and the specifics of potential new long-term supply agreements (SCAs). 2. **Hardware Supply Chain:** AI-related demand for servers, networking, and storage remains robust, but company performance is diverging. Celestica (CLS) shows improved margin confidence, Western Digital and Seagate benefit from pricing, Fabrinet (FN) sees predictable AI optics growth, and Teradyne (TER) anticipates a new Google customer. 3. **AI Capex & WFE Forecasts:** JPMorgan increased its Wafer Fab Equipment (WFE) market growth forecasts to 28% in 2026 and 29% in 2027. AI infrastructure financing is evolving, with higher project-level debt reducing constraints on capex expansion. The report signals that while the AI-driven hardware cycle is strong, the market is entering a phase focused on execution verification (e.g., Micron's SCA details, Fabrinet's ramp with Amazon) and valuation sustainability. Key near-term signals include Micron's guidance, Arista Networks' outlook, and the pace of demand normalization post potential tariff-related pull-ins.

marsbit3h ago

Report Interpretation: J.P. Morgan Details Micron's Pre-Earnings Sentiment, Current Hardware Sector Dynamics

marsbit3h ago

Research Report Analysis: The Fed's New Chair's Debut – New Leader, But Same Script?

Report Analysis: Federal Reserve's New Chair Debut – A New Captain, But the Same Script? Morgan Stanley's chief global economist Seth B. Carpenter analyzes the first FOMC meeting under new Fed Chair Kevin Warsh in a June 21 report. Warsh deliberately avoided providing forward guidance on interest rates, aligning with his philosophy. However, market expectations for a rate hike this year were reinforced. Key signals lie elsewhere: inflation may fall more than expected, and quantitative tightening (QT) could be more aggressive than anticipated. The FOMC's "dot plot" suggests only one rate hike in 2026. Carpenter argues that if inflation undershoots forecasts, the logic for even a single hike weakens, especially as projections indicate potential rate cuts in 2027. On QT, Warsh's stance is clear. Carpenter notes that measures like halving the Treasury's account balance could shrink the Fed's balance sheet by around $500 billion with minimal market impact. Combined with adjustments to reserve interest and liquidity rules, the ultimate QT scale may exceed expectations, though its market effect might be less disruptive unless the Fed actively sells Mortgage-Backed Securities (MBS). While Warsh initiated a review of the Fed's policy framework, the 2% inflation target remains intact for now. The report concludes that the market may be overestimating the significance of reduced forward guidance and the near-term rate hike risk, while potentially underestimating the scope and manageable nature of the coming balance sheet reduction. The key debates will hinge on upcoming core PCE data, the specifics of the QT path, and the framework review's findings.

marsbit3h ago

Research Report Analysis: The Fed's New Chair's Debut – New Leader, But Same Script?

marsbit3h ago

Critical Game Week: BTC Retracement Confirmation vs. HYPE Support Battle | Guest Analysis

This weekly analysis outlines a critical juncture for BTC and HYPE markets, focusing on key price level confirmations. **BTC Analysis:** BTC is at a pivotal point after a five-wave rally from the June 5th low of $59,100. The price has broken below a short-term rising channel's lower boundary, with the current move seen as a pullback to test this breakdown. Failure to reclaim this level could lead to a retest of the $59,000-$60,000 support zone. The core scenario hinges on this channel retest outcome. * **Key Levels:** Resistance at $64,500-$65,000 (channel boundary) and $69,500-$70,500. Support at $59,000-$60,000 and $55,000. * **Strategy:** A core bearish stance is maintained (20% short from last week), with short-term plans for tactical trades. Three detailed contingency plans (A/B/C) are provided for short positions on resistance tests or breakdowns, emphasizing strict stop-loss discipline. **HYPE Analysis:** HYPE shows strong momentum but is currently in a corrective phase after hitting a new high of $76.94. The price is retesting the crucial $64-$66 support area. * **Key Levels:** Resistance near $77 and $80-$82. Support at $64-$66 and $52-$54. * **Strategy:** The short-term approach is "buy on dips, avoid chasing rallies." A long position is considered only if clear stabilization signals appear at the $64-$66 or deeper $52-$54 support zones, with tight risk controls. **General Risk Management:** A standardized trailing stop-loss protocol is emphasized: set initial stop, breakeven at +1% profit, then trail stops upward to lock in gains. *Disclaimer: All analysis is presented as a personal trading framework, not investment advice. Market conditions are complex and require dynamic adjustment.*

marsbit3h ago

Critical Game Week: BTC Retracement Confirmation vs. HYPE Support Battle | Guest Analysis

marsbit3h ago

Trading

Spot
Futures
活动图片