Violent Attacks On Crypto Holders Escalate Worldwide, Data Shows

bitcoinist發佈於 2026-01-06更新於 2026-01-06

文章摘要

Data shows a significant escalation in violent "wrench attacks" – physical robberies and kidnappings targeting cryptocurrency holders to force asset transfers – both in frequency and severity worldwide. Security researcher Haseeb Qureshi analyzed an incident database maintained by Jameson Lopp, finding 269 categorized attacks, with over half classified as "Serious" and 5% as "Fatal." The data indicates attacks are becoming more violent over time, with 2025 showing the highest incident count. Approximately 45% of the variation in attacks is explained by crypto market capitalization, meaning higher prices correlate with more incidents. However, when normalized per user (using Coinbase active users as a proxy), attack rates spiked in earlier market cycles, fell after 2019, and have recently risen again toward 2021 levels. Geographically, Western Europe and North America have the most incidents, but Latin America and Africa have significantly higher fatality rates. Notably, zero fatal attacks have occurred in North America. Researchers warn these events are transitioning from rare occurrences to a recurring risk for crypto participants.

Violent “wrench attacks” against crypto holders, physical robberies and kidnappings meant to force victims to hand over coins, appear to be rising in absolute terms and trending more severe, according to a new visualization built from a long-running incident database maintained by security researcher Jameson Lopp.

Dragonfly partner Haseeb Qureshi said he analyzed Lopp’s dataset and built an interactive dashboard to stress-test a question many traders and builders have been asking quietly for years: is simply holding crypto becoming physically more dangerous? “You’re not imagining it: the number of attacks has been increasing over time,” Qureshi wrote on X. “Not only that, the attacks are getting more violent.”
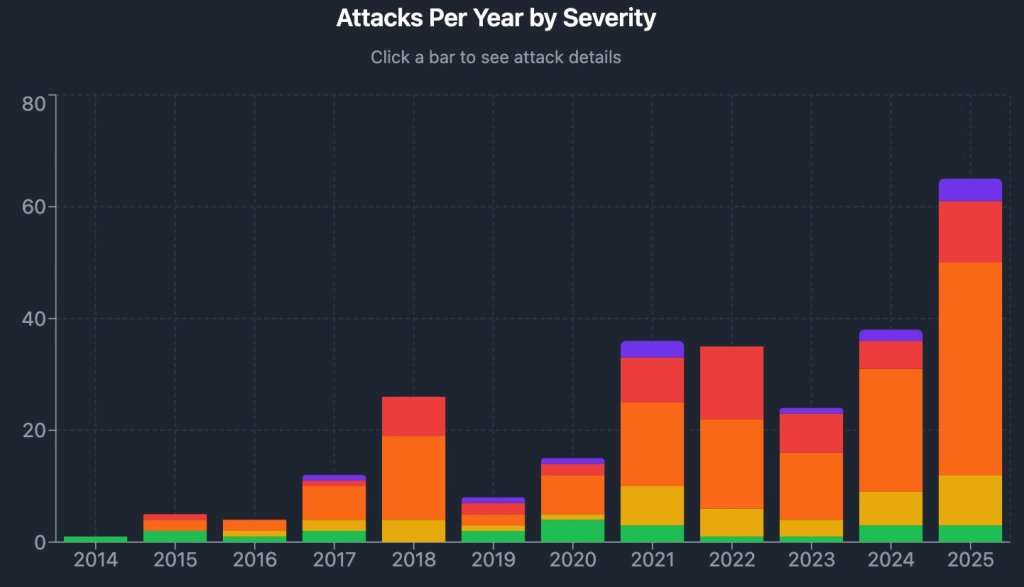
Attacks per year by severity | Source: X @hosseeb

The dashboard breaks reported incidents into five severity bands — Minor, Moderate, Serious, Severe, and Fatal and the distribution skews heavily toward the sharp end of the spectrum. Of 269 categorized incidents shown, 137 (51%) were labeled “Serious,” 57 (21%) “Severe,” and 13 (5%) “Fatal,” with the remainder split between 39 (14%) “Moderate” and 23 (9%) “Minor.”

The year-by-year bars show the later years carrying a larger share of “Severe” and “Fatal” outcomes than the early history of the dataset, with 2025 appearing as the highest-incident year on the chart.
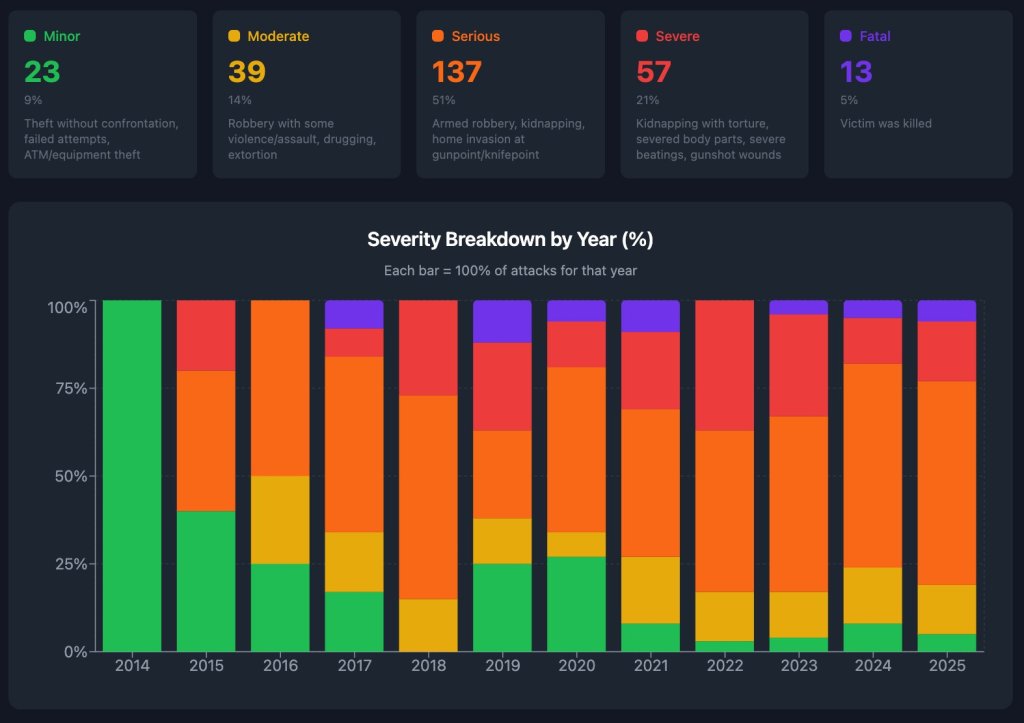
Severity breakdown by year | Source: X @hosseeb

Qureshi’s analysis also puts a number on the most intuitive driver: price. Charting incidents against total crypto market capitalization, he reported a simple regression with an R2 of 0.45 — implying roughly 45% of the variation in reported violence is explained by market cap alone. In plain terms, higher prices coincide with more attacks.

But the more consequential question for everyday holders is not raw counts; it’s risk per person. Because comprehensive “number of crypto users” data is hard to pin down, Qureshi used Coinbase monthly active users as a proxy, and separately normalized incidents by market cap to approximate attacks per dollar of wealth.

The resulting “normalized attack rates” chart tells a less linear story: per-user attack rates spiked in earlier market eras (notably around 2015 and again in 2018), then fell sharply after 2019, before ticking higher in the most recent observations. “So is that it?” Qureshi asked. “Proof crypto is becoming more physically dangerous?”
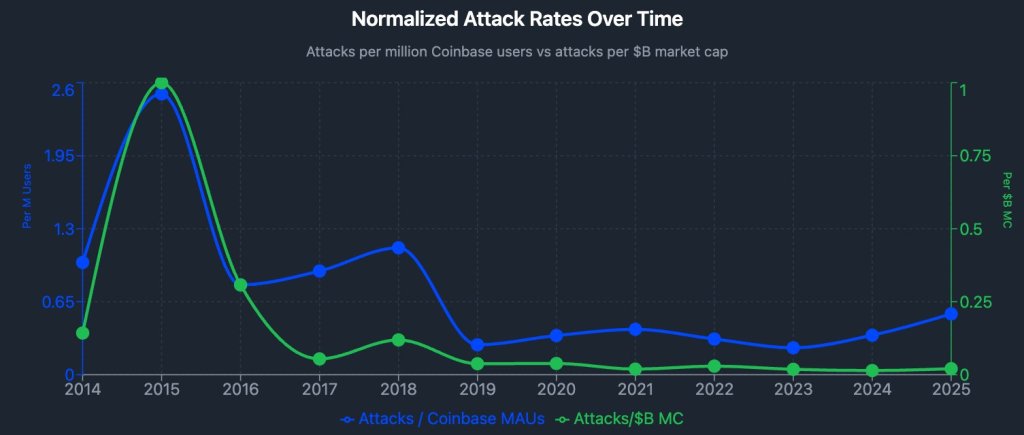
Normalized attack rate over time | Source: X @hosseeb

On his telling, not quite. Coinbase MAUs, he noted, expanded dramatically over the decade, while normalized attack rates did not rise proportionally, suggesting a meaningful “population effect” behind the higher headline totals. Still, the per-user line has moved up from its post-2019 lows, roughly back toward the levels seen during the 2021 cycle, even as the “attacks per $ of market cap” line remains comparatively flat in recent years.

Geography adds another uncomfortable layer. A regional table in the dashboard shows Western Europe (73 attacks) and North America (64) as the two largest buckets by incident count, with Asia-Pacific also substantial (53). But the most lethal outcomes cluster elsewhere: Latin America shows a 21% fatality rate and Africa 17%, versus 0% in North America. Qureshi underscored that point directly: “Notably, there have been 0 fatalities in North America ever,” he wrote, adding that the “lion’s share” of fatalities are in Latin America and Africa.
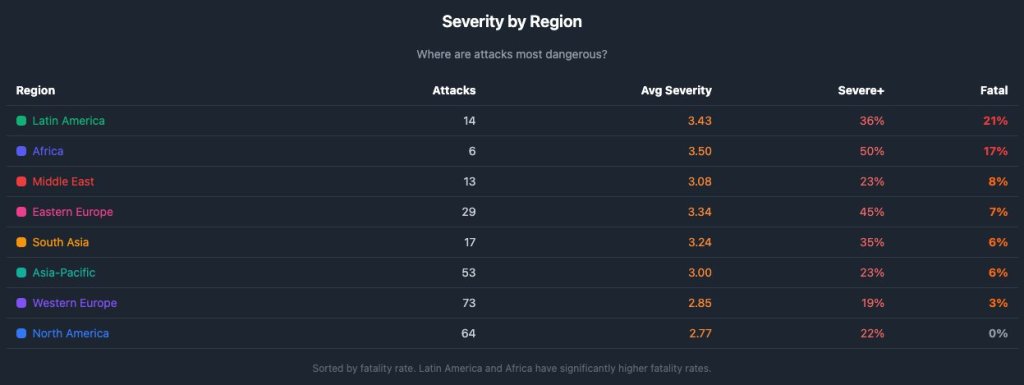
Severity by region | Source: X @hosseeb

Lopp, who has maintained the underlying “Bitcoin Wrench Attack” archive for years, has warned the workload and frequency are becoming harder to treat as isolated incidents. “When an event goes from being rare to happening every few days, it’s no longer newsworthy — it’s just a fact of life,” he wrote in a Dec. 21 post cited in the thread, while inviting others to help maintain the database.

At press time, the total crypto market cap stood at $3.12 trillion.
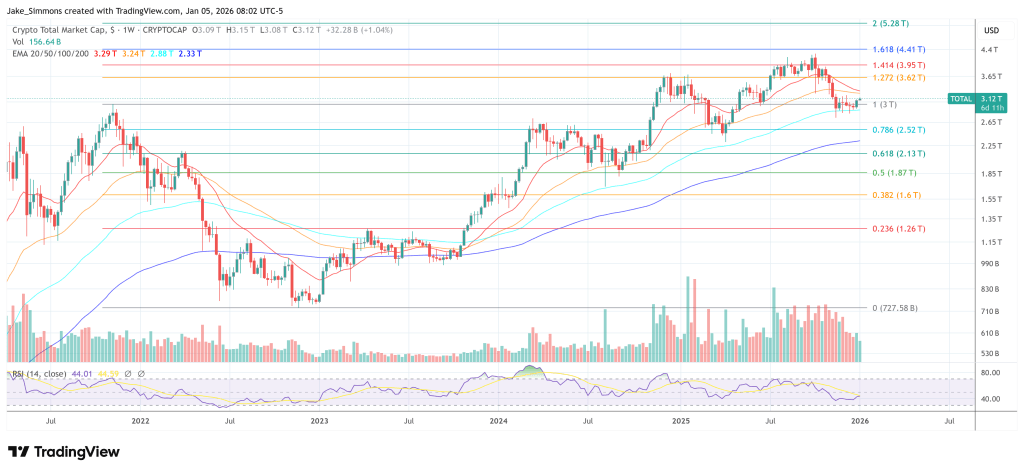
Total crypto market cap recovers above the 2021 high, 1-week chart | Source: TOTAL on TradingView.com

相關問答

QAccording to the analysis, what is the relationship between crypto market capitalization and violent attacks?

AThe analysis shows a correlation between higher crypto prices and increased attacks, with a regression R2 of 0.45 indicating that approximately 45% of the variation in reported violence is explained by market cap alone.

QWhich regions have the highest fatality rates in crypto-related attacks, according to the data?

ALatin America has a 21% fatality rate and Africa has a 17% fatality rate in crypto-related attacks, while North America has recorded 0% fatalities.

QWhat does the normalized attack rate analysis reveal about per-user risk over time?

AThe normalized attack rate shows that risk per user spiked in earlier market eras (2015 and 2018), fell sharply after 2019, but has recently ticked higher toward 2021 levels, though it didn't rise proportionally to the dramatic expansion of crypto users.

QHow are the severity of attacks distributed across the 269 incidents analyzed?

AThe severity distribution is heavily skewed toward serious outcomes: 51% were 'Serious', 21% 'Severe', 5% 'Fatal', 14% 'Moderate', and 9% 'Minor'.

QWhat trend does Jameson Lopp observe regarding the frequency of these attacks?

AJameson Lopp notes that attacks have moved from being rare events to happening every few days, making them 'no longer newsworthy' but rather 'a fact of life' in the crypto space.

你可能也喜歡

福建晋江,一家存储超级独角兽静悄悄

近日,随着长鑫科技A股上市成为股王,同为国内三大存储芯片项目之一的福建晋华集成电路有限公司(晋华)重新进入公众视野。这家位于福建晋江的DRAM企业,自2016年成立起便肩负打破海外垄断的使命,却因2018年被美国列入实体清单并遭遇司法指控而陷入长达数年的沉寂。2024年2月,美国法院裁定其无罪,晋华才得以摆脱法律阴影。 晋华的曲折发展与灵魂人物陈正坤密不可分。这位拥有美光与联电背景的工程师,怀揣自主开发DRAM的梦想加入晋华。公司初期通过与联电合作快速推进,但随后美光发起诉讼,指控技术窃密,导致晋华产线因设备禁运而停摆。在极端困难下,陈正坤带领团队改造国产设备、重构工艺,艰难维持运营。尽管最终赢得清白,但发展进度已被严重拖慢。目前,晋华专注于利基型DRAM市场,月产能约4万片,拥有千余项专利,但仍在美国实体清单限制之下。 晋江这座以鞋服闻名的民营经济强市,为引入晋华这一“硬科技”项目投入巨资,并以政府基金、全链条配套和持续的政策支持,助力企业在制裁中生存下来。如今,以晋华为龙头,晋江已形成超千亿规模的集成电路产业集群。在全球AI驱动存储繁荣的周期中,晋华虽规模尚小,但其在封锁中重建的经历,已成为中国存储产业自主攻坚的缩影。

marsbit49 分鐘前

福建晋江,一家存储超级独角兽静悄悄

marsbit49 分鐘前

《夏季拉锯战》仍在继续:突破67000美元将是比特币上涨的起点

比特币价格在8月1日跌至62,217美元,延续了自6月5日开始的盘整格局。目前比特币被困在58,000至67,000美元的区间内,市场参与者对下一步走向存在分歧。 技术分析显示关键价位在60,000美元和67,000美元。交易员Crypto Candy认为,只要价格低于66,000美元,就可能跌向60,000美元或更低。投资者Jelle则将当前市场比作“夏季拉锯战”,坚持定期买入的平均成本策略。 上行突破的关键在于能否站稳67,000美元以上。交易员Daan Crypto Trades认为,若无法突破此位,市场可能继续盘整。交易员Roman则预测,若伴随足够交易量有效突破67,000美元,价格可能快速上涨至70,000-80,000美元区间。 宏观分析师Gert van Lagen从更长周期观察,认为比特币正在测试一个持续七年之久的“杯柄形态”的颈线位,市场恐惧情绪在盘整中逐渐消退。他强调,长期持有者仍未出现投降迹象,NUPL指标显示他们远未进入抛售区域。 总而言之,市场共识是比特币正处于积累阶段,60,000美元和67,000美元是关键水平,对任一水平的突破都将决定资产的下一个方向。当前围绕67,000美元的博弈,也反映出短期持有者盈亏平衡点附近的心理压力。近期价格在利好新闻后迅速回落,表明市场叙事尚未转化为持续的资本流入,能否构建更稳固的上涨基础仍有待观察。

cryptonews.ru2 小時前

《夏季拉锯战》仍在继续:突破67000美元将是比特币上涨的起点

cryptonews.ru2 小時前

交易

現貨
活动图片