Violent “wrench attacks” against crypto holders, physical robberies and kidnappings meant to force victims to hand over coins, appear to be rising in absolute terms and trending more severe, according to a new visualization built from a long-running incident database maintained by security researcher Jameson Lopp.
Dragonfly partner Haseeb Qureshi said he analyzed Lopp’s dataset and built an interactive dashboard to stress-test a question many traders and builders have been asking quietly for years: is simply holding crypto becoming physically more dangerous? “You’re not imagining it: the number of attacks has been increasing over time,” Qureshi wrote on X. “Not only that, the attacks are getting more violent.”
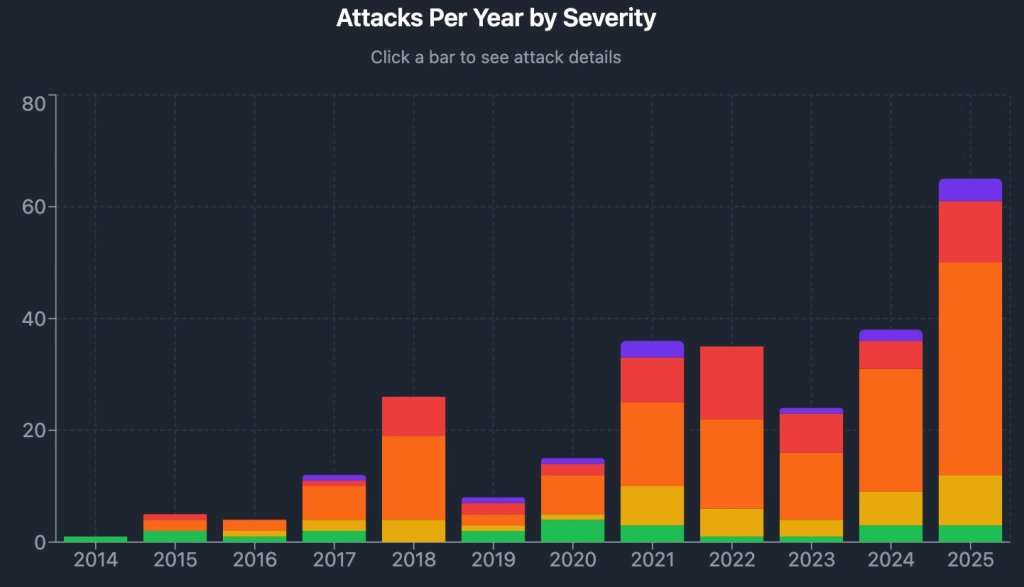
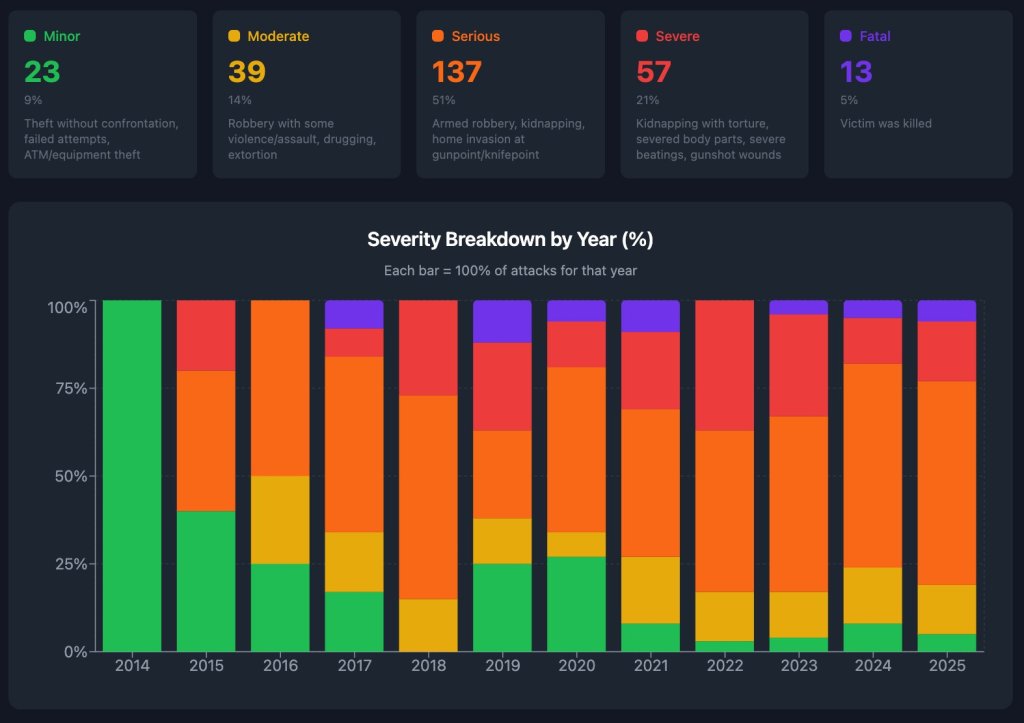
The dashboard breaks reported incidents into five severity bands — Minor, Moderate, Serious, Severe, and Fatal and the distribution skews heavily toward the sharp end of the spectrum. Of 269 categorized incidents shown, 137 (51%) were labeled “Serious,” 57 (21%) “Severe,” and 13 (5%) “Fatal,” with the remainder split between 39 (14%) “Moderate” and 23 (9%) “Minor.”
The year-by-year bars show the later years carrying a larger share of “Severe” and “Fatal” outcomes than the early history of the dataset, with 2025 appearing as the highest-incident year on the chart.
Qureshi’s analysis also puts a number on the most intuitive driver: price. Charting incidents against total crypto market capitalization, he reported a simple regression with an R2 of 0.45 — implying roughly 45% of the variation in reported violence is explained by market cap alone. In plain terms, higher prices coincide with more attacks.
But the more consequential question for everyday holders is not raw counts; it’s risk per person. Because comprehensive “number of crypto users” data is hard to pin down, Qureshi used Coinbase monthly active users as a proxy, and separately normalized incidents by market cap to approximate attacks per dollar of wealth.
The resulting “normalized attack rates” chart tells a less linear story: per-user attack rates spiked in earlier market eras (notably around 2015 and again in 2018), then fell sharply after 2019, before ticking higher in the most recent observations. “So is that it?” Qureshi asked. “Proof crypto is becoming more physically dangerous?”
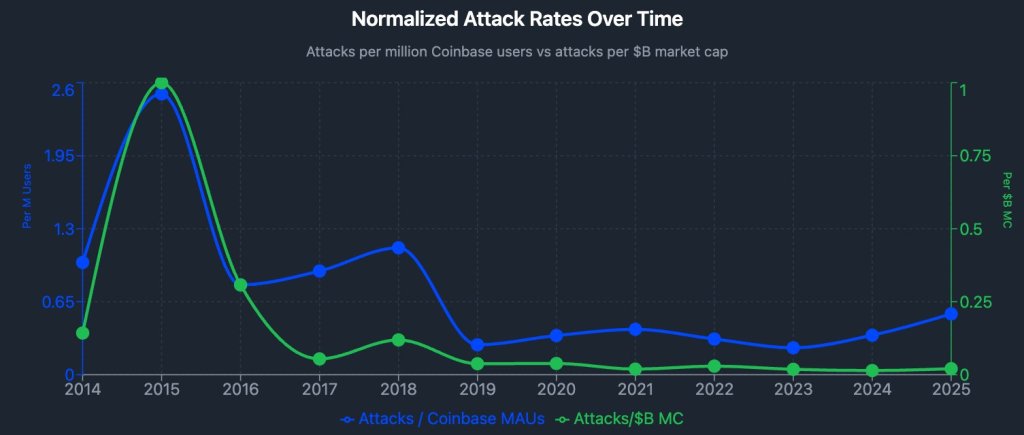
On his telling, not quite. Coinbase MAUs, he noted, expanded dramatically over the decade, while normalized attack rates did not rise proportionally, suggesting a meaningful “population effect” behind the higher headline totals. Still, the per-user line has moved up from its post-2019 lows, roughly back toward the levels seen during the 2021 cycle, even as the “attacks per $ of market cap” line remains comparatively flat in recent years.
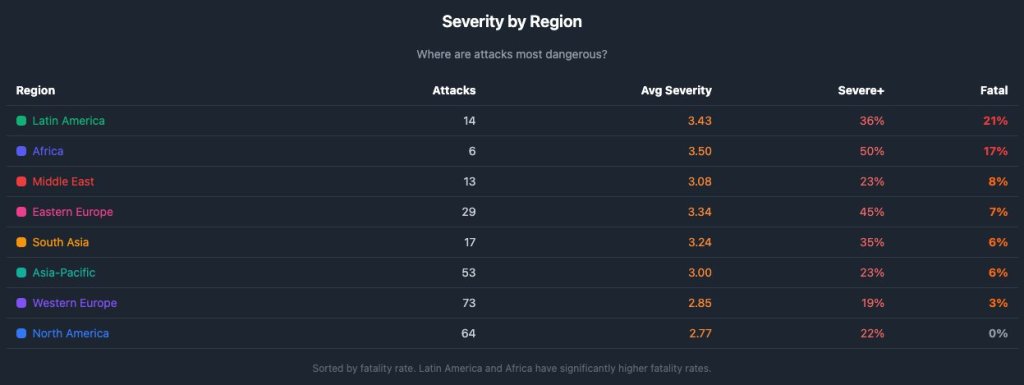
Geography adds another uncomfortable layer. A regional table in the dashboard shows Western Europe (73 attacks) and North America (64) as the two largest buckets by incident count, with Asia-Pacific also substantial (53). But the most lethal outcomes cluster elsewhere: Latin America shows a 21% fatality rate and Africa 17%, versus 0% in North America. Qureshi underscored that point directly: “Notably, there have been 0 fatalities in North America ever,” he wrote, adding that the “lion’s share” of fatalities are in Latin America and Africa.
Lopp, who has maintained the underlying “Bitcoin Wrench Attack” archive for years, has warned the workload and frequency are becoming harder to treat as isolated incidents. “When an event goes from being rare to happening every few days, it’s no longer newsworthy — it’s just a fact of life,” he wrote in a Dec. 21 post cited in the thread, while inviting others to help maintain the database.
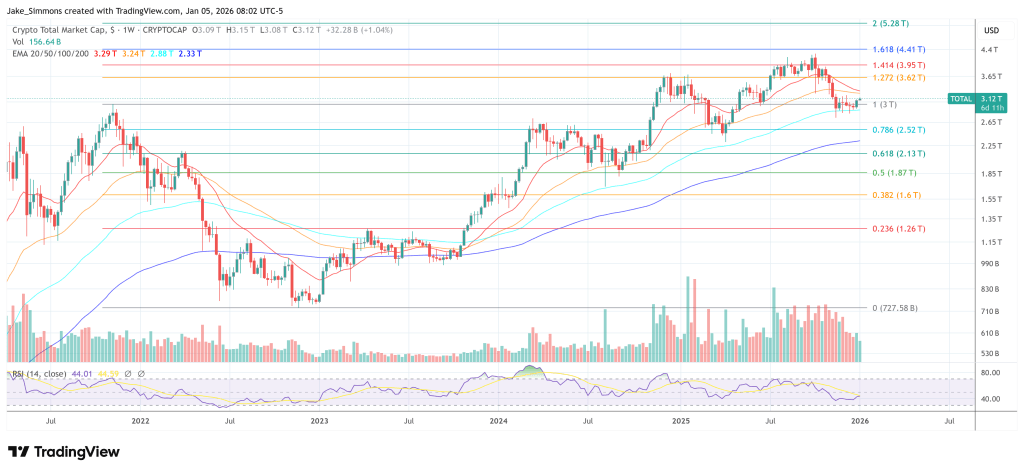
At press time, the total crypto market cap stood at $3.12 trillion.