Strategy Watch #2

insights.glassnode發佈於 2026-03-24更新於 2026-03-24

文章摘要

Strategy Watch #2 provides institutional analysis of digital asset fund performance and allocation trends. The report covers six key areas: institutional capital flows, fund performance, macro strategies, on-chain vault returns, manager sentiment, and allocation updates. In February and early March, Bitcoin and Ethereum saw significant net outflows (-$9.6B and -$3.2B respectively), while stablecoins attracted inflows (+$6.2B), suggesting a defensive shift toward lower-risk assets. BTC ETF flows turned positive in March, though institutional conviction remains cautious. DeFi Total Value Locked (TVL) on Ethereum declined sharply, with peak outflows of -$23.7B in February, indicating reduced participation in on-chain yield strategies. CME basis yields continued to tighten, reflecting lower institutional leverage and softer derivatives demand. The report also highlights performance trends, with only one strategy type generating positive returns in February. Over 300 managers shared their three-month market outlook, and a new $750M fund of funds was announced.

The full report is freely available in PDF format.

Download PDF version

Welcome to Strategy Watch #2

Strategy Watch was built to address a clear demand for high-signal, impartial analysis of fund-level performance and allocation trends in digital assets.

The inaugural edition confirmed this demand, reaching a broad audience of key decision makers, from leading global asset managers, hedge funds, major investment banks, top-tier crypto-native funds and Fund of Funds.

Building on this early momentum, our objective is straightforward — to make Strategy Watch a must-read monthly publication for the digital asset investment community.

This publication is strengthened by direct input from market participants. Funds and allocators that contribute data and insights help shape a more complete and valuable view of the landscape.

If you have insights, data, or allocation updates worth sharing, we welcome your contribution.

Present your latest initiatives and updates to a curated audience of institutional allocators.

Share updates ↗

Inside the Latest Strategy Watch

The report is structured across six core sections, each focused on a distinct dimension of institutional activity in digital assets:

01 Institutional Flow Monitor |

02 Fund and SMA Performance | February was a bloodbath, check this section to see the only strategy type that returned positively last month.

03 Strategy Deep Dive: Macro Strategies | Hear firsthand from a macro portfolio manager on how they are navigating the current geopolitical challenges. 

04 On-chain Vault Performance | Are ETH curators underperforming ETH staking yield?

05 Manager Monitor | Find out how more than 300 managers are expecting the crypto market to perform over the next three months.

06 Allocation Updates | New USD 750m Fund of Funds is launching. Check this section to learn more.

in partnership with

The Premier Digital Assets Allocator Platform. Learn more


Institutional Flow Monitor

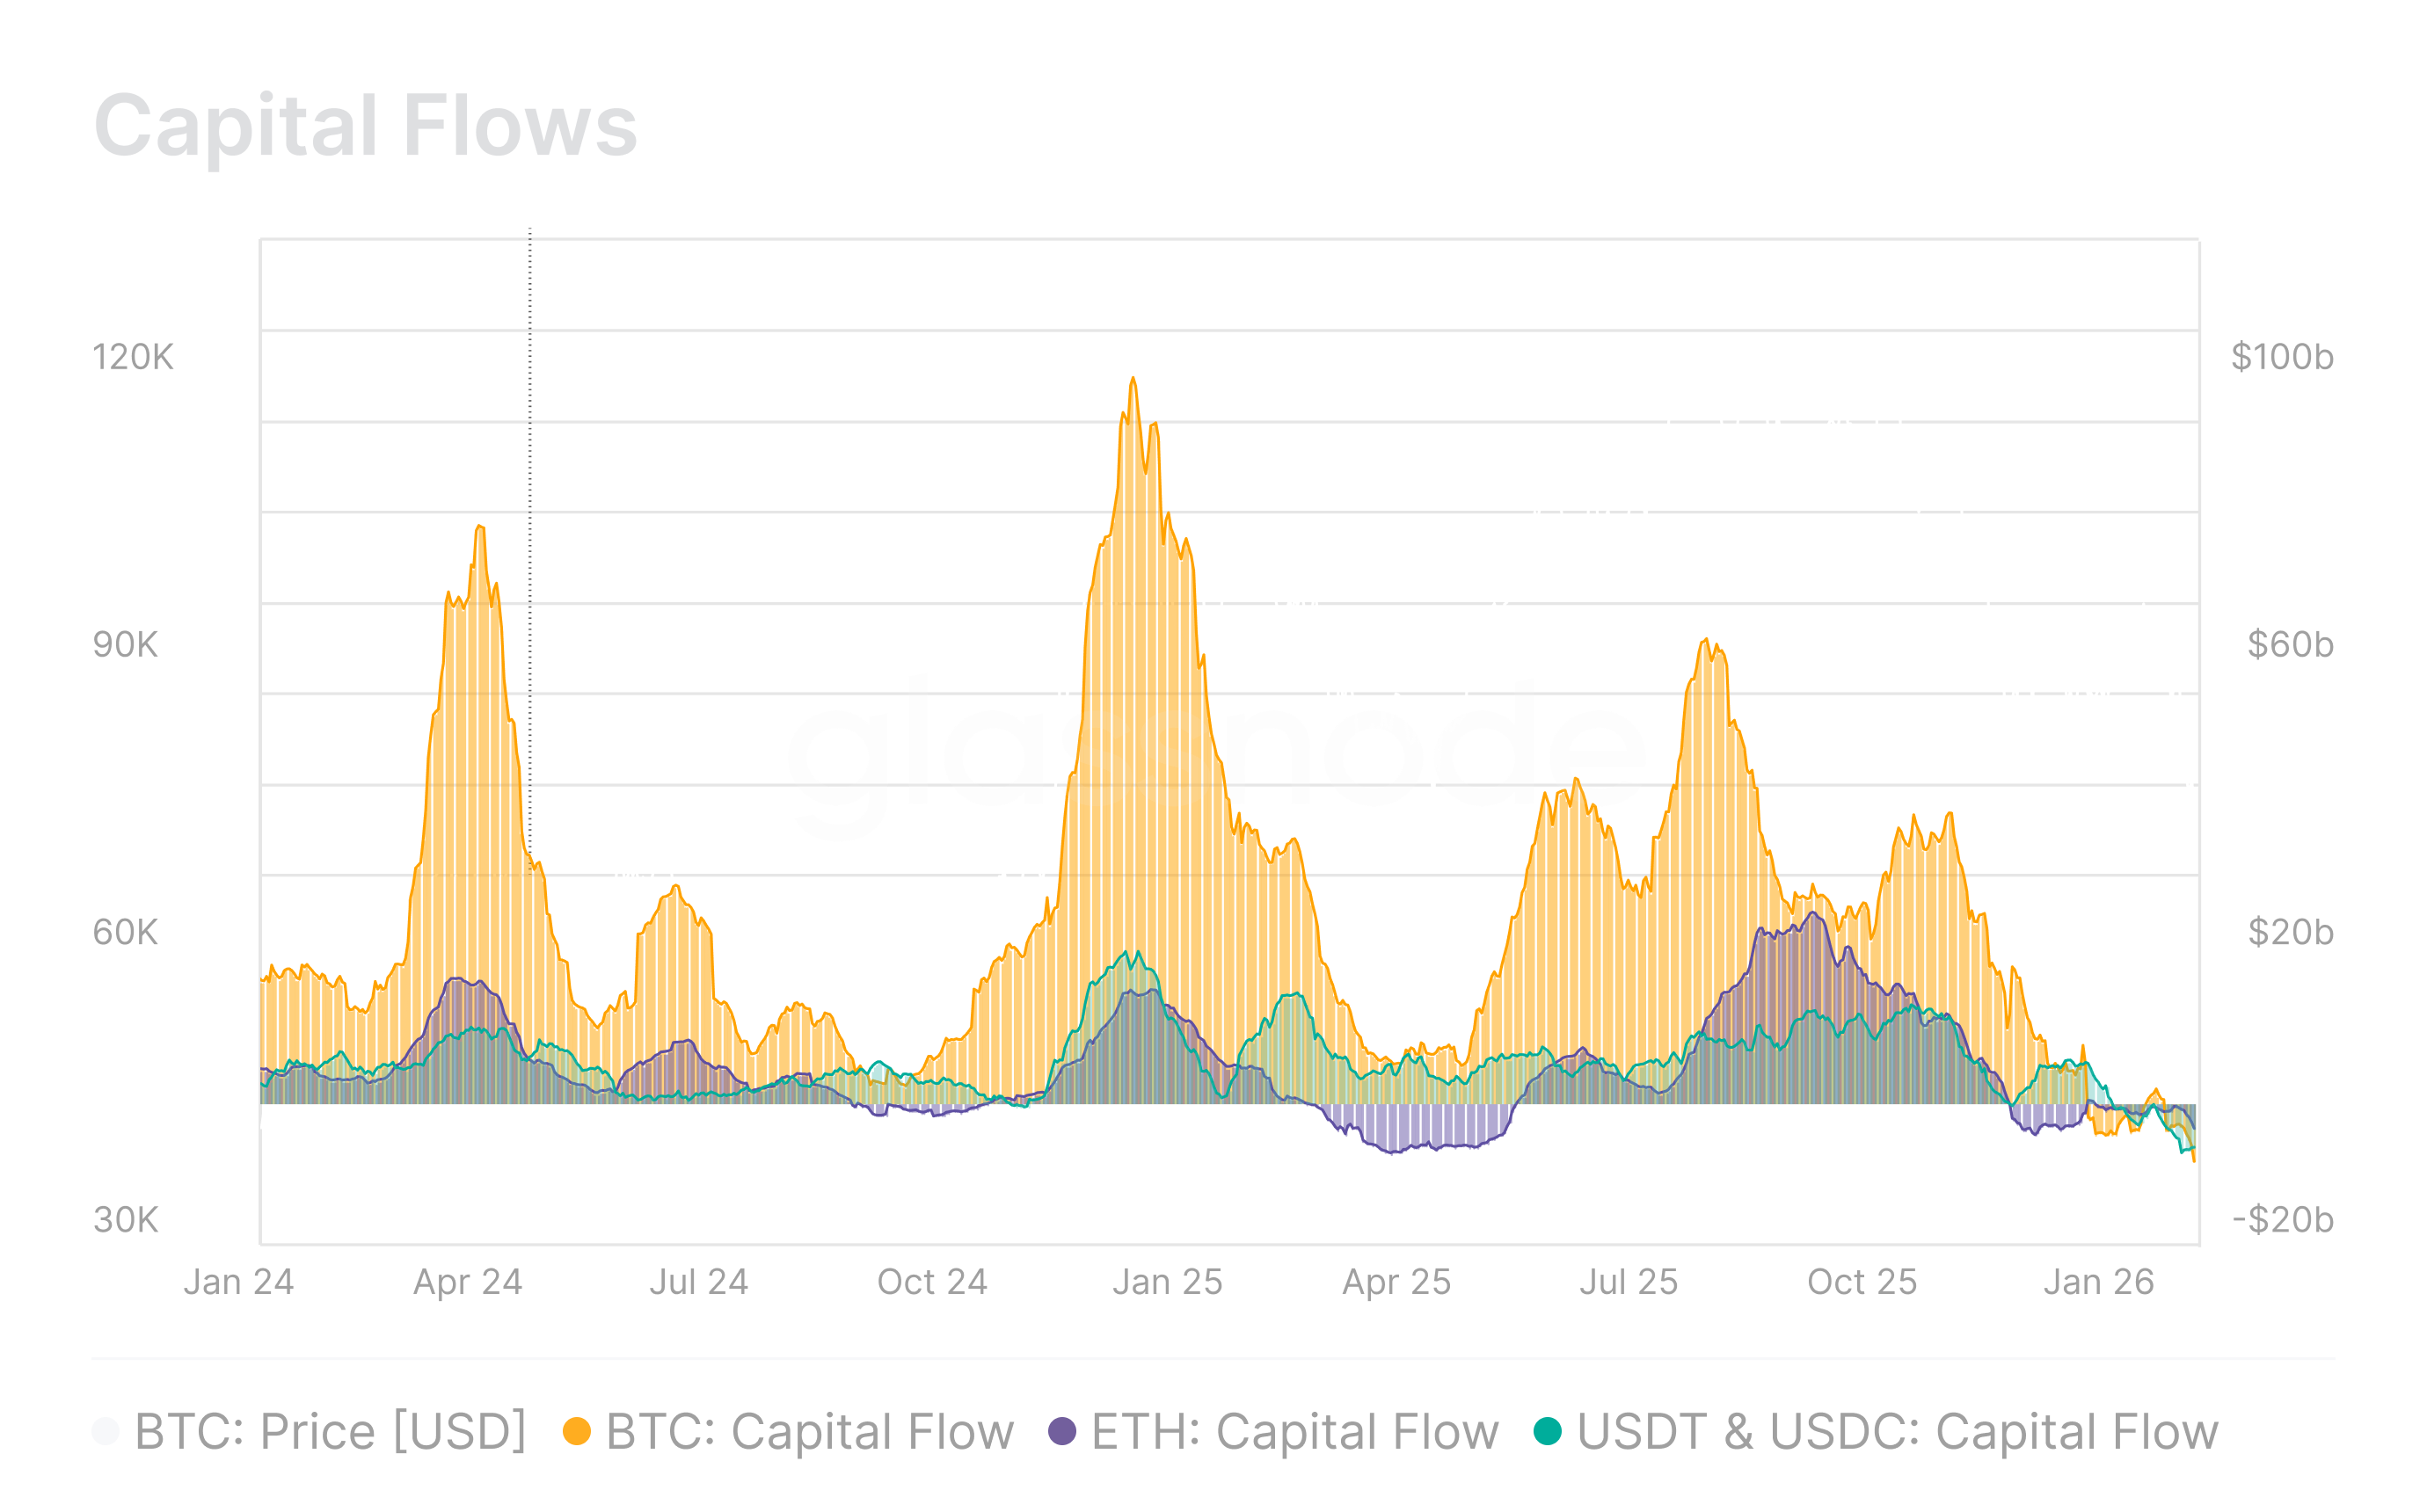
Capital flows into BTC and ETH remained deeply negative through February and into March, with stablecoins turning net positive in early March as investors rotated toward lower-risk positioning.

Bitcoin and Ethereum continued to experience sustained net outflows, with BTC and ETH capital flows registering -$9.6B and -$3.2B. However, stablecoins broke from the broader negative trend, flipping to +$6.2B in net inflows. Rather than signaling a broad return of risk appetite, this rotation likely reflects a defensive repositioning, with capital migrating into dollar-denominated on-chain instruments while conviction in spot crypto assets remains under pressure heading into mid-Q1 2026.
ETF & DAT Net Flows

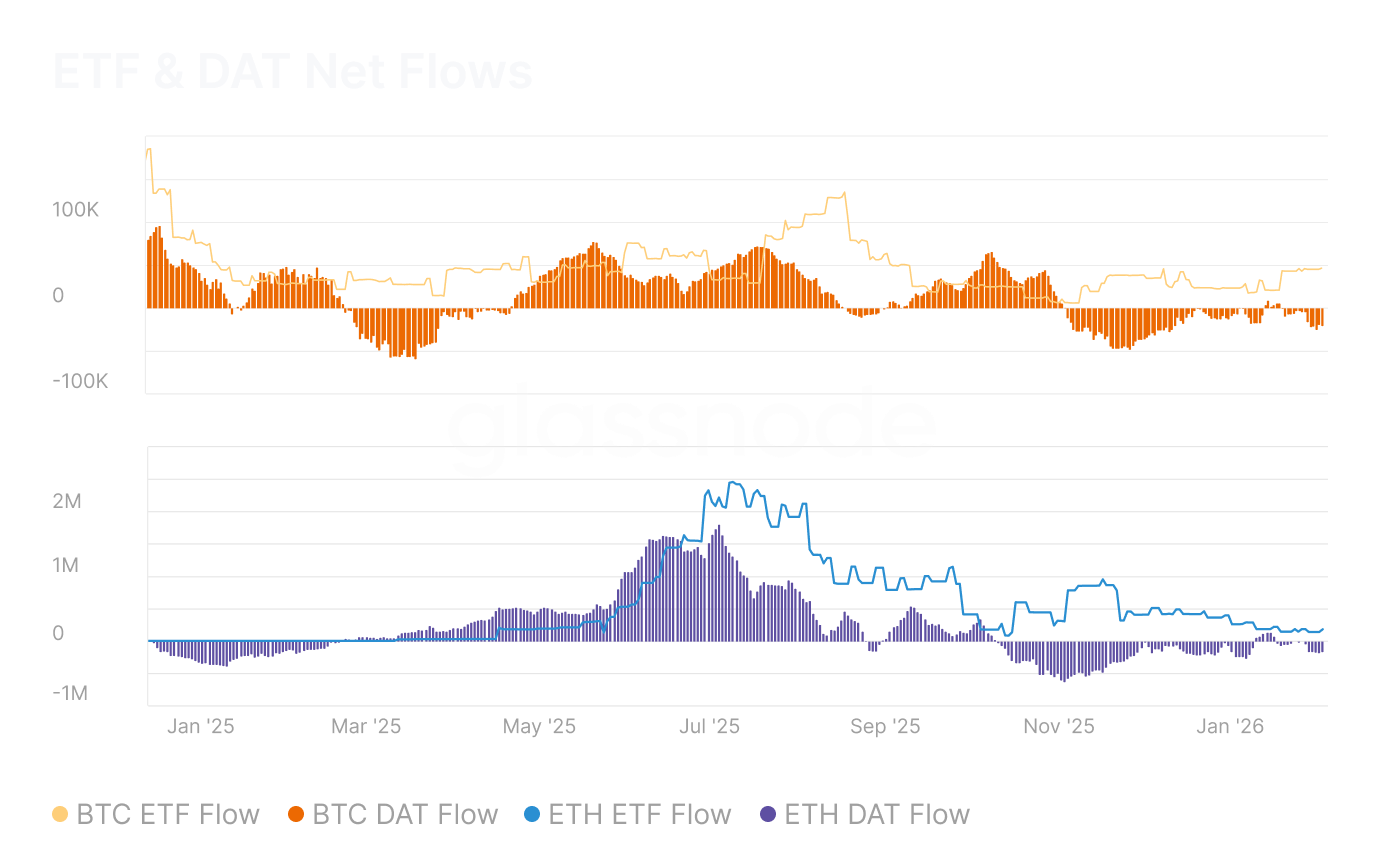
After sustained February outflows, BTC ETF and DAT flows returned to positive, while ETH institutional flows showed early signs of stabilization.

After sustained February outflows, Bitcoin ETF and DAT flows returned to positive territory, recovering to +28k BTC and +46.8k BTC respectively. Ethereum flows were more measured, with ETF flows near neutral at +46.5k ETH and DAT flows stabilizing at +295.8k ETH. While the directional shift is encouraging, the recovery remains early-stage and uneven, and it would be premature to characterize this as a broad resumption of institutional conviction.
DeFi TVL & Stablecoin Cap

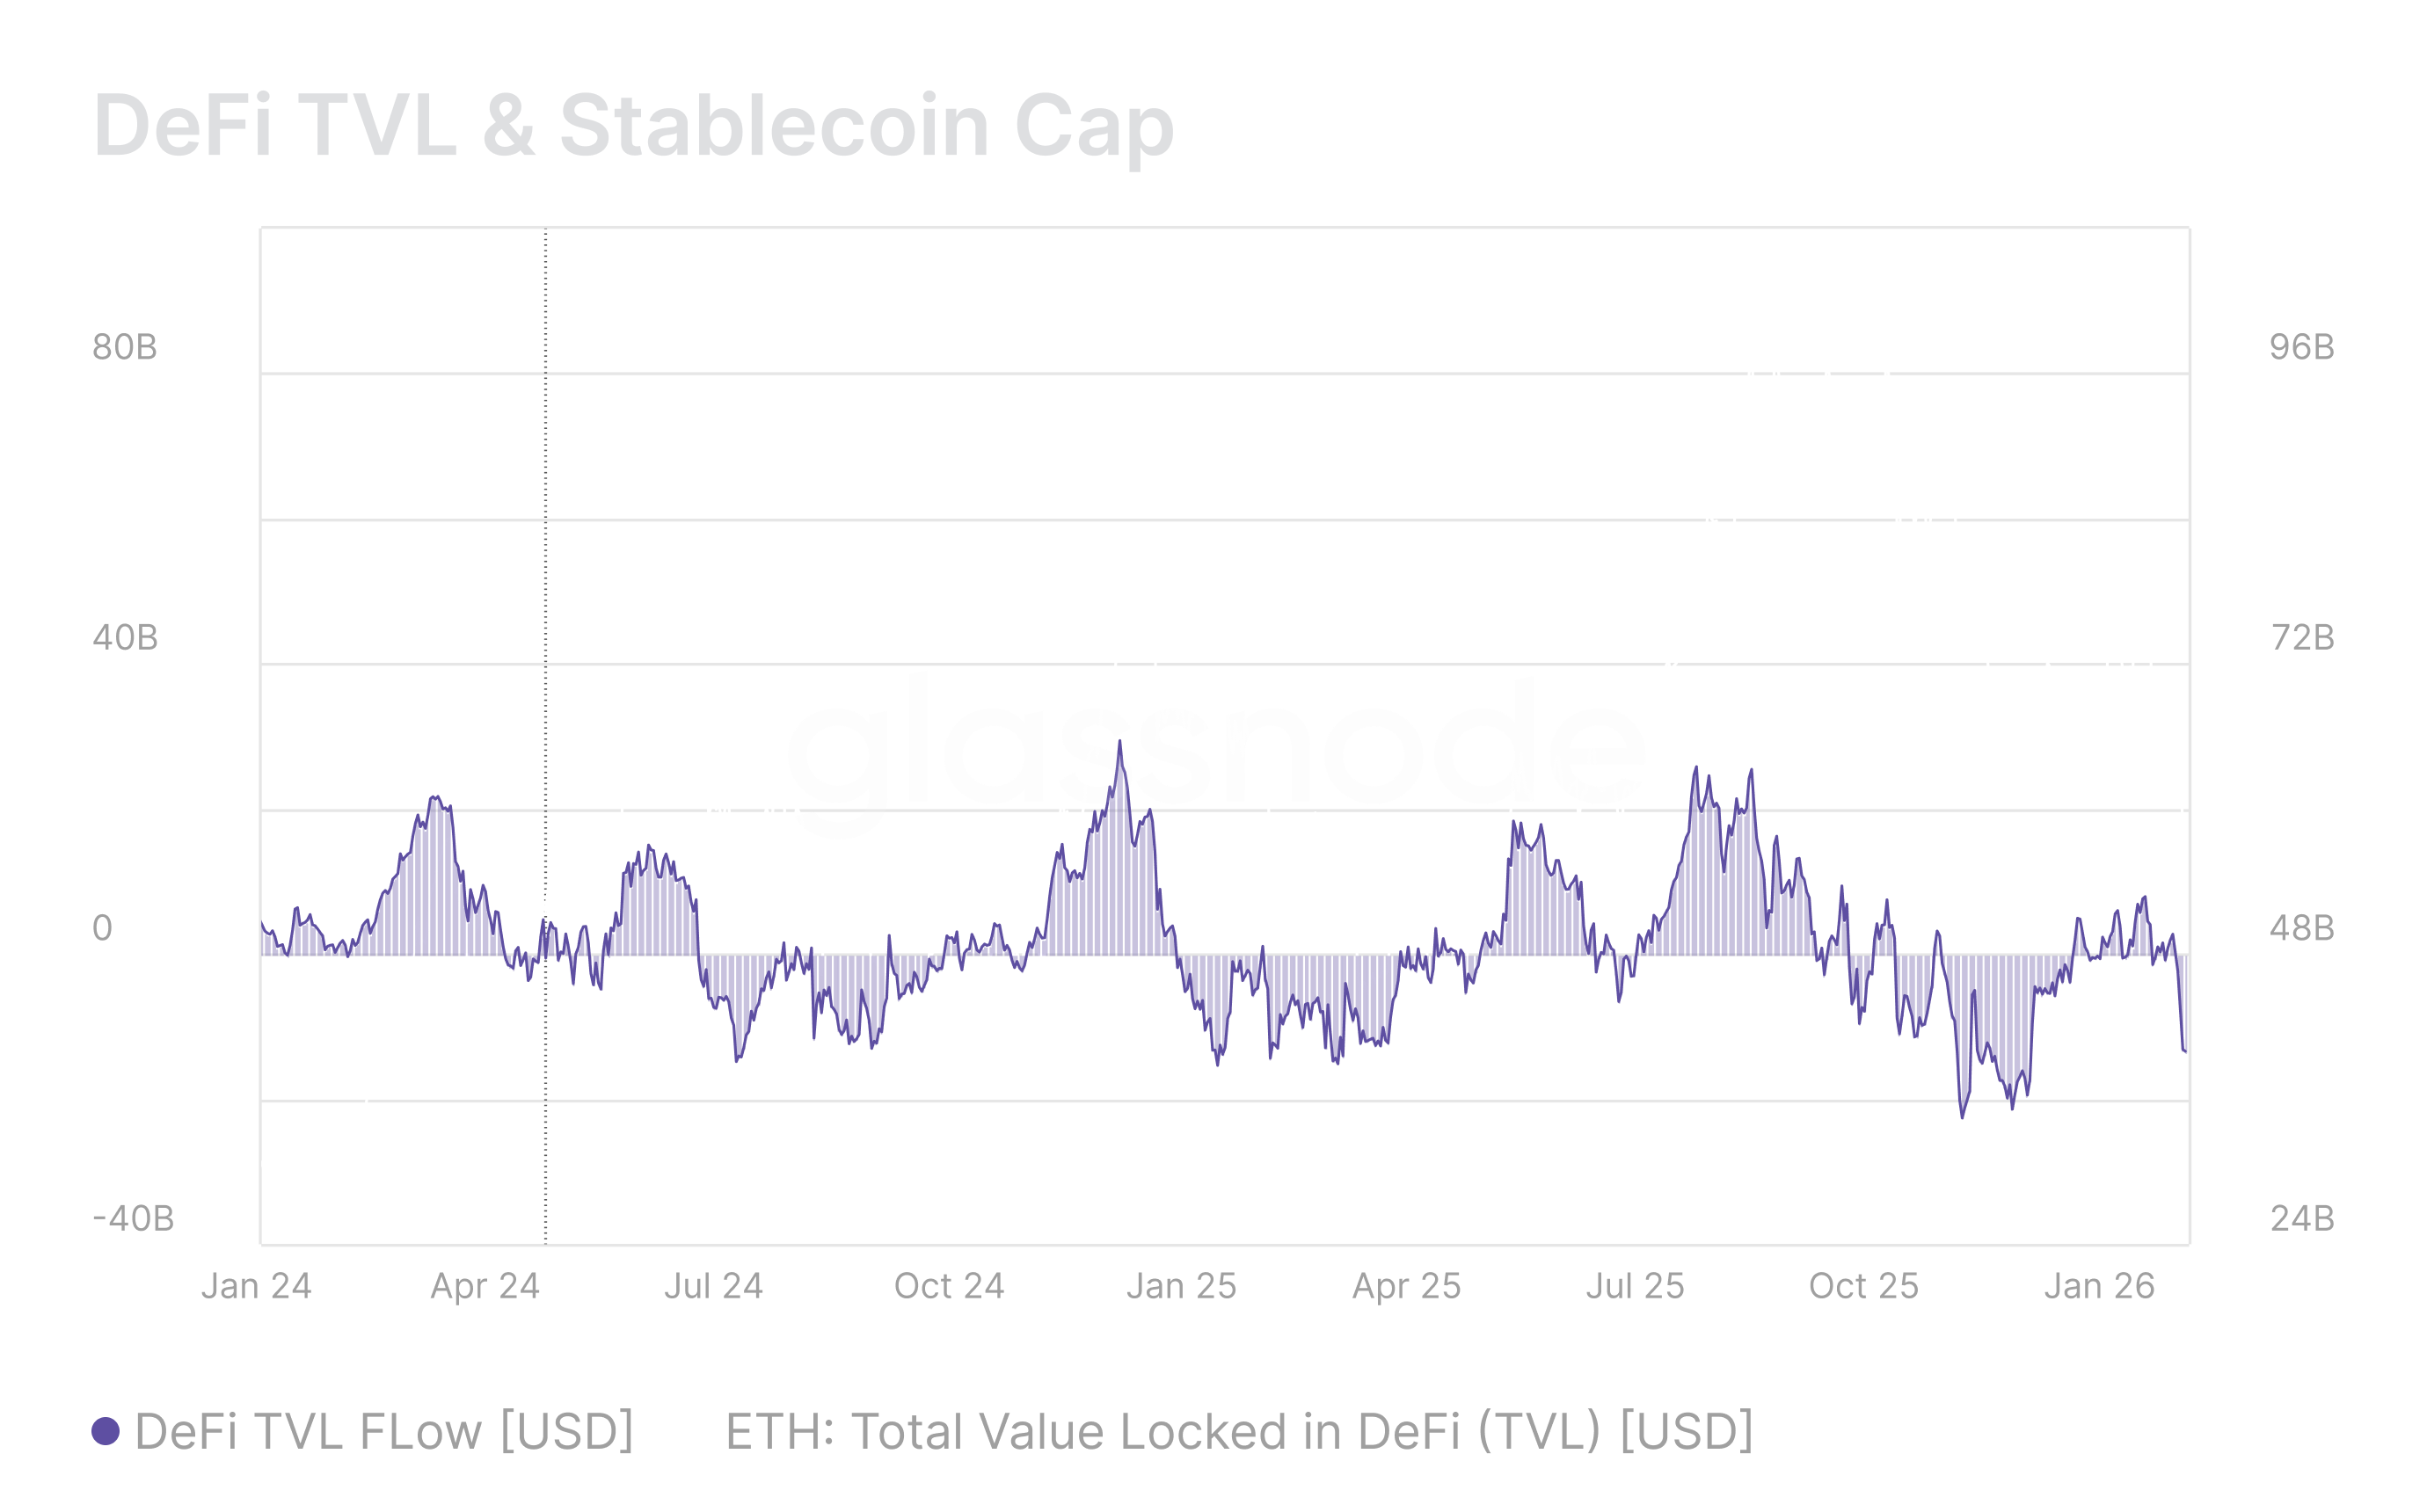
DeFi TVL on Ethereum saw sharp contraction through February before showing early signs of stabilization in March, though the broader declining trend since August 2025 remains intact.

Total Value Locked on Ethereum recorded peak outflows of -$23.7B per month in February, implying sustained withdrawal by larger allocators from on-chain activities such as liquidity provisioning and yield strategies. This slowdown alone is insufficient to signal a reversal, and diminished conviction in DeFi risk-adjusted returns continues to point to shallower liquidity depth across the ecosystem.
CME Basis Yield

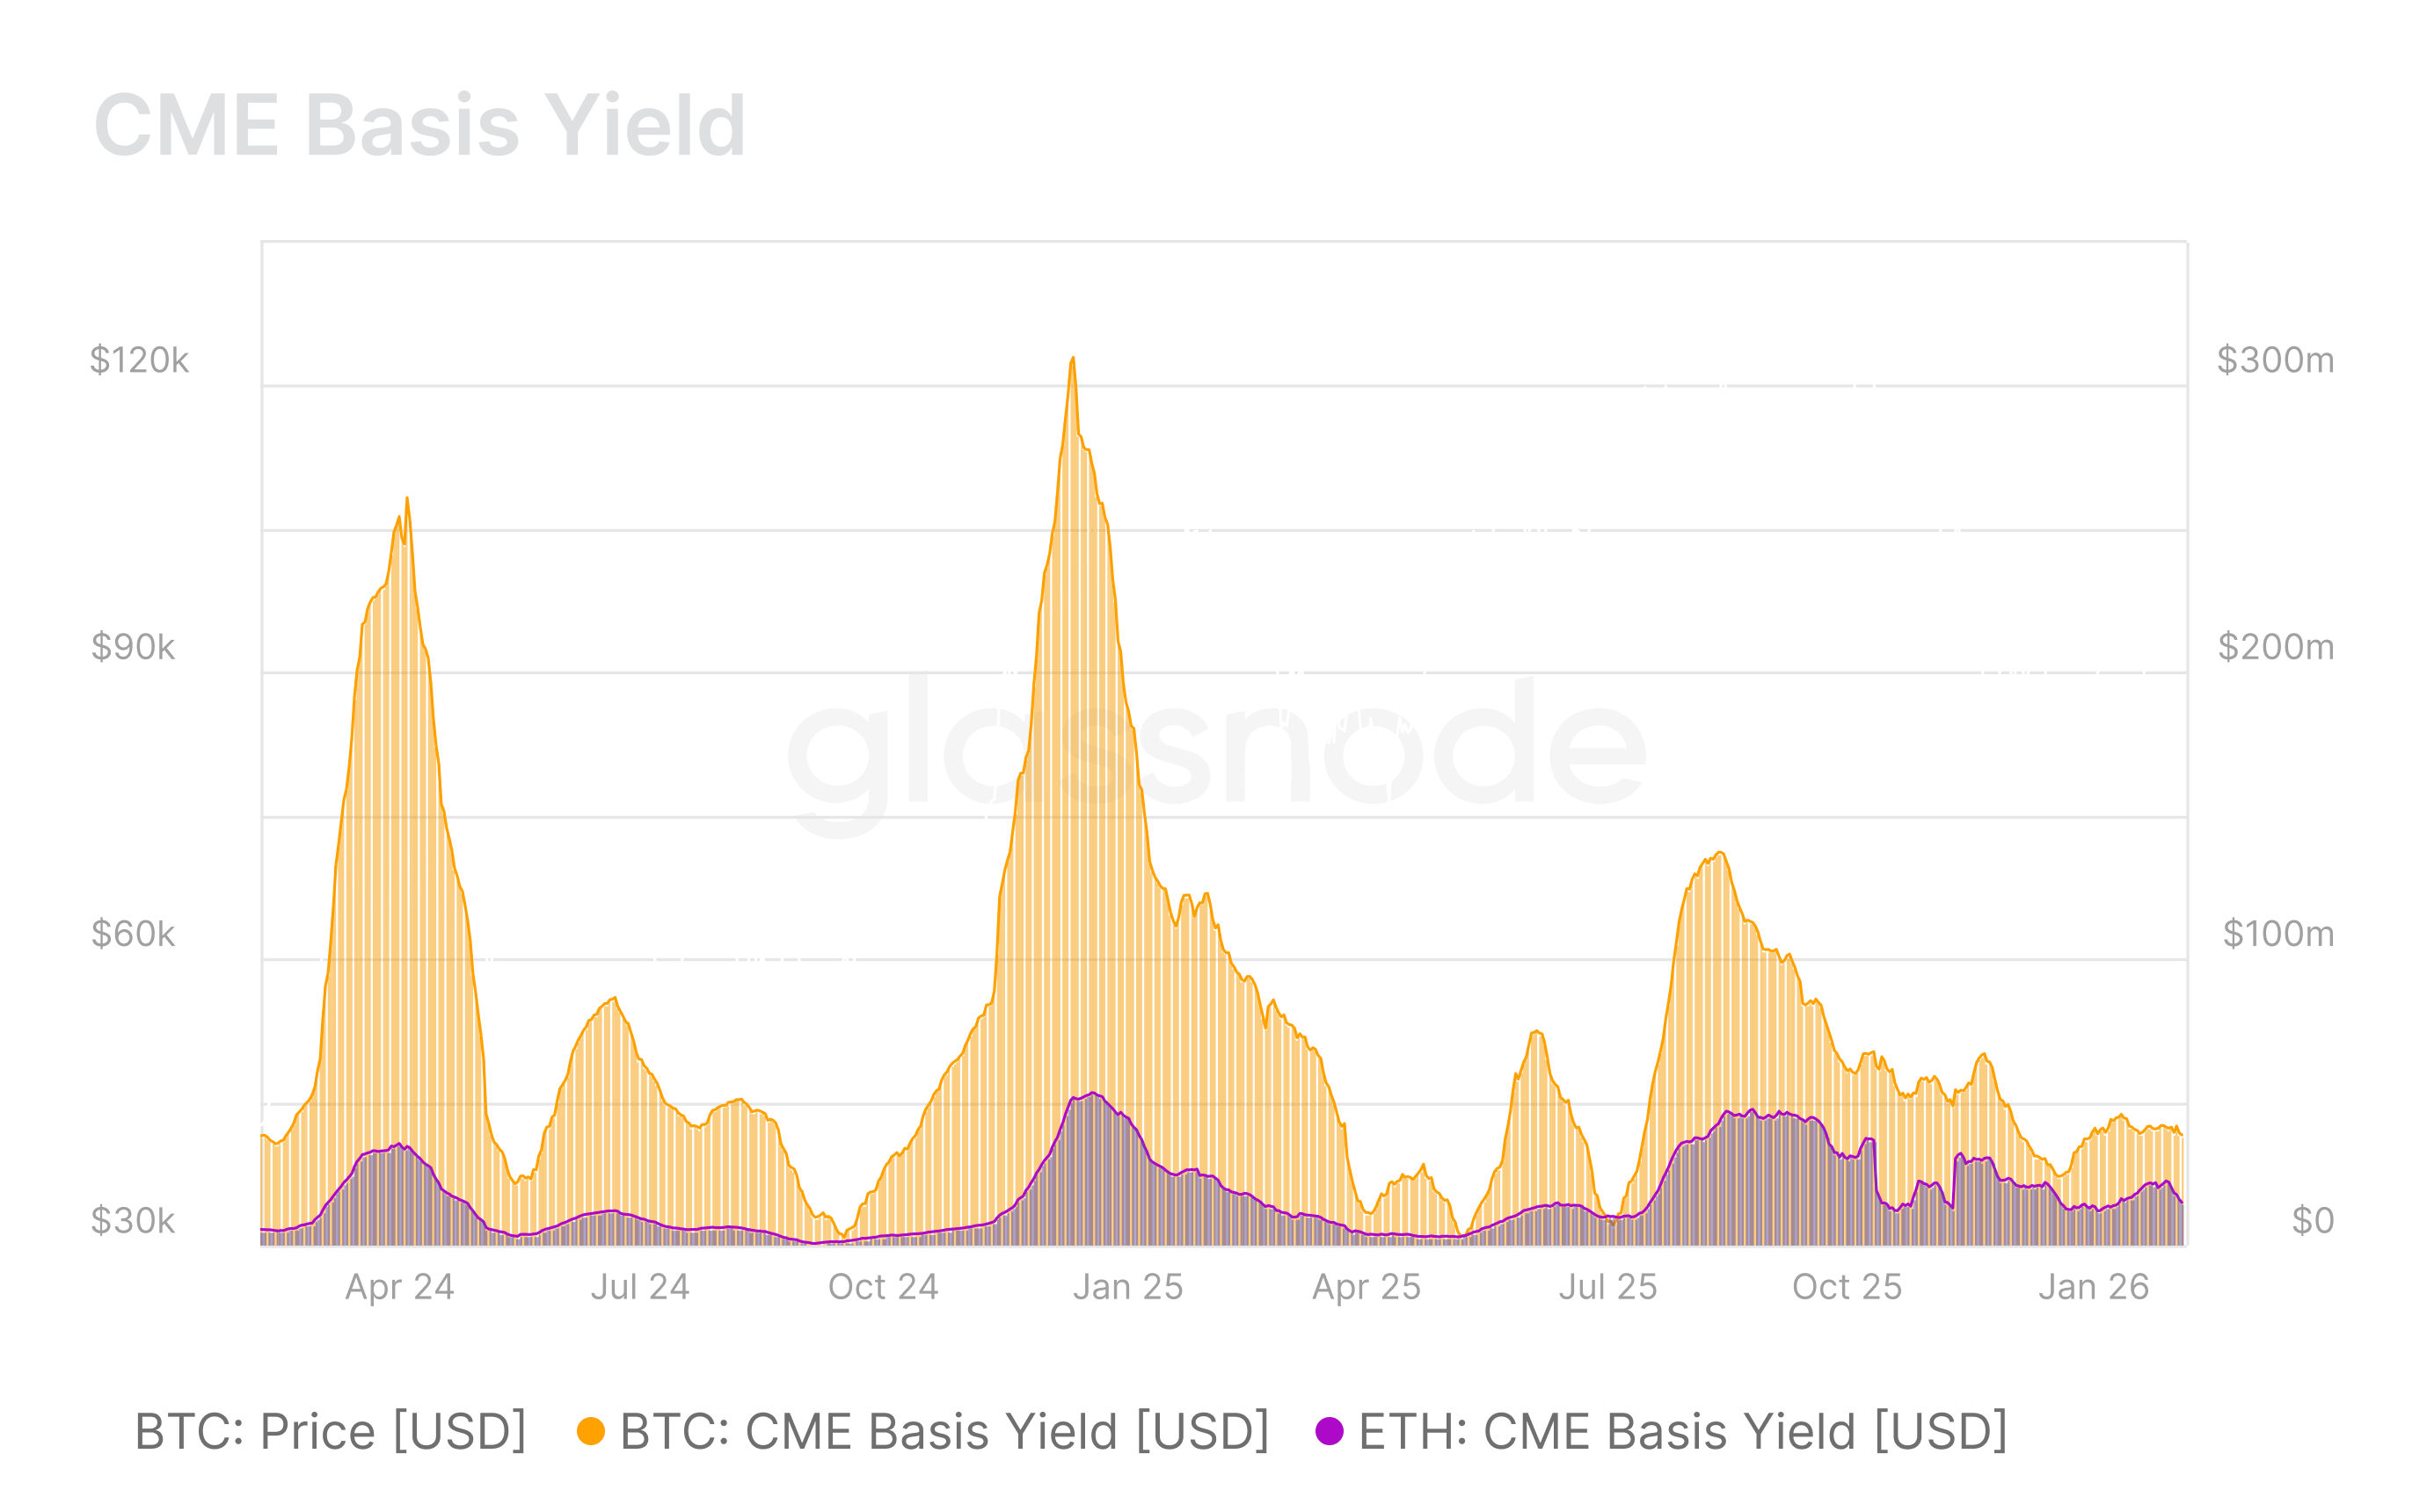
CME Basis Yield compressed even further in February, reinforcing waning incentives for market-neutral strategies compared to January.

The monthly dollar value captured by institutions via cash-and-carry trades declined notably for both Bitcoin and Ethereum, building on the sharp compression seen since August 2025. This tightening basis reflects reduced leverage deployment, softer futures demand, and continued pullback in balance-sheet commitment amid tighter liquidity conditions persisting from January into early March 2026.


Disclaimer: This report does not provide any investment advice. All data is provided for information and educational purposes only. No investment decision shall be based on the information provided here and you are solely responsible for your own investment decisions.
Exchange balances presented are derived from Glassnode’s comprehensive database of address labels, which are amassed through both officially published exchange information and proprietary clustering algorithms. While we strive to ensure the utmost accuracy in representing exchange balances, it is important to note that these figures might not always encapsulate the entirety of an exchange’s reserves, particularly when exchanges refrain from disclosing their official addresses. We urge users to exercise caution and discretion when utilizing these metrics. Glassnode shall not be held responsible for any discrepancies or potential inaccuracies. Please read our Transparency Notice when using exchange data.

相關問答

QWhat is the primary purpose of the Strategy Watch publication?

AStrategy Watch was built to address a clear demand for high-signal, impartial analysis of fund-level performance and allocation trends in digital assets, aiming to be a must-read monthly publication for the digital asset investment community.

QWhich was the only strategy type that returned positively in February according to the report?

AThe report indicates that readers should check the 'Fund and SMA Performance' section to see the only strategy type that returned positively in February, though the specific strategy name is not stated in the provided text.

QWhat was the trend in capital flows for Bitcoin (BTC) and Ethereum (ETH) through February and into March?

ACapital flows into BTC and ETH remained deeply negative, with BTC and ETH capital flows registering -$9.6B and -$3.2B, respectively.

QHow did stablecoin capital flows behave in contrast to BTC and ETH in early March?

AStablecoins broke from the broader negative trend, flipping to +$6.2B in net inflows, which likely reflects a defensive repositioning into lower-risk, dollar-denominated on-chain instruments.

QWhat does the sharp compression in CME Basis Yield indicate about market conditions?

AThe compression in CME Basis Yield reflects reduced leverage deployment, softer futures demand, and a continued pullback in balance-sheet commitment amid tighter liquidity conditions, indicating waning incentives for market-neutral strategies.

你可能也喜歡

年薪百万抢电工,Meta急到自己办技校

AI竞赛正面临新的瓶颈:工地。美国正面临严重的电工、建筑工等技术工人短缺,这已成为微软、Meta、OpenAI等公司快速建设超大规模AI数据中心(如OpenAI耗资160亿美元的“星际之门”项目)的“头号障碍”。 尽管AI公司愿支付高薪(如电工年薪可达24-28万美元),远超传统行业,但熟练技工仍供不应求。麦肯锡预测,美国在2023-2030年间需额外培养13万名电工和24万名建筑工,而劳工统计局预计每年仍有8万个电工岗位空缺。这种短缺导致项目延迟,每月可能造成数百万美元的收入损失。 AI数据中心建设复杂,需应对巨大功耗(一座设施耗电堪比数十万户家庭)、复杂的配电系统以及高密度散热(需液冷技术)等挑战,因此亟需大量技术娴熟的工人。 为此,科技巨头开始亲自下场培养人才。例如,Meta投入1.15亿美元建立建筑工人培训学校,提供免费培训及生活补贴,以快速输送工人上岗。OpenAI则与建筑工会合作,提前锁定熟练劳动力。同时,企业也将招聘目光投向高中生,鼓励年轻人投身技工行业。这些举措已见成效,Z世代对技工职业的兴趣显著上升。 然而,更深层的挑战在于电力。AI数据中心用电量正以惊人速度增长,已推高部分地区的电价。此外,数据中心建设是项目制的,建设期需要成千上万的工人,但建成后仅需少量常驻人员。这意味着未来可能面临熟练工人短期过剩、并流向其他行业压低薪资的风险。如何实现劳动力与电力资源的长期平衡,仍是悬而未决的问题。

marsbit28 分鐘前

年薪百万抢电工,Meta急到自己办技校

marsbit28 分鐘前

OpenAI 不靠最贵的模型卖钱了

OpenAI近期调整了API定价策略,旗舰模型GPT-5.6 Luna降价80%,Terra降价20%,而顶级模型Sol未降价但新增了更快的“Fast”模式。此次调整的核心并非单纯的价格战,而是标志着OpenAI首次引导用户根据任务需求选择不同模型,而非一味追求最强模型。官方建议复杂任务可由Sol进行规划,再由Luna等成本更优的模型执行。 此举与Anthropic近期推出半价替代旗舰的Claude Opus 5策略相似,显示硅谷领先公司正形成默契:旗舰模型(如Sol、Fable)的角色正从直接盈利转向树立技术品牌和探索上限,而商业化走量和利润则主要由中端及性价比模型(如Luna、Opus)承担。这类似于汽车等行业“旗舰立形象,走量车型赚利润”的模式。 更深层的变化在于成本下降的驱动力。OpenAI透露,此次降价部分得益于由Sol模型自身参与优化底层生产内核,实现了效率提升与成本降低,开启了“模型优化模型”的自我加速循环。 行业竞争焦点正从“谁最聪明”的单项性能比拼,转向为企业提供基于任务重要性、出错成本、规模等因素的“模型组合”最优解,追求整体ROI。这类似于云计算按数据冷热使用不同存储的策略。 OpenAI的长期战略日益清晰:其真正目标并非依靠单一模型的高毛利,而是通过极低的调用成本构建庞大的开发者生态与调用量,形成类似操作系统或云平台的渗透率与用户粘性。当API调用成本低至可被忽略,AI将如水电般无缝嵌入所有业务流程,其发展也将从追求智能巅峰的“产品时代”,进入驱动全面自动化与效率的“基础设施时代”。

marsbit28 分鐘前

OpenAI 不靠最贵的模型卖钱了

marsbit28 分鐘前

交易

現貨
活动图片