Data shows the Bitcoin spot trading volume has surged up 46% in the past week, as a result of the latest rally in the price of the crypto.
Bitcoin 7-Day Average Trading Volume Has Increased By 46% Over The Last Week
According to the latest report published by Arcane Research, following this rise, the activity has again softened as BTC has been trading sideways around $20.5k.
The “daily spot trading volume” is an indicator that measures the total amount of Bitcoin being transacted on spot exchanges.
When the value of the metric is high, it means investors are moving around a large number of coins on spot markets right now. Such a trend suggests traders are active on the network currently.
On the other hand, low volumes imply the BTC market is inactive at the moment. This could be a sign that the general interest around the crypto is low currently.
Now, here is a chart that shows the trend in the 7-day average Bitcoin spot trading volume over the past year:
The weekly average value of the metric seems to have been elevated in recent days | Source: Arcane Research's Ahead of the Curve - Nov 1, 2022
As you can see in the above graph, the 7-day average Bitcoin spot trading volume has observed a rise over the past week or so.
The chart displays the volume on Binance and that on the rest of the exchanges separately because the former has been seeing some inorganic activity recently as a result of the fee removal.
In the past week, the indicator has surged up by around 46% due to trading activity increasing in the market because of the short squeeze and the strength shown by the crypto.
However, the volumes have already started to die down in the last few days as a consequence of the sideways movement of BTC around the $20.5k mark.
Usually, boring price action doesn’t attract that many traders, while volatile markets can get in a flood of them (hence spiking up the volumes).
The report expects the Bitcoin volumes to surge up again this week due to the hectic events coming up. “The FOMC press conference, in particular, is likely to contribute to maintaining vibrant activity in the market,” notes Arcane Research.
BTC Price
At the time of writing, Bitcoin’s price floats around $20.4k, down 1% in the last week. Over the past month, the crypto has gained 5% in value.
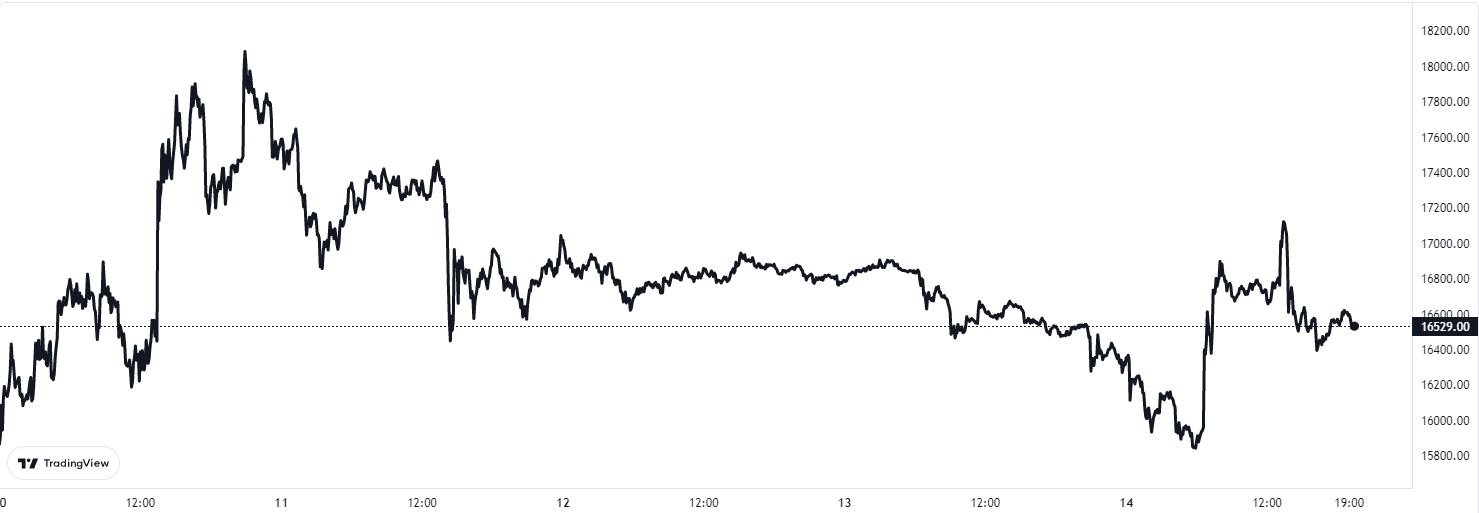
The below chart shows the trend in the price of the coin over the last five days.

The crypto has been moving sideways recently | Source: BTCUSD on TradingView