The crypto market is facing a wave of misinterpretation as Coinbase’s large-scale wallet rebalancing, which began on November 22, 2025, continues to distort major on-chain indicators. Many dashboards now display what appears to be an unprecedented $68 billion Long-Term Holder (LTH) “sell” spike — but according to analysts, this is not real distribution. Instead, it’s the direct result of Coinbase transferring coins internally as part of its routine wallet restructuring process.
This distinction is critical. Several prominent analysts and market commentators have highlighted massive outflows, huge shifts in LTH supply, and unusual wallet movements, yet many have failed to mention the underlying cause: Coinbase’s internal reshuffling. Without this context, market participants might wrongly conclude that long-term holders are panic-selling at scale, reinforcing fear during an already fragile market environment.
These rebalancing events have happened before, but the size of Coinbase’s holdings means even normal internal operations can trigger dramatic spikes in on-chain metrics such as LTH Net Position Change, Exchange Netflow, and Spent Output Age Bands.
Coinbase Internal Transfers Distorted Key On-Chain Metrics
According to detailed analysis by Axel Adler, Coinbase’s internal migration of approximately 800,000 BTC created one of the largest distortions in on-chain data ever recorded — without a single coin being sold.
The exchange executed 286 transactions totaling 798,636 BTC, moving funds from legacy P2PKH (Pay-to-Public-Key-Hash) addresses to modern P2WPKH (SegWit) addresses. This technical reorganization produced an artificial $68 billion “realized profit” spike, misleading many market observers into interpreting it as massive long-term holder distribution.
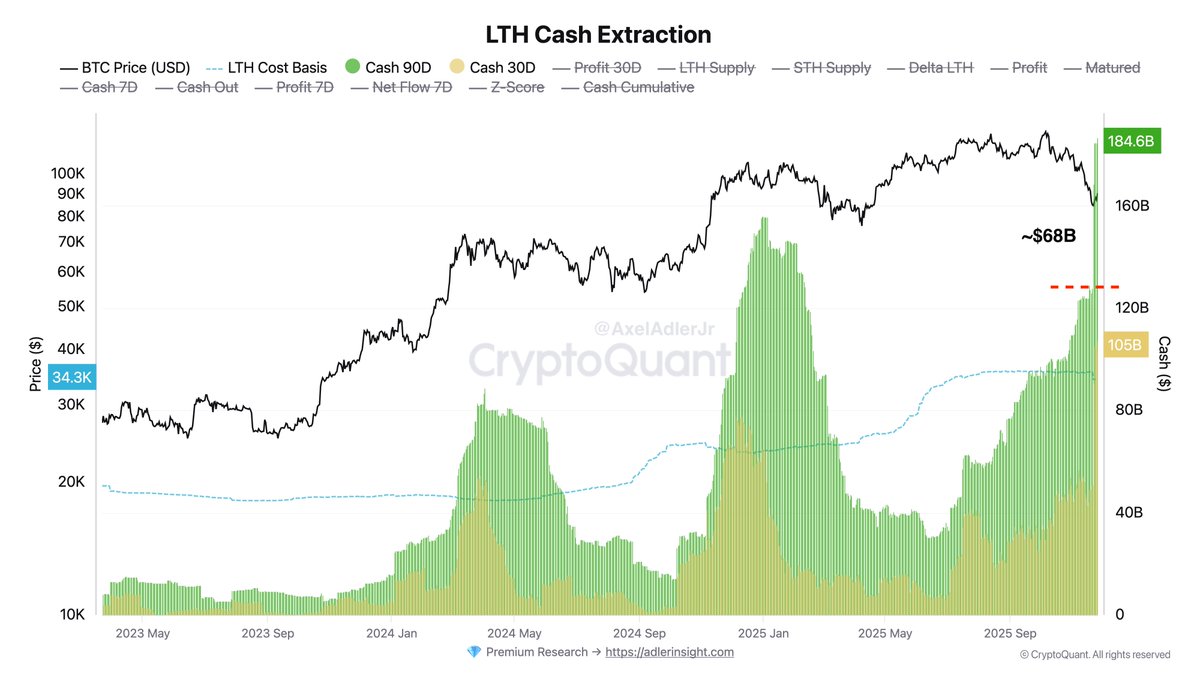
This large UTXO migration disrupted several major on-chain indicators. LTH and STH Supply metrics were temporarily skewed, showing a sharp drop in Long-Term Holder supply and a rise in Short-Term Holder supply — a pattern typically associated with heavy “smart money” selling. In reality, no distribution occurred; Coinbase simply restructured its internal wallets.
The distortion also affected LTH Realized Profit/Loss models, which reflected tens of billions in phantom gains, and HODL Waves, where UTXO ages were “reset,” suggesting long-term holders had suddenly spent old coins. Even Coin Days Destroyed (CDD) showed a significant spike, mimicking an “old coin awakening,” though the activity was entirely internal.
These disruptions highlight how exchange operations can temporarily break the reliability of on-chain metrics, requiring careful interpretation from analysts and investors.
Total Market Rebounds but Remains Under Critical Pressure
The Total Crypto Market Cap chart shows a sharp rebound after tagging the $2.88T zone, a level that aligns closely with the 100-week moving average (green), acting as a key structural support in previous cycles. This bounce has pushed total valuation back above the $3T mark, but the broader trend remains fragile after weeks of heavy selling across majors like BTC and ETH.
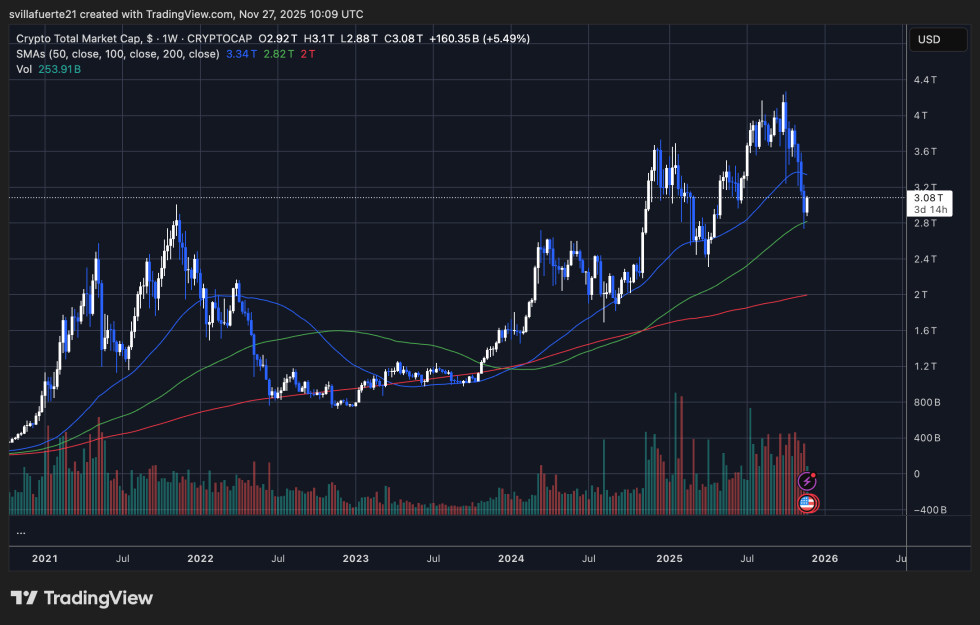
Price structure highlights a clear breakdown from the $3.6T–$3.8T consolidation zone, followed by a fast, impulsive decline—mirroring the speed of corrections seen during 2021 and mid-2022. Despite the latest recovery candle, the market remains below the 50-week moving average (blue), signaling that buyers must regain momentum quickly to avoid deeper downside toward the 200-week moving average near $2T.
Volume has surged on recent sell-offs, showing widespread forced selling and capitulation behavior—a pattern consistent with cycle mid-reset phases. The rebound, however, shows reduced sell volume, suggesting exhaustion from bearish participants. To confirm strength, total market cap must reclaim the $3.25T–$3.3T area, which currently acts as the first major resistance.
Failure to break above this zone risks further consolidation or a retest of the $2.8T support. For now, the market shows early signs of stabilization, but broader recovery depends on Bitcoin’s ability to sustain its own rebound and restore confidence across altcoins.
Featured image from ChatGPT, chart from TradingView.com

Related Posts