Bitcoin price is struggling with an uptrend as the new week begins, paralleling the time when the market is active in a key zone. After closing the weekly candle below $27,000, the BTC/USD pair is attempting to consolidate support to gain momentum.
Last week, BTC plummeted below $26,000 – its lowest level in the past two months. This leaves traders fearful of an impending major bearish breakdown. Although this has not materialized yet, many people are still very worried, especially when looking at BTC on a chart with a shorter and longer time frame.
What is the likely next price move? It's been a relatively calm week with not many special events going on, but the upcoming difficulty adjustment will most likely take it back to all-time highs (ATH) and similar events could potentially be. could take place to further drive BTC up. Here are some factors affecting BTC next week.
After a weekly close at around $26,930, Bitcoin price edged higher, reaching $27,550 overnight. While encouraging, the closing price still marks Bitcoin's lowest level since mid-March. Prominent trader and analyst Rekt Capital noticed this and warned that $27,600 is now moving towards support. .
“First, BTC failed to regain $28,800 on the weekly chart (orange). And then BTC closed below $27,600, failing to hold the support (black). This turns $27,600 into resistance and will likely push BTC further down to the lows of $20,000.”
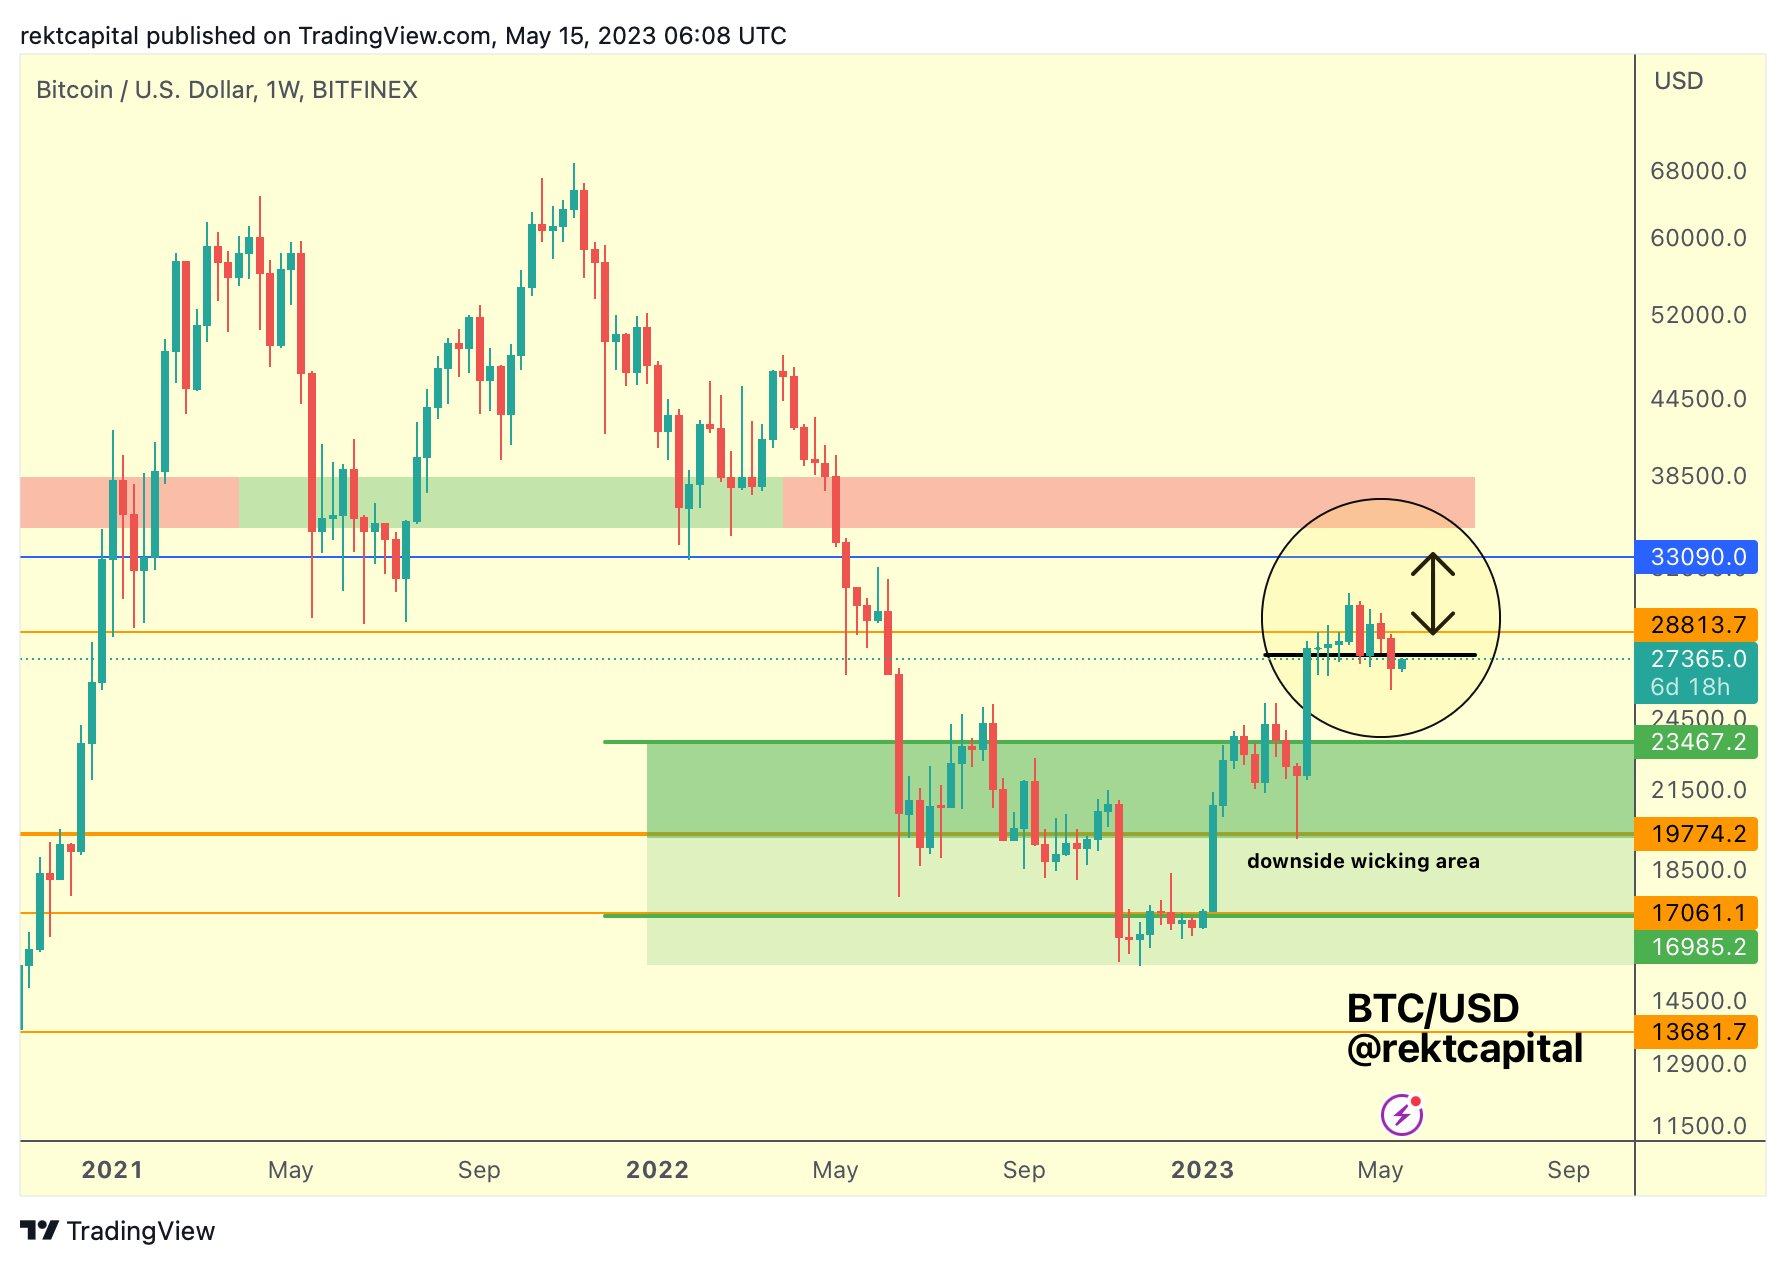
BTC/USD 1-week chart | Source: Rekt Capital/ Twitter
That view reinforces warnings that have emerged since late last week about the possibility of a BTC price drop. However, Rekt Capital remains bullish on Bitcoin in general. He looked beyond the current correction and towards its potential target.
“Bitcoin broke the Downtrend. Now all look New Uptrend. Whether it needs to be rechecked or not is the question. But history shows that the medium to long term outlook looks optimistic,” he added .
On the weekly time frames, the 200-week moving average (WMA) remains at $26,200 and has been retested for the first time.
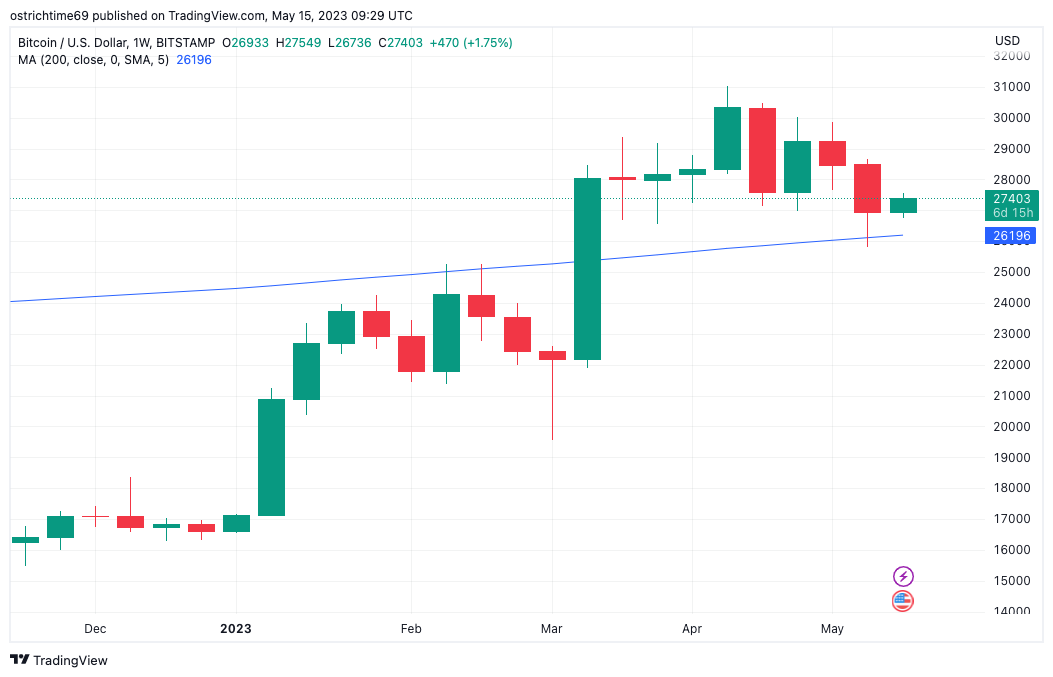
BTC/USD 1-week candlestick chart with MA-200 | Source: TradingView
Rekt Capital described the retest as “successful” but also reiterated the need to reclaim $27,600.
House Michaël van de Poppe thinks the BTC/USD pair is “ready to resume an uptrend.”
“Hold the key at $27,000 and we should be ready for a potential top,” he said, adding that Litecoin is also a notable name for upcoming events.
The LTC/USD pair is up more than 8% in the 24 hours to press time, hitting its highest level since May 6.
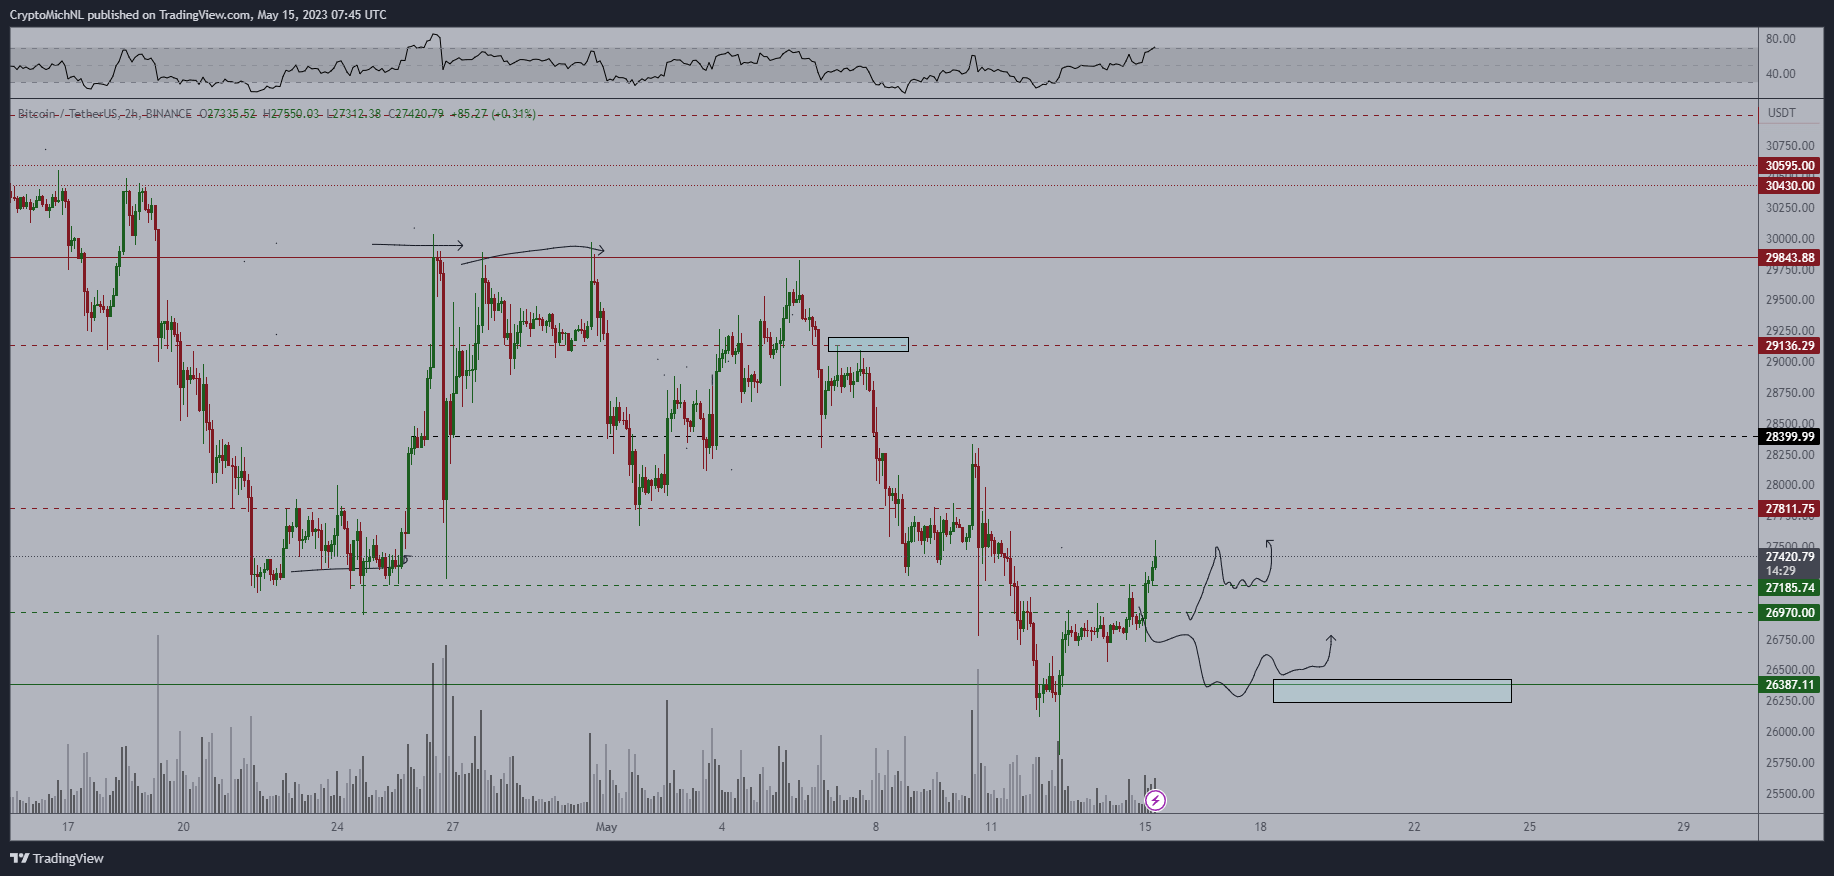
BTC/USD chart with caption | Source: Michael van de Poppe/Twitter
Accordingly, one of the traders who prefers the long-term trend, Mustache, thinks that the current price move is a time for Bitcoin and Altcoin to "take a breather".
“My opinion remains unchanged. Need to blow off steam before things get really crazy. To the bears: I will say this once and never say it again. Remember, you cannot compare a monthly chart with a daily chart.”
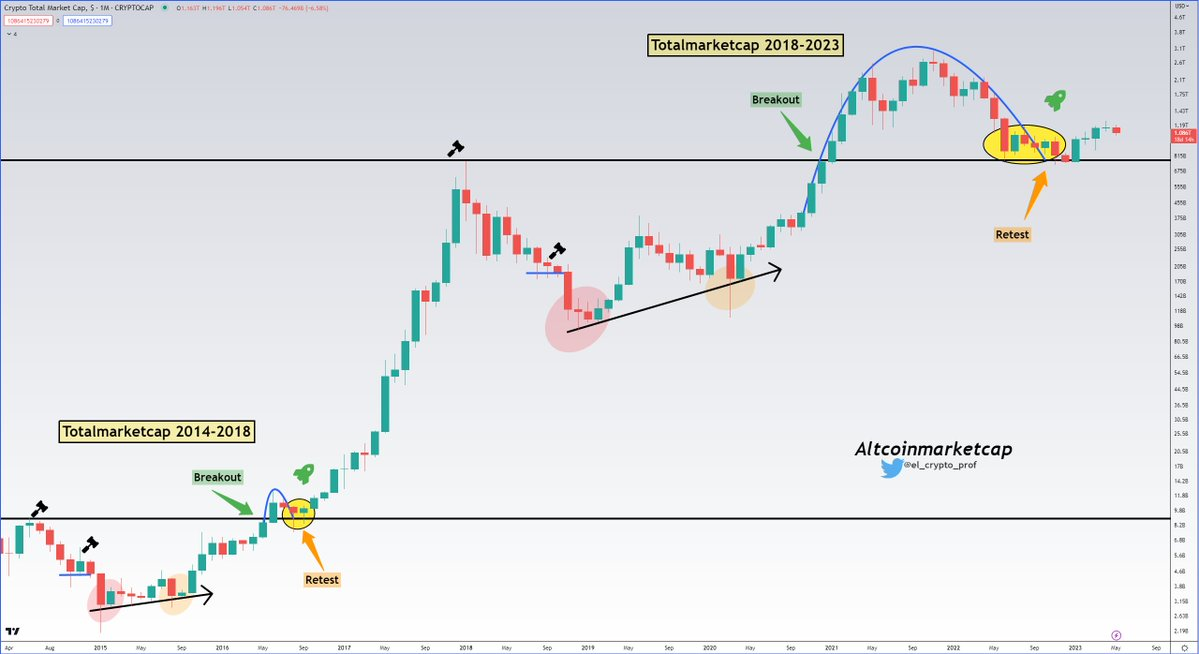
Cryptocurrency market cap chart | Source: Mustache/Twitter
Trader and analyst Trader Tardigrade, aka Alan, has made a similar bullish forecast based on Bitcoin's weekly relative strength index (RSI). For him, even the weekly close is cause for optimism.
Those looking for political events to trigger the price of BTC will likely be quite disappointed this week, as events in the United States have stabilized. After some macro data last week, the event that will unfold in the coming days is simply a speech by Jerome Powell, chair of the US Federal Reserve, on May 19.
As The Kobeissi Letter highlights, a total of 14 Fed officials will be available for comment in the coming days, with plenty of potential conflict. Kobeissi added that there is a high chance that volatility is starting to return to the market again.
Meanwhile, another point worth noting is the strength of the US dollar. In a market update on May 12, trading firm QCP Capital considered the US Dollar Index (DXY)'s return to a downtrend as the key event needed for risk assets to get the lights on. green.
“We see dollar strength as the main reason BTC is capped. This leads to market reflexes that are often blamed on known bearish factors such as the upcoming massive supply from the US government and Mt. Gox,” they declared.
DXY experienced a recovering week through May 14, after bouncing up at 101, near its lowest level since April of last year.
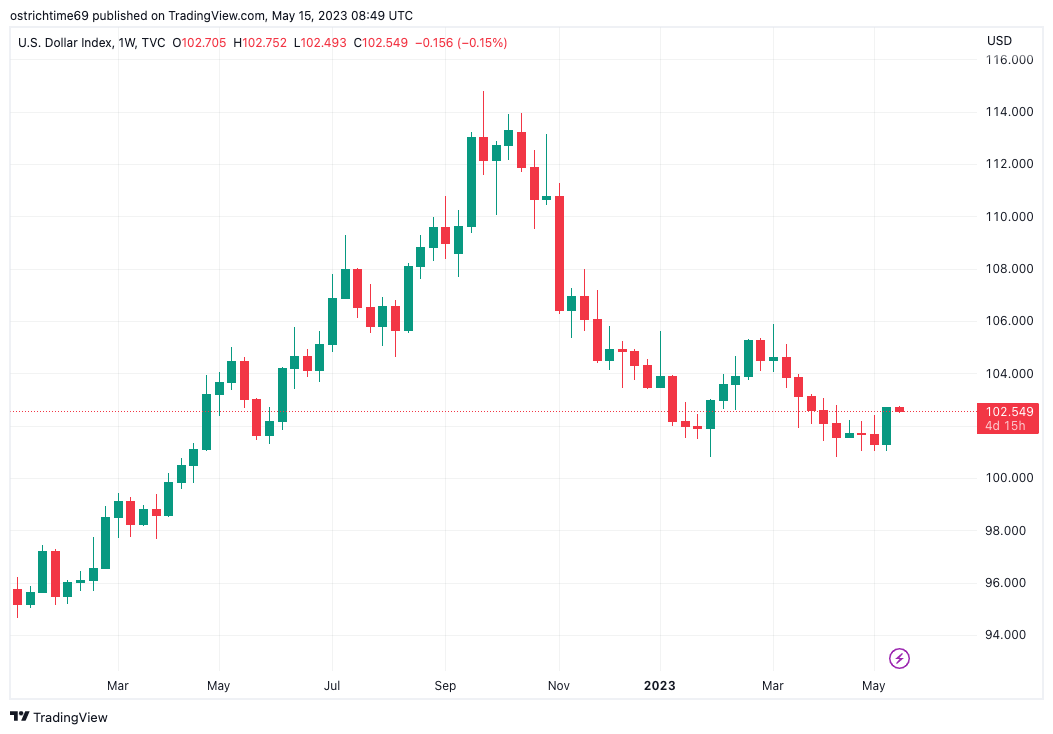
1-week US Dollar Index Chart | Source: TradingView
Bitcoin network difficulty has once again hit a new all-time high. After the previous correction that produced a slight retracement, the difficulty should increase by around 2% this week, according to estimates from BTC.
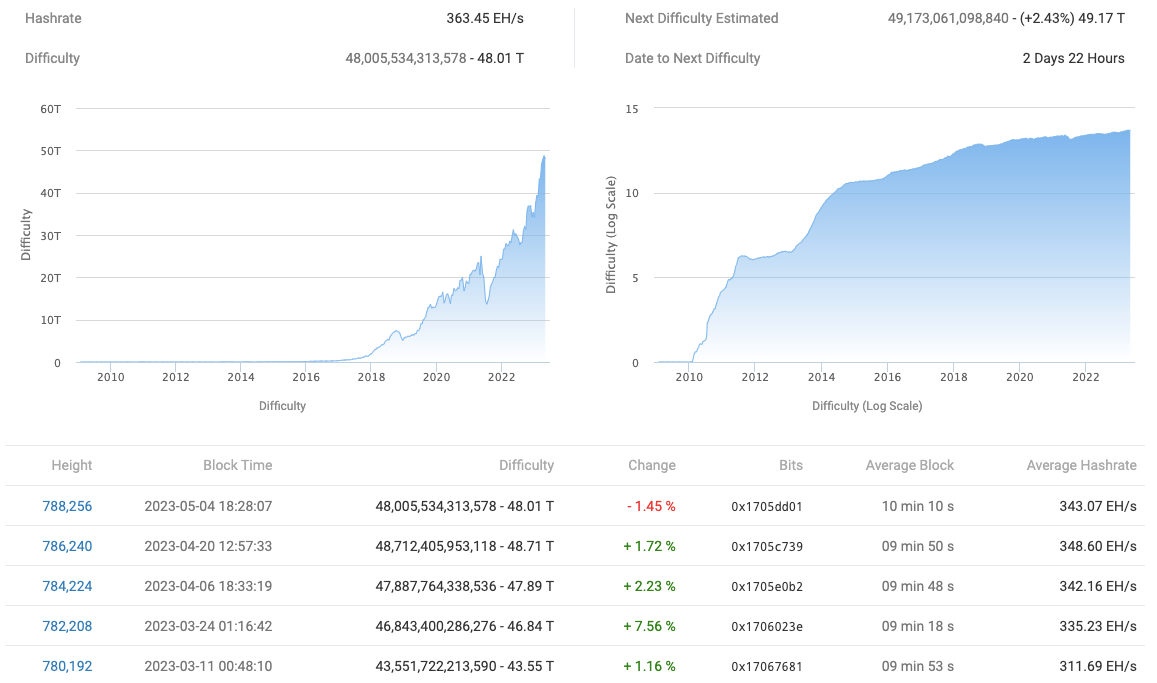
Bitcoin Network Fundamentals Overview (screenshot) | Source: BTC
This difficulty continues the upward trend, with competition for block subsidies among miners in “just up” mode. This trend has not been affected by recent short-term fluctuations in the fee market, so miner revenue has increased significantly.
Also, the hash rate will depend on the mining source. This also shows that mining-specific processing power is at an all-time high or close to an all-time high.
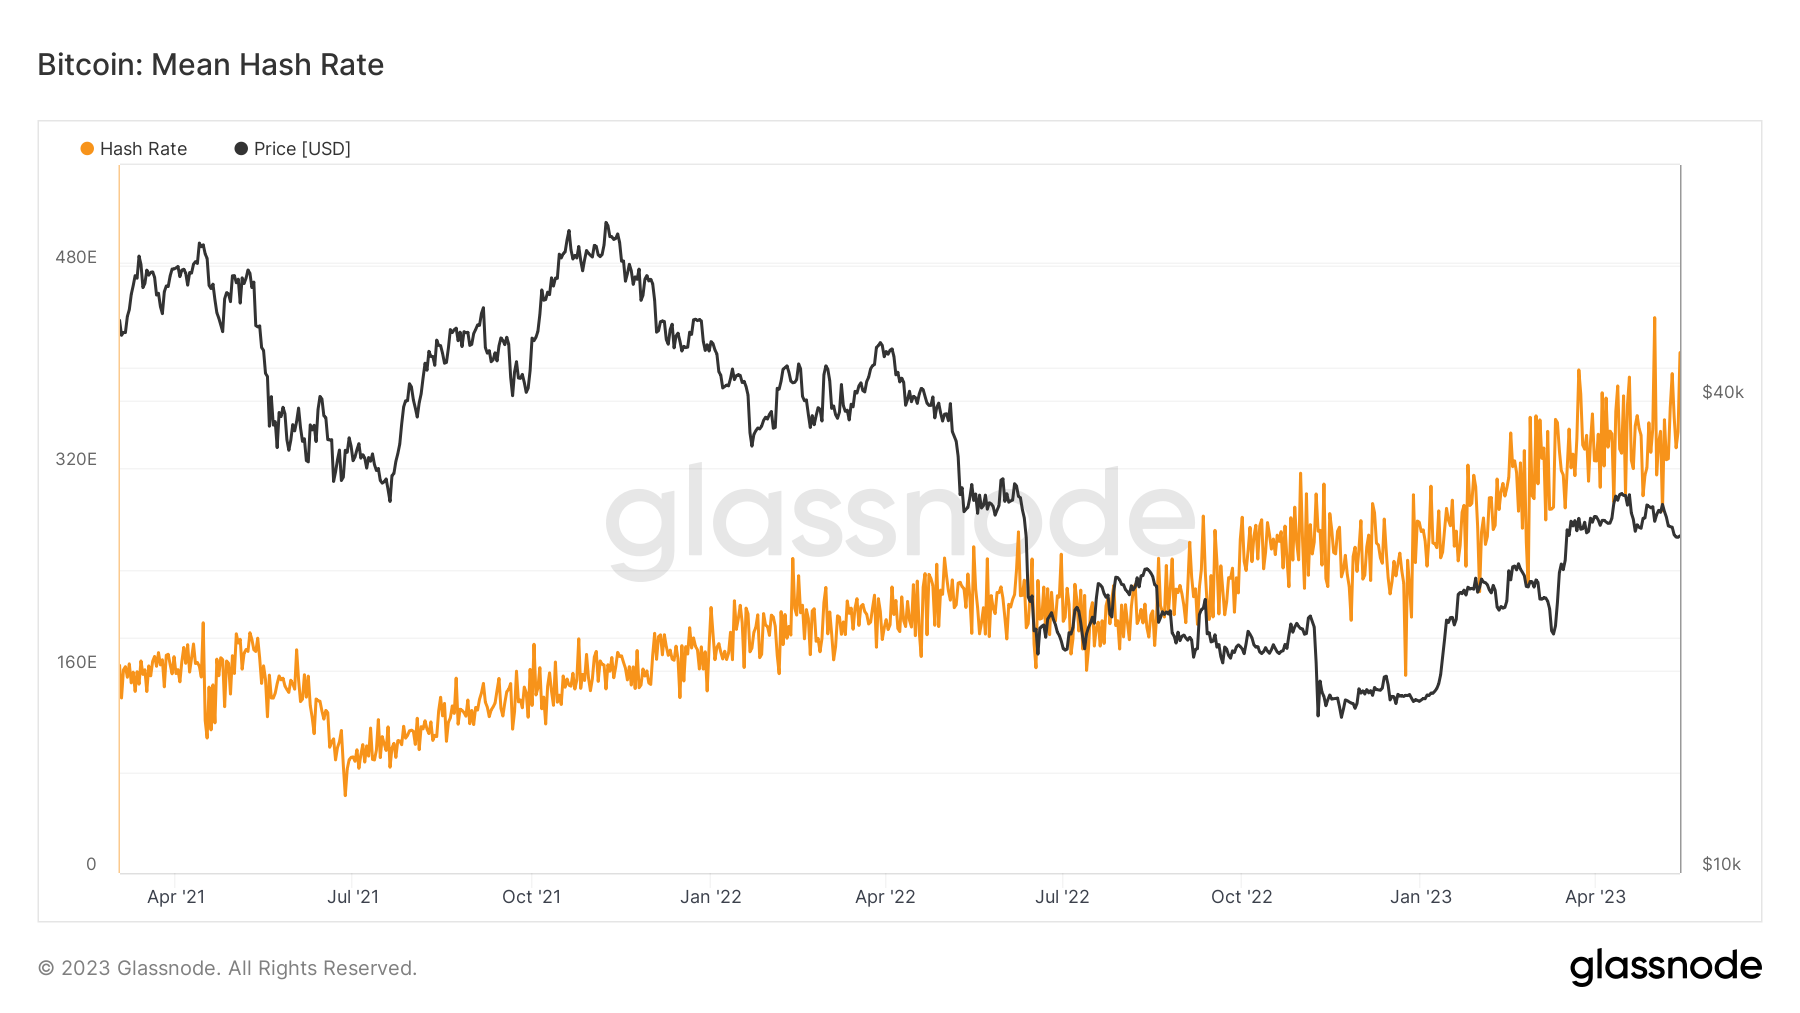
Bitcoin hash rate chart | Source: Glassnode
After hitting the highest level since November 2021, the Crypto Fear and Greed Index shows irrational euphoria, which has been hit hard by the recent price drop. As of May 15, the Fear & Greed index measures at 50/100, exactly in between its extremes and characteristic of “neutral” market sentiment.
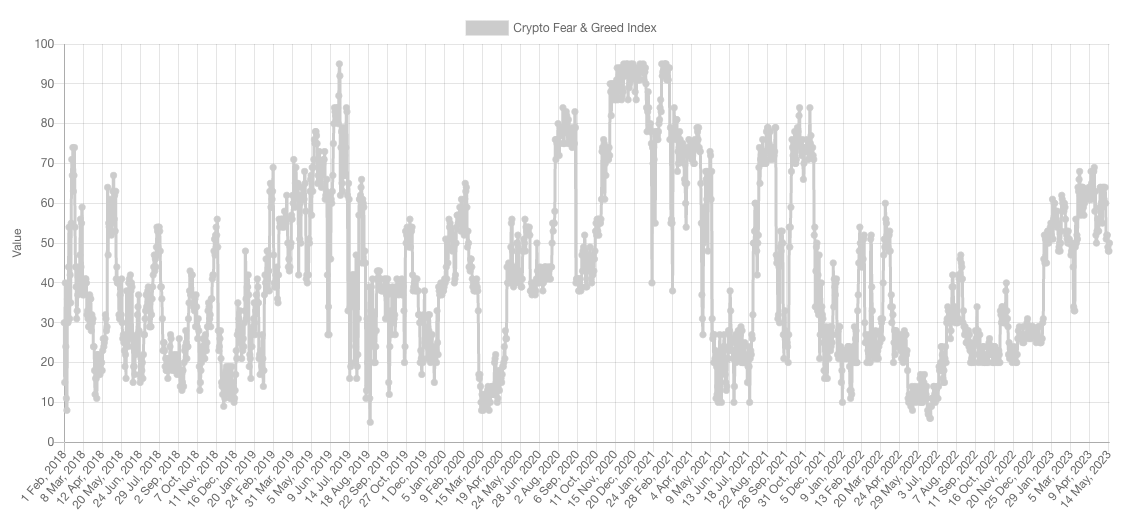
Cryptocurrency Fear and Greed Index (screenshot) | Source: alternative.me
Research firm Santiment also emphasized that the recent hype surrounding the memecoin has also dissipated and interest has returned to Stablecoin.
“With Bitcoin at $27,4000 and Ethereum at $1,825, traders seem annoyed with the fact that the market has stagnated. Stablecoin are seeing a huge increase in interest on social media, which is often a sign that they are not interested in the market for tokens like HEX & PEPE, which has plummeted.”