
50742**
02/06 11:08
XLM Technical Analysis and Upcoming Level Accor
XLM Technical Analysis and Upcoming Level
According to expert technical analysis, XLM has formed a bearish inverted cup and handle price action pattern on the daily time frame and is on the verge of a support or neckline breakdown.
Based on the recent price action, if XLM fails to hold this level or breaches the neckline and closes a daily candle below the $0.32 level, there is a strong possibility it could drop by 40% to reach the $0.20 level in the future.
Despite this bearish price action, the asset is still trading above the 200 Exponential Moving Average (EMA) on the daily time frame, indicating that XLM is in an uptrend.
Current Price Momentum
XLM is currently trading near $0.33 and has experienced a price decline of over 7.50% in the past 24 hours. However, during the same period, its trading volume dropped by 30%, indicating a fear of further price declines.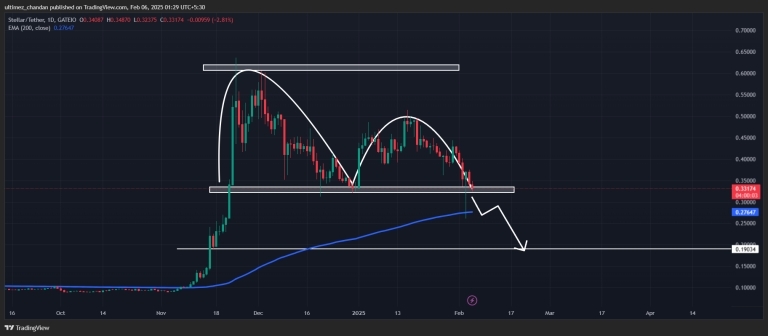
#Grab $100,000 Surprise Gifts#Tariffs Crash Crypto#Share Screenshots of Your 2024 Year-In-Review
2分享
全部评论0最新最热