asiftahsin
06/24 02:45
Technical Outlook: SOL Shows Signs of Stabilization, but Trend Remains Bearish
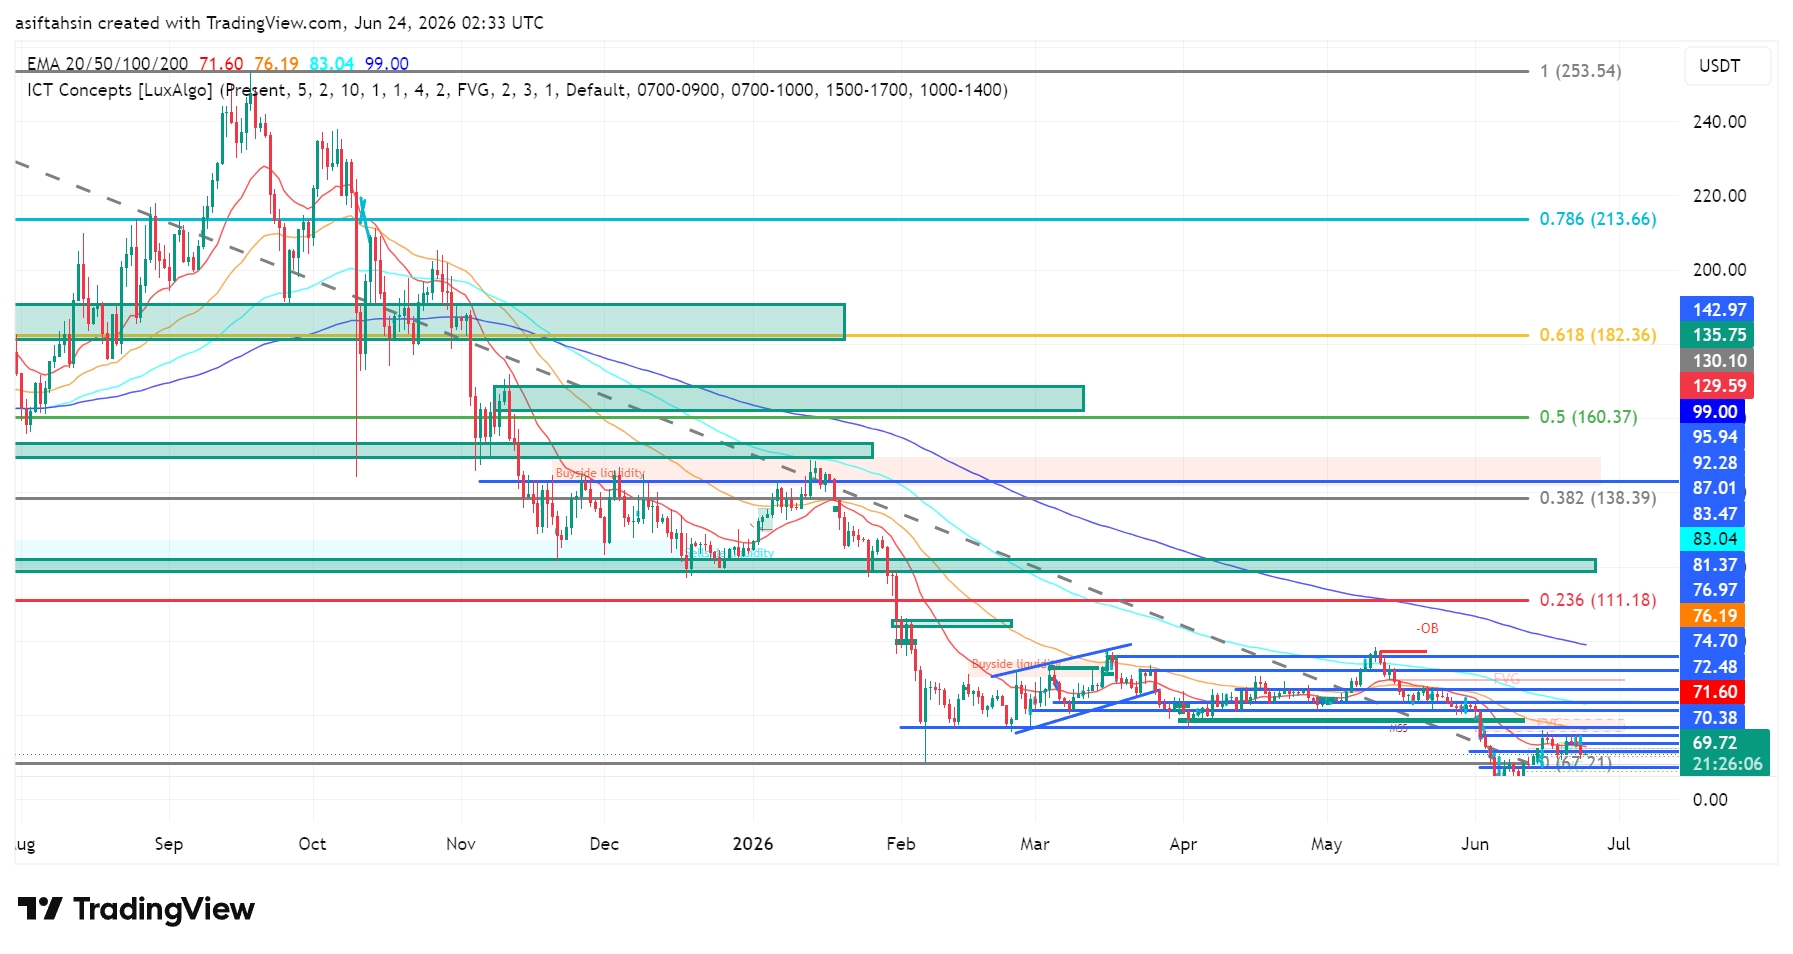
Solana is attempting to build a base after its recent sell-off, with price consolidating around the $69–70 support zone. While buyers have stepped in to defend this area, SOL remains below all major moving averages, keeping the broader trend bearish.
📈 EMA Structure (Bearish)
20 EMA: $71.60
50 EMA: $76.19
100 EMA: $83.04
200 EMA: $99.00
Price is trading below all four major EMAs.
The 20 EMA is acting as the first dynamic resistance.
The 50, 100, and 200 EMAs continue to confirm the prevailing downtrend.
👉 SOL needs to reclaim the $71.6–76.2 zone to shift short-term momentum in favor of the bulls.
📐 Fibonacci & Market Structure
Price remains well below the 0.236 Fibonacci level at $111.18, indicating the macro trend is still bearish.
Recent price action suggests a period of consolidation after the sharp decline.
Buyers continue defending the $69–70 demand zone, preventing another immediate breakdown.
A relief rally could target:
$70.40
$72.50
$76.20 (50 EMA)
$83.00 (100 EMA)
Failure to hold current support could lead to:
$67–68
$65 psychological support
Deeper downside if selling pressure accelerates.
🧠 ICT / Smart Money View
Sell-side liquidity has already been swept during the recent decline.
Several Fair Value Gaps (FVGs) remain above current price and could act as magnets if buyers gain momentum.
Market Structure Shift (MSS) remains bearish despite the recent stabilization.
Current price action appears to be accumulation within a broader downtrend rather than a confirmed reversal.
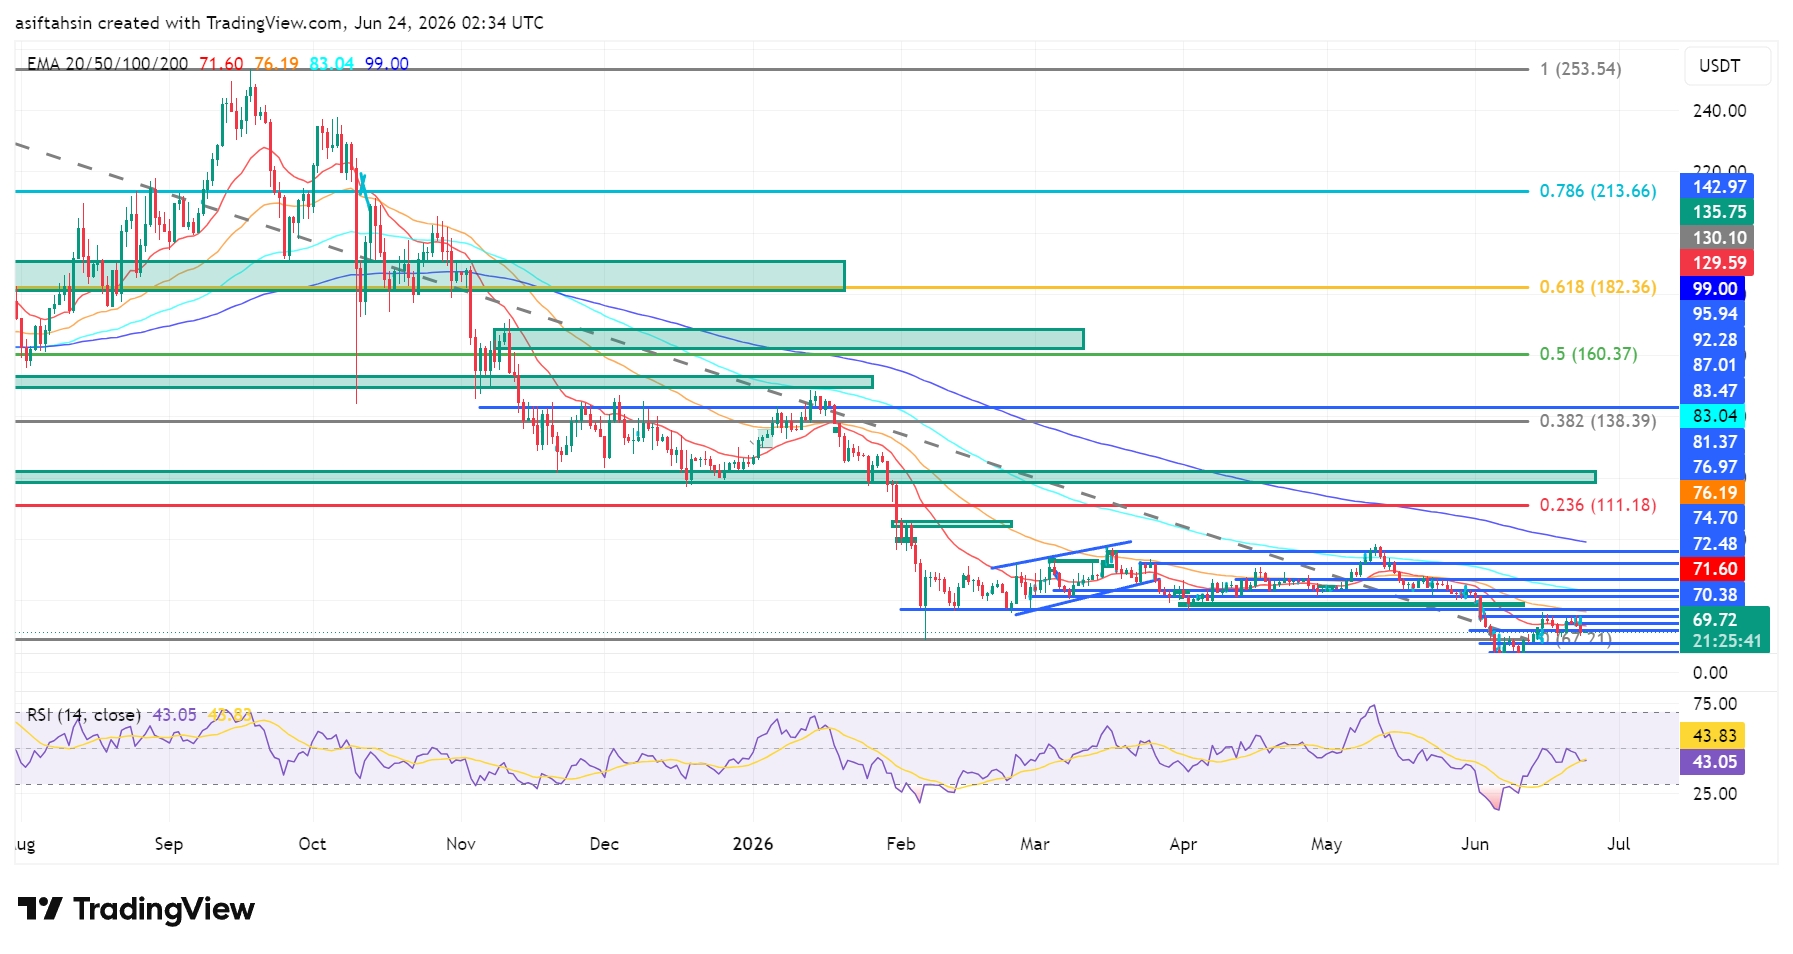
📉 RSI Momentum
RSI (14): 43.0
RSI has recovered from oversold conditions.
Momentum is improving but remains below the neutral 50 level.
This suggests recovery is underway, but bullish confirmation is still lacking.
SOLUSDT
永续
----%
#Claim1,200 USDT in the Monthly Creation Challenge
11分享
全部评论0最新最热