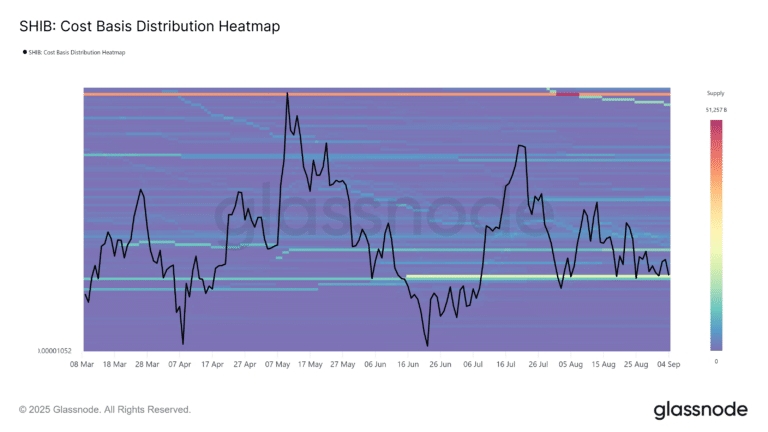
Shiba Inu might fall below the key demand zone highlighted by the cost basis distribution chart

Shiba Inu has been trading above a solid demand zone that bulls need to defend. However, the weekly price chart revealed that sellers may have the upper hand right now.
Shiba Inu’s [SHIB] price has been consolidating above the key demand zone at $0.000012 since mid-August. In fact, a recent AMBCrypto report noted that whales have been accumulating SHIB too.
That’s not all though as the exchange net position change has been negative since 17 August.
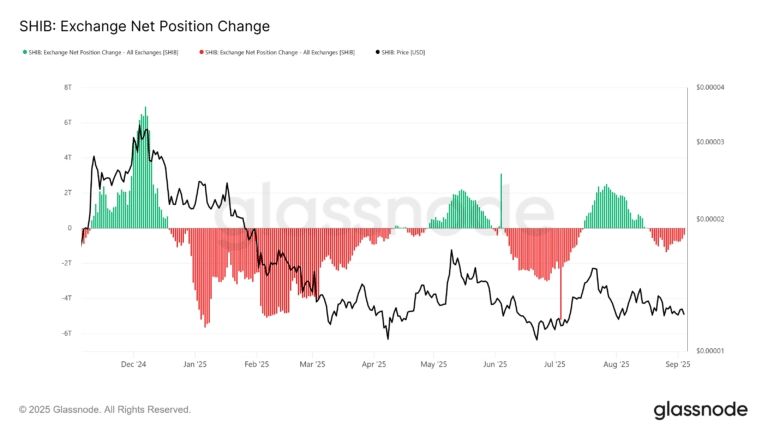
Here, negative flows represent outflows from exchanges – A classic sign of accumulation.
The cost basis distribution heatmap is a visualization of the supply density of SHIB across price levels. Warmer colors represent a greater supply acquired at that cost. The $0.000012 area represented a key demand zone, since it was where a sizeable amount of Shiba Inu has been acquired in recent months.
Therefore, bulls have to defend this key support if they want to drive a rally in the coming weeks.
Can Shiba Inu’s price stay above $0.000012, or should traders expect a southbound move
全部评论0最新最热