Measuring Market Asymmetry: The Glassnode Skew Index

insights.glassnodeXuất bản vào 2025-12-11Cập nhật gần nhất vào 2025-12-11

Tóm tắt

The Glassnode Skew Index is a new metric designed to measure market asymmetry by analyzing the entire volatility smile in options markets, rather than relying on the traditional 25-delta skew which only samples two points. It aggregates information from out-of-the-money puts and calls to produce a more comprehensive signal of where risk is priced. The index is calculated as the difference between UpVol (volatility from OTM calls, reflecting upside potential and bullish sentiment) and DownVol (volatility from OTM puts, indicating downside protection and fear). A positive value suggests optimism and call-buying demand, while a negative value signals hedging and risk aversion. The Skew Index helps identify market sentiment regimes, confirms or diverges from spot price movements, and interprets different tenors (e.g., 1-week, 3-month) to distinguish between short-term stress and longer-term outlooks. It is available for multiple assets (BTC, ETH, SOL, XRP, PAXG) and tenors, providing a cross-asset view of options market sentiment.

When assessing options markets, one of the most powerful signals is skew: how the market prices risk on the upside versus the downside. The standard approach for traders is to look at the 25-delta skew: a simple comparison between the implied volatility of a 25-delta call and a 25-delta put. This method is effective, simple and familiar, but it samples only two points on the volatility curve. As a result, it often misses structure embedded in the rest of the surface.

The Glassnode Skew Index addresses this by aggregating information across the full smile, producing a more robust signal of where risk is being priced. We explain the purpose of the new metric, how it is constructed, and how it can fit into the broader toolkit of options analysis.

To access the new metrics visit Glassnode Studio. Available to Professional plan users.

View metric

Introducing the Glassnode Skew Index

Instead of focusing on two isolated strikes, the Glassnode Skew Index condenses the entire shape of the volatility smile into a single, intuitive measure of market asymmetry.

We divide the curve into two regions: one representing downside risk, and one representing upside potential. Each region is transformed into a standardized volatility measure as we calculate how much volatility the market is pricing into that segment.

  • DownVol represents the total implied volatility from out-of-the-money put options — protection against falling prices. When traders rush to buy puts, DownVol rises, signalling fear or a desire to hedge.
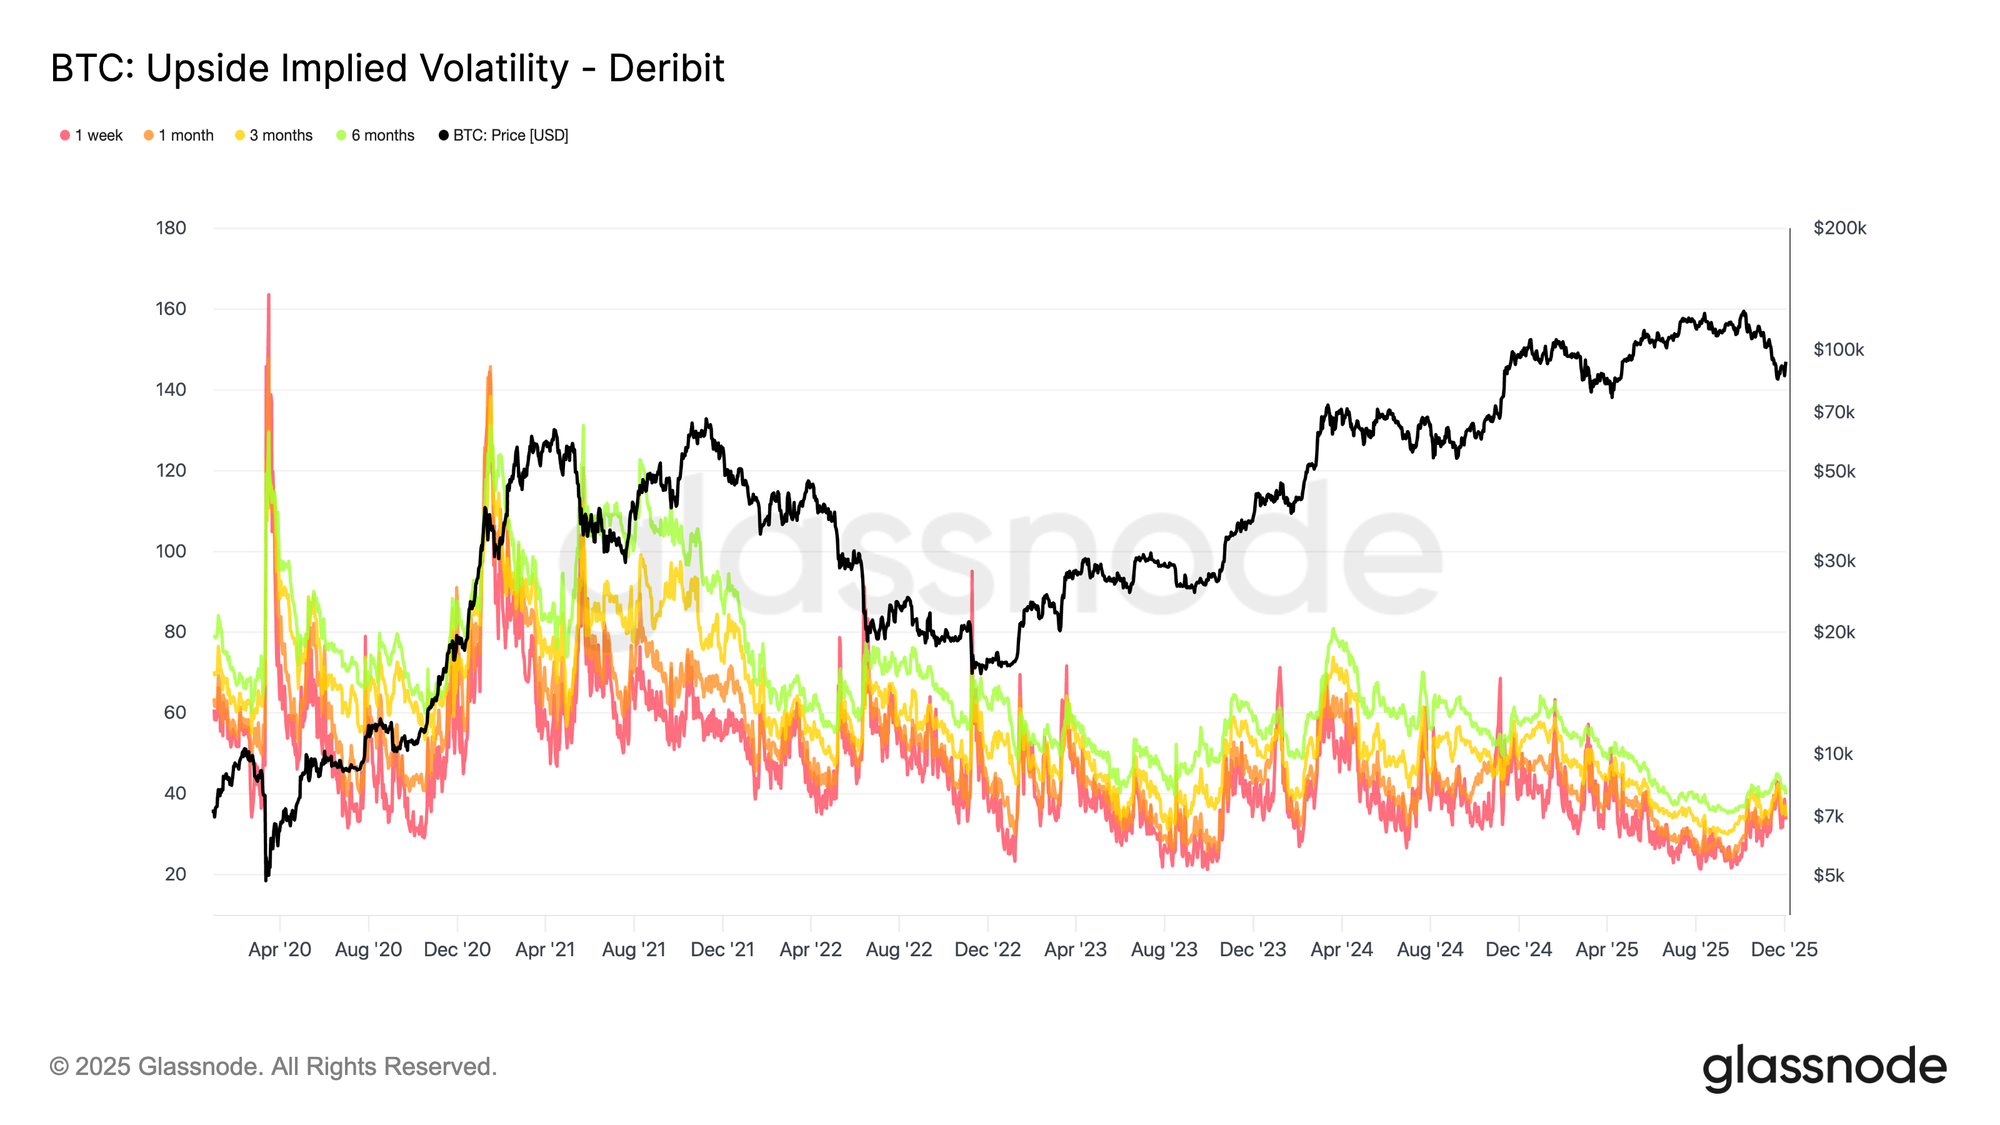
  • UpVol captures the opposite: the total volatility priced into out-of-the-money call options. This reflects how much traders are willing to pay for upside exposure or potential short-squeeze gains. When call demand increases, UpVol rises, often alongside strong bullish sentiment.

The difference between these two components gives us the skew index: Glassnode Skew Index = UpVol - DownVol

  • Positive values indicate a market that’s paying more for upside volatility – typically driven by optimism, momentum, or speculative call buying.
  • Negative values mean downside protection dominates, as investors prioritize safety and hedging over chasing upside.

In practical terms, The Glassnode Skew Index shows whether option traders are more concerned about a crash down, or more excited about a breakout up – and by how much.
How to Use the Skew Index

The Skew Index can be applied in several ways to interpret options market positioning, identify sentiment regimes, and understand how traders are distributing risk across upside and downside scenarios.

Map the Current Sentiment Regime

The index can help contextualize prevailing market conditions:

  • Deeply negative values indicate a market that is paying a premium for downside protection, consistent with defensive positioning.
  • Strongly positive values indicate that investors are paying more for upside participation, often in the context of strong trends and speculative call activity.

Monitoring these extremes helps identify when fear or euphoria dominates the options market.

Use it as a Confirmation or Divergence Tool

The index can complement movements in spot price:

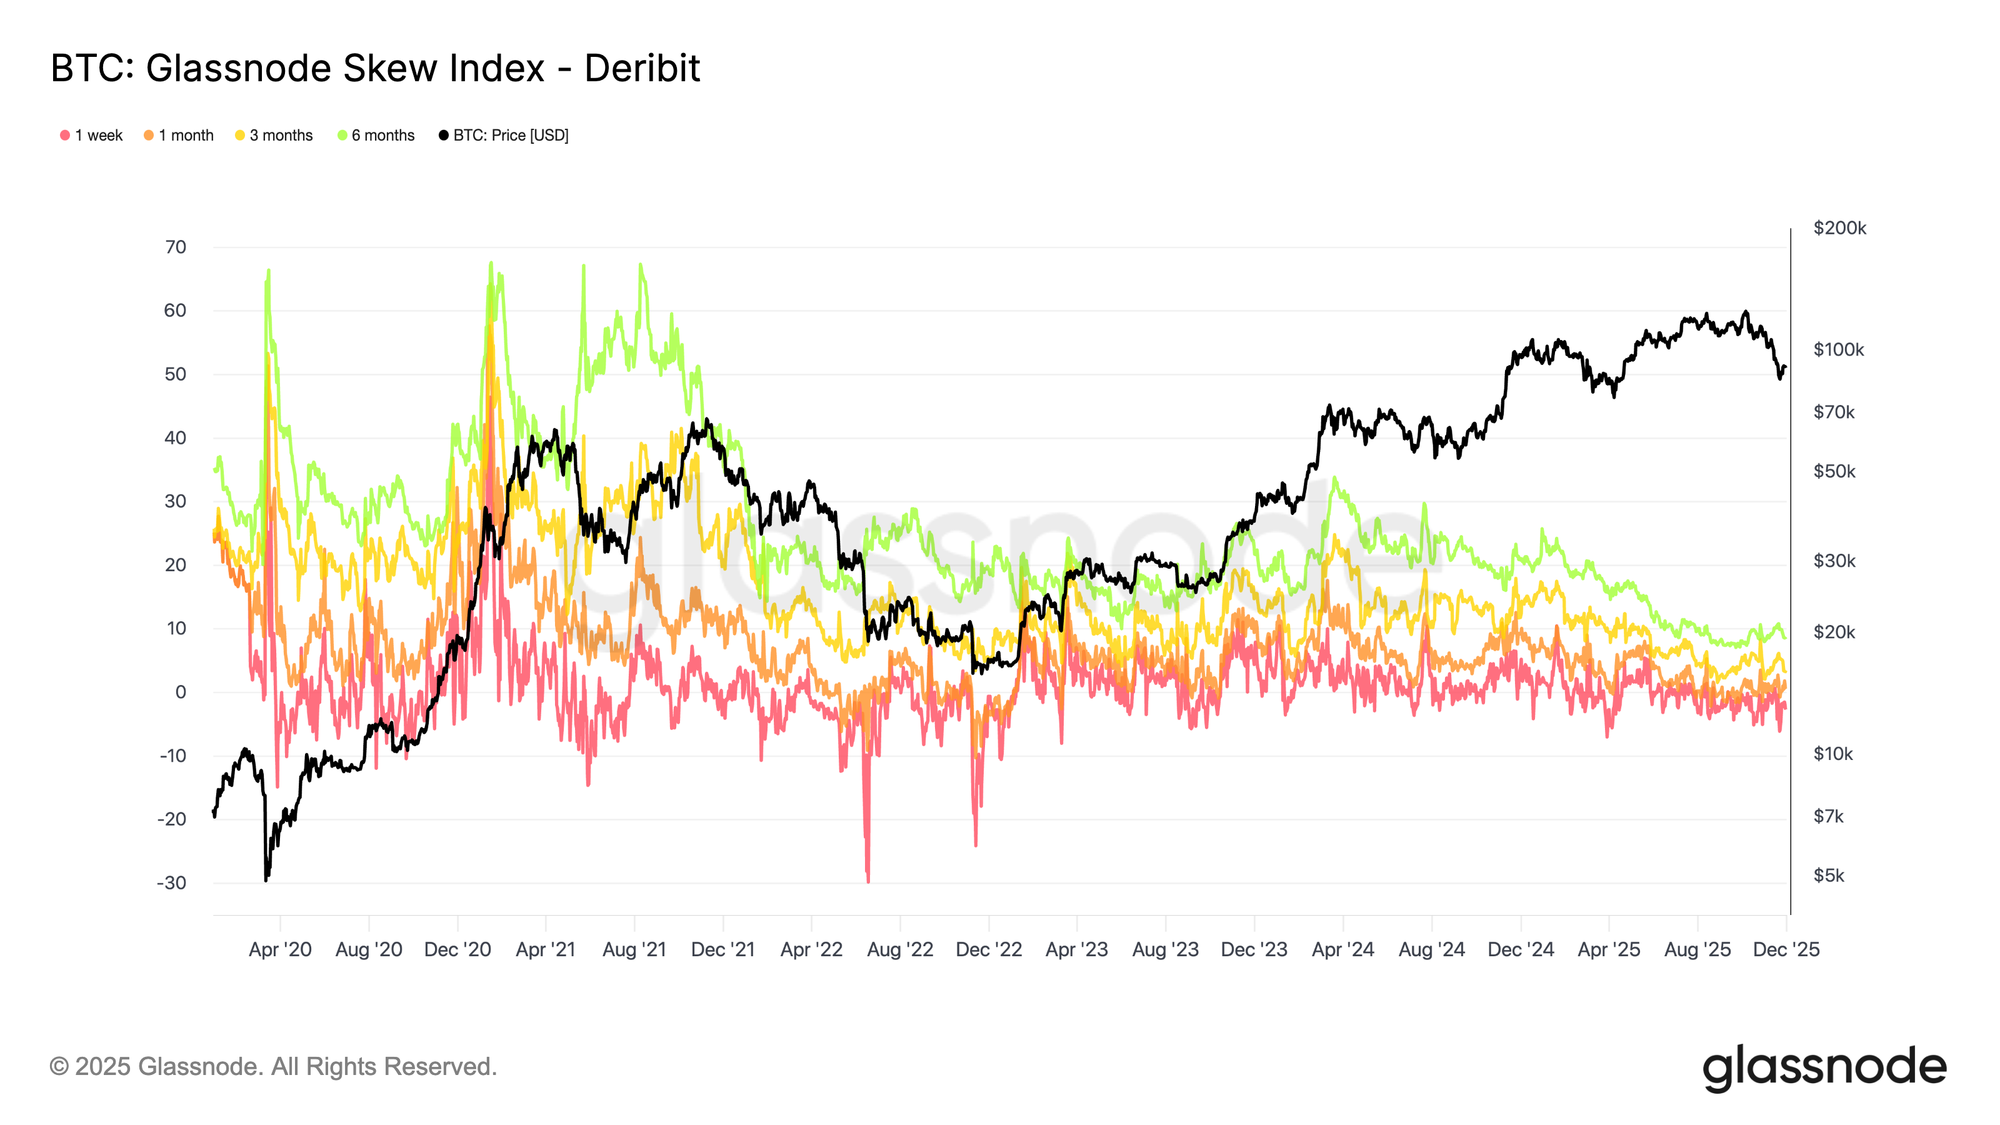
  • A rising Skew Index alongside a rising spot price suggests that the options market is reinforcing the move through increased demand for upside volatility.
  • A rally in spot with a Skew Index that stays sharply negative points to a distrusted move, where traders remain hedged and cautious.
  • A falling market with a heavily negative Skew Index confirms a classic risk-off environment with significant demand for protection.
  • A falling market with a positive Skew Index can indicate that traders are already looking through the weakness and positioning for a recovery.

This makes the index useful for evaluating whether options flows validate or contradict price action.

Interpreting Tenor Combinations

Different tenors can convey different layers of sentiment:

  • A negative 1-week skew with neutral or positive 3- and 6-month values often indicates temporary stress overlaying a constructive medium- and long-term outlook.
  • A very positive 1-week skew with subdued longer tenors suggests that traders are enthusiastic about the near-term, but reluctant to extend risk far into the future.
  • When skew is consistently elevated or depressed across all tenors, it points to a stable, regime-like sentiment environment rather than a short-lived spike.

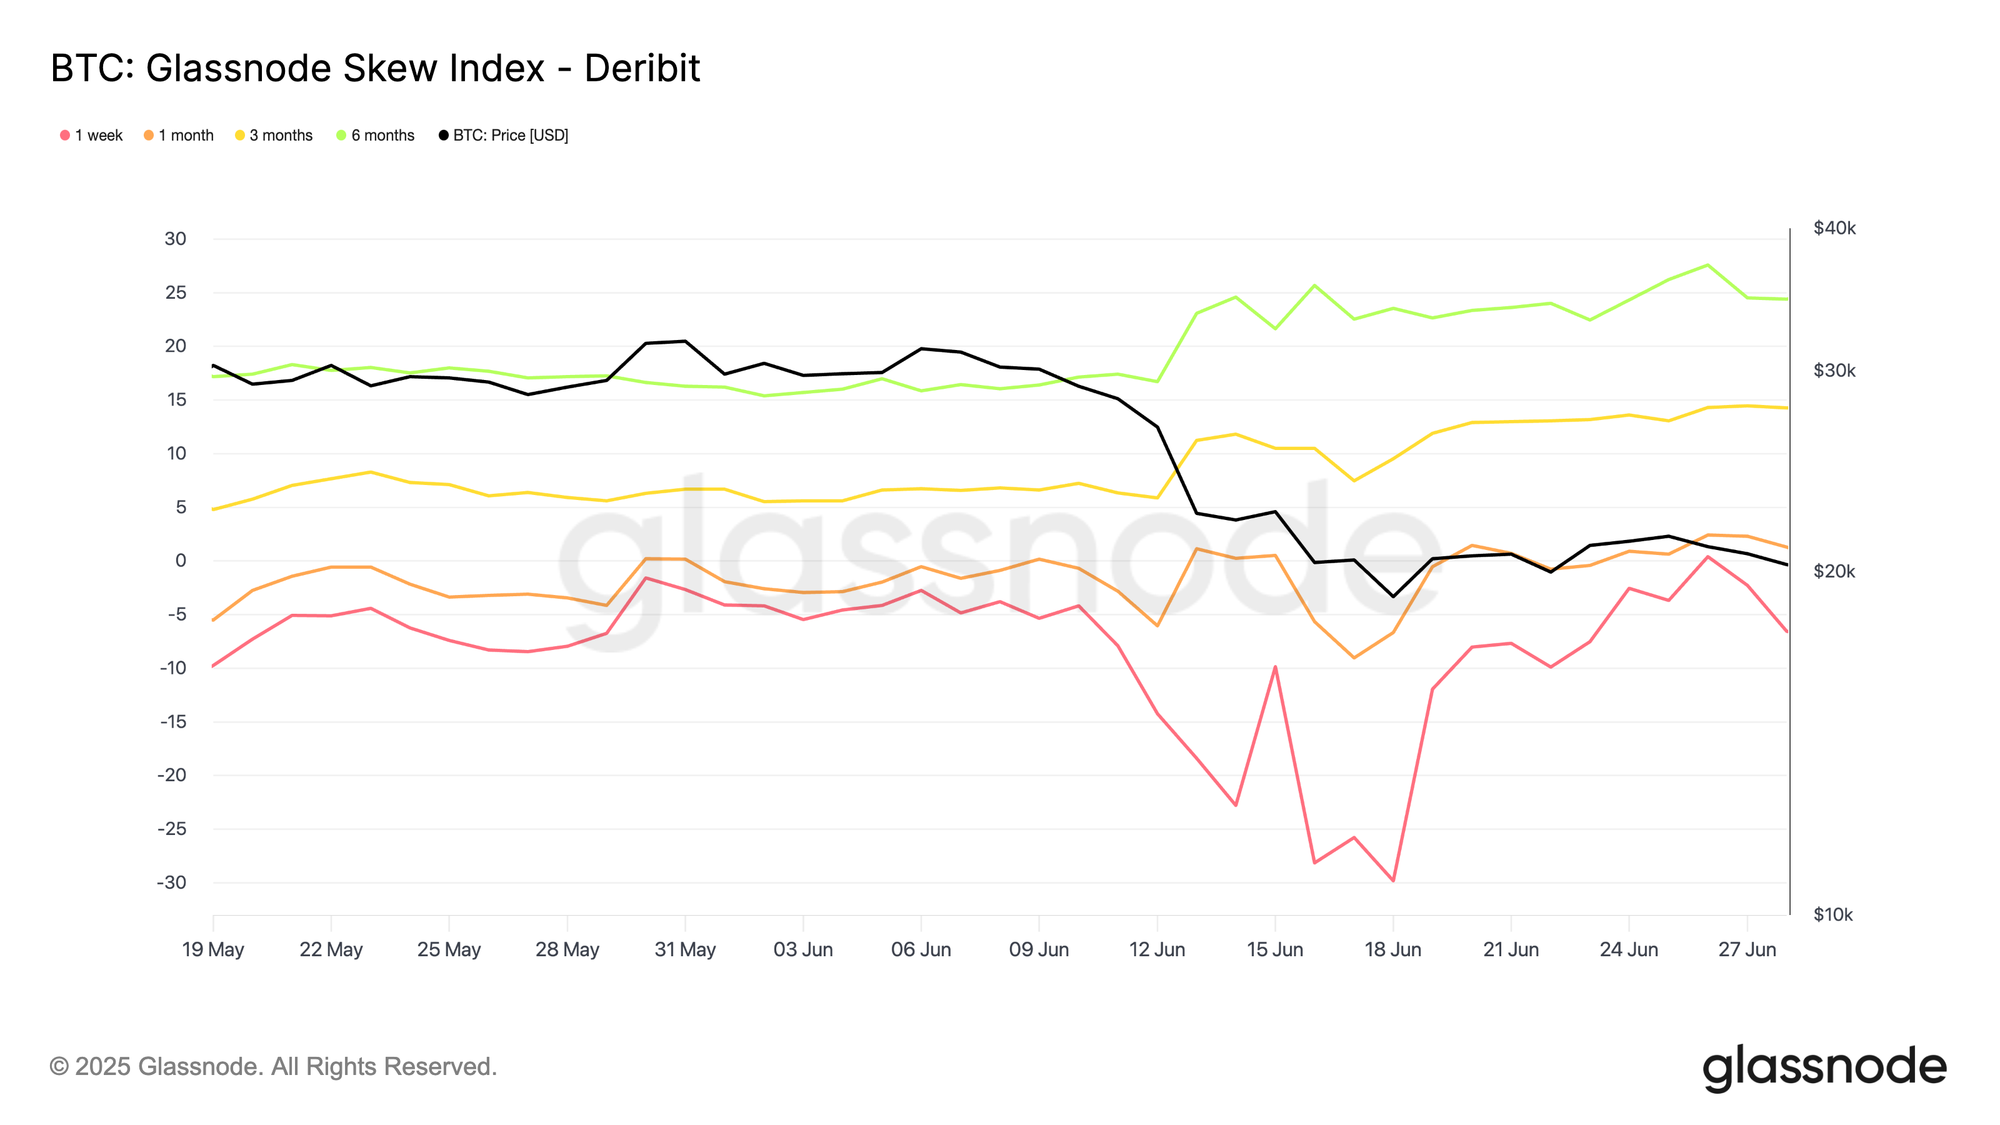
For example, in June 2022, we saw a clear tenor divergence: the 1-week Skew Index (red) plunged into deeply negative territory, signalling aggressive demand for short-dated puts over calls. Meanwhile, the 3-month (yellow) and 6-month (green) skews moved higher, indicating that investors were still willing to pay relatively more for upside exposure further out the curve.

In other words, the fear was mainly short-term, and longer-dated options continued to lean towards upside scenarios, implying that many participants expect better prices further out on the horizon.
How it works under the hood

We calculate the Glassnode Skew Index by aggregating option prices across many strikes on both sides of the distribution. These prices are transformed into standardized measures of upside and downside implied volatility, aligned to fixed maturities such as 1 week, 1 month, 3 months, and 6 months.

We then combine data across major venues so traders can compare BTC, ETH, SOL, XRP, or PAXG on consistent terms. This standardization removes the distortions that arise from strike irregularities, liquidity gaps, or exchange-specific conventions.

The result is a cross-asset, cross-tenor gauge of options market sentiment that captures the full structure of the volatility smile rather than relying on a single-point skew measure.

Available for:

  • Resolutions: 10 minutes, hourly, daily
  • Tenors: 1 week, 1 month, 3 months, 6 months
  • Assets: BTC, ETH, SOL, XRP, PAXG
  • Exchanges: Deribit, OKX

  • Follow us on X for timely market updates and analysis
  • Join our Telegram channel for regular market insights
  • For on-chain metrics, dashboards, and alerts, visit Glassnode Studio

Disclaimer: This report is for informational and educational purposes only. The analysis represents a limited case study with significant constraints and should not be interpreted as investment advice or definitive trading signals. Past performance patterns do not guarantee future results. Always conduct thorough due diligence and consider multiple factors before making investment decisions.


Tiền kỹ thuật số thịnh hành

Nội dung Liên quan

Vụ Tiêu Hao Ngân Khố BonkDAO Cho Thấy Rủi Ro Quản Trị Trên Solana Là Có Thật

Kho bạc BonkDAO đã bị rút cạn khoảng 20 triệu USD sau khi một đề xuất quản trị độc hại được thông qua thông qua nền tảng Realms, minh họa rõ ràng về rủi ro quản trị DAO trên Solana. Vụ việc không phải do lỗi của blockchain Solana, mà là một cuộc tấn công vào cơ chế quản trị, nơi kẻ tấn công lợi dụng các quy tắc bỏ phiếu và trọng số biểu quyết để chiếm đoạt tài sản một cách hợp lệ về mặt kỹ thuật. Sự kiện này cảnh báo rằng thiết kế quản trị cần được xem xét kỹ lưỡng như bảo mật mã hợp đồng. Các hệ thống bỏ phiếu, quy tắc đề xuất và quyền kiểm soát kho bạc có thể trở thành mặt tấn công nếu có điểm yếu. Realms, một công cụ quản trị DAO phổ biến trên Solana, là trung tâm của vụ việc, thúc đẩy nhu cầu xem xét lại các cấu hình về ngưỡng tán thành, thời gian bỏ phiếu và giới hạn thực thi. Vụ việc đặt ra thử thách về niềm tin đối với cộng đồng BONK, một tài sản meme quan trọng trên Solana. Phản ứng rõ ràng và các kế hoạch khắc phục, cải cách từ nhóm phát triển sẽ quyết định khả năng phục hồi niềm tin. Bài học then chốt là quản trị DAO không chỉ là vấn đề tổ chức mà còn là cơ sở hạ tầng bảo mật; tài sản cộng đồng có thể gặp rủi ro ngay cả khi blockchain nền hoạt động hoàn hảo.

bitcoinist19 phút trước

Vụ Tiêu Hao Ngân Khố BonkDAO Cho Thấy Rủi Ro Quản Trị Trên Solana Là Có Thật

bitcoinist19 phút trước

Bitcoin: Liệu động thái của cá voi 130,5 triệu USD có làm trật bánh đà đưa BTC tiến tới 70.000 USD?

Một cá voi Bitcoin đã thực hiện giao dịch chuyển 2.000 BTC, trị giá 130,5 triệu USD, sau 6 năm tích lũy. Trong đó, 800 BTC được chuyển đến Cumberland để giao dịch OTC (cho thấy ý định bán tiềm năng), trong khi 1.200 BTC được chuyển sang địa chỉ mới, cho thấy có thể đây là động thái tái định vị danh mục hơn là thoát hoàn toàn. Mặc dù động thái của cá voi lớn thu hút sự chú ý, nhưng giá Bitcoin dường như không bị ảnh hưởng tiêu cực. BTC tiếp tục xu hướng tăng, đạt mức cao hàng tháng khoảng 66.314 USD, với các chỉ báo kỹ thuật như Stochastic Momentum Index và Squeeze Momentum Indicator cho thấy động lượng tăng vẫn còn mạnh, mở đường cho mục tiêu vượt 70.000 USD. Tuy nhiên, một số chỉ số on-chain lại cảnh báo áp lực bán có thể gia tăng trong ngắn hạn. Tỷ lệ Dòng chảy Quỹ (Fund Flow Ratio) và Chênh lệch dòng vào sàn (Exchange Netflow) đều tăng lên mức dương, báo hiệu nhiều BTC đang được chuyển vào các sàn giao dịch. Điều này thường làm tăng rủi ro bán tháo và có thể làm suy yếu động lượng, khiến giá có nguy cơ điều chỉnh về vùng 64.800 USD nếu áp lực bán gia tăng.

ambcrypto47 phút trước

Bitcoin: Liệu động thái của cá voi 130,5 triệu USD có làm trật bánh đà đưa BTC tiến tới 70.000 USD?

ambcrypto47 phút trước

Tích Hợp Axelar Vào XRP Ledger Mở Ra Một Lộ Trình DeFi Đa Chuỗi Mới

XRP Ledger đã tích hợp với Axelar, mở ra một tuyến đường mới cho XRP và các tài sản gốc của XRPL di chuyển vào các môi trường DeFi đa chuỗi rộng lớn hơn. Việc tích hợp này cho phép XRP kết nối với các ứng dụng trên các hệ sinh thái EVM và Cosmos thông qua công nghệ tương tác chuỗi chéo của Axelar. Điều này không biến XRPL thành một chuỗi EVM gốc, mà cung cấp một cây cầu rõ ràng hơn để tài sản XRPL vào các mạng và ứng dụng khác. Tính thanh khoản là lợi thế của XRP, nhưng trong DeFi, tài sản cần có khả năng di chuyển giữa các giao thức và chuỗi. Kết nối này giúp XRP tiếp cận nhiều ứng dụng DeFi hơn bên ngoài hệ sinh thái riêng của nó, tăng cường tính hữu dụng trong một thị trường đa chuỗi. Tuy nhiên, cần lưu ý rằng tích hợp này không làm cho XRPL chạy hợp đồng thông minh Ethereum một cách gốc. Người dùng có thể di chuyển tài sản nhưng sẽ đối mặt với rủi ro từ cầu nối. Thách thức thực sự nằm ở việc liệu người dùng và nhà phát triển có thực sự sử dụng tuyến đường mới này hay không, điều này phụ thuộc vào thanh khoản, sự tin cậy của cầu nối và các ứng dụng được xây dựng xung quanh nó. Trong bối cảnh thị trường tiền mã hóa đang hướng tới khả năng tương tác, việc kết nối này giúp XRP tham gia vào sự phát triển DeFi bên ngoài môi trường ban đầu của nó. Bài kiểm tra thực sự sẽ là khối lượng giao dịch và hoạt động bền vững thông qua các tuyến đường được kết nối bởi Axelar.

bitcoinist49 phút trước

Tích Hợp Axelar Vào XRP Ledger Mở Ra Một Lộ Trình DeFi Đa Chuỗi Mới

bitcoinist49 phút trước

Giao dịch

Giao ngay

Bài viết Nổi bật

Làm thế nào để Mua ONE

Chào mừng bạn đến với HTX.com! Chúng tôi đã làm cho mua Harmony (ONE) trở nên đơn giản và thuận tiện. Làm theo hướng dẫn từng bước của chúng tôi để bắt đầu hành trình tiền kỹ thuật số của bạn.Bước 1: Tạo Tài khoản HTX của BạnSử dụng email hoặc số điện thoại của bạn để đăng ký tài khoản miễn phí trên HTX. Trải nghiệm hành trình đăng ký không rắc rối và mở khóa tất cả tính năng. Nhận Tài khoản của tôiBước 2: Truy cập Mua Crypto và Chọn Phương thức Thanh toán của BạnThẻ Tín dụng/Ghi nợ: Sử dụng Visa hoặc Mastercard của bạn để mua Harmony (ONE) ngay lập tức.Số dư: Sử dụng tiền từ số dư tài khoản HTX của bạn để giao dịch liền mạch.Bên thứ ba: Chúng tôi đã thêm những phương thức thanh toán phổ biến như Google Pay và Apple Pay để nâng cao sự tiện lợi.P2P: Giao dịch trực tiếp với người dùng khác trên HTX.Thị trường mua bán phi tập trung (OTC): Chúng tôi cung cấp những dịch vụ được thiết kế riêng và tỷ giá hối đoái cạnh tranh cho nhà giao dịch.Bước 3: Lưu trữ Harmony (ONE) của BạnSau khi mua Harmony (ONE), lưu trữ trong tài khoản HTX của bạn. Ngoài ra, bạn có thể gửi đi nơi khác qua chuyển khoản blockchain hoặc sử dụng để giao dịch những tiền kỹ thuật số khác.Bước 4: Giao dịch Harmony (ONE)Giao dịch Harmony (ONE) dễ dàng trên thị trường giao ngay của HTX. Chỉ cần truy cập vào tài khoản của bạn, chọn cặp giao dịch, thực hiện giao dịch và theo dõi trong thời gian thực. Chúng tôi cung cấp trải nghiệm thân thiện với người dùng cho cả người mới bắt đầu và người giao dịch dày dạn kinh nghiệm.

Tổng lượt xem 615Xuất bản vào 2024.12.12Cập nhật vào 2026.06.02

Làm thế nào để Mua ONE

Thảo luận

Chào mừng đến với Cộng đồng HTX. Tại đây, bạn có thể được thông báo về những phát triển nền tảng mới nhất và có quyền truy cập vào thông tin chuyên sâu về thị trường. Ý kiến ​​của người dùng về giá của ONE (ONE) được trình bày dưới đây.

活动图片