Bears In Control

insights.glassnodeXuất bản vào 2026-02-04Cập nhật gần nhất vào 2026-02-04

Tóm tắt

Bitcoin has decisively broken below the True Market Mean near $80.2k, confirming a shift into a bearish regime. On-chain metrics show increased realized losses and investor stress, while key demand zones are identified between $70k–$80k. Off-chain, institutional flows have turned negative, spot volumes remain weak, and futures liquidations have accelerated. Options markets reflect heightened fear, with elevated implied volatility and steep downside skew indicating strong demand for protection. Without a return of sustained spot demand and inflows, the market remains fragile and vulnerable to further downside.

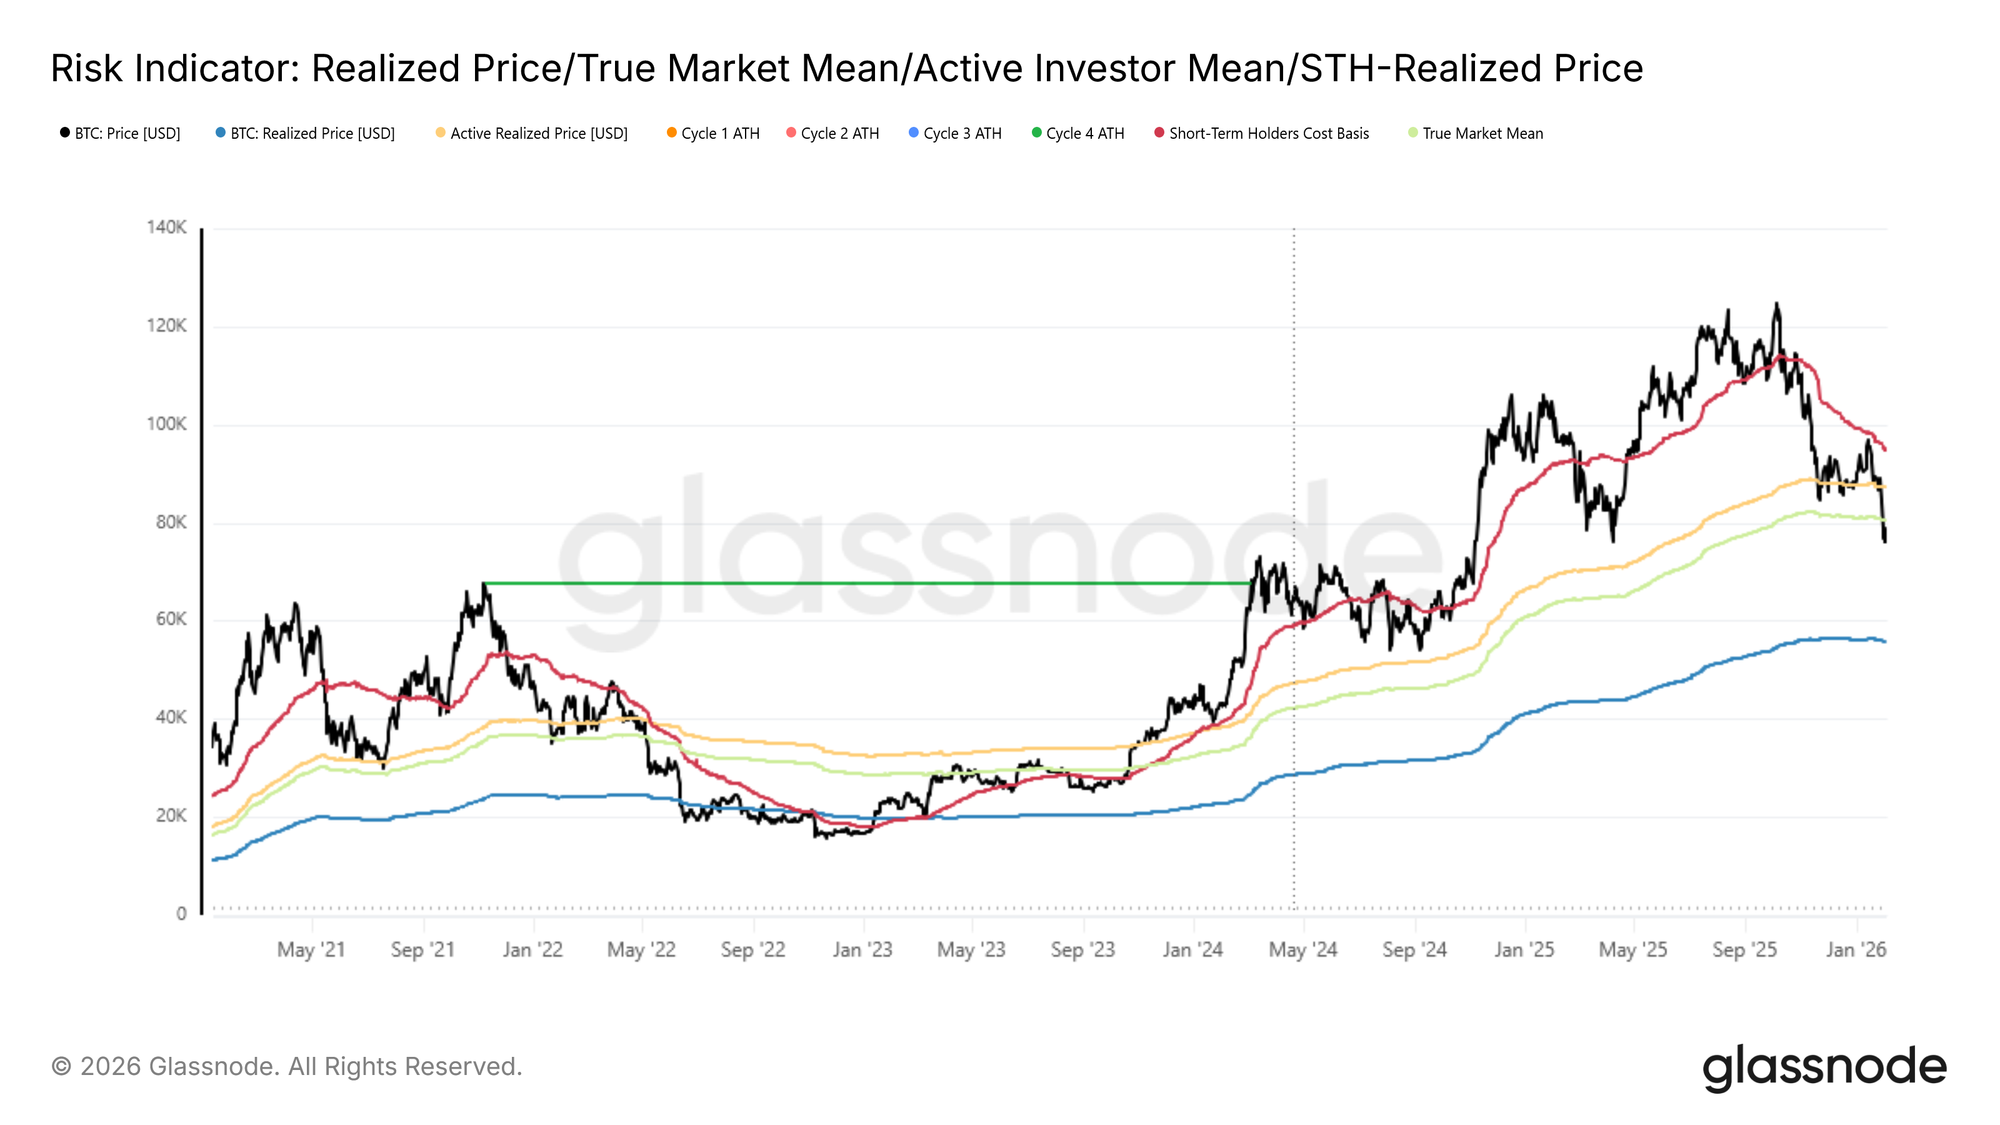
Following last week’s assessment, where we highlighted mounting downside risk after price failed to reclaim the short-term holder cost basis around $94.5k, the market has now decisively broken below the True Market Mean.

Below the Structural Mean

True Market Mean, which represents the aggregate cost basis of the actively circulating supply, excluding long-inactive coins such as lost supply, early miner holdings, and Satoshi-era coins, has repeatedly served as the final line of support throughout the current shallow bear phase.

The loss of this structural anchor confirms a deterioration that has been building since late November, with the broader market configuration increasingly resembling the early-2022 transition from range compression into a deeper bear market regime. Weak demand follow-through, combined with persistent sell-side pressure, suggests that the market is now in a more fragile equilibrium.

From a mid-term perspective, price is increasingly constrained within a broader valuation corridor. On the downside, the True Market Mean near $80.2k now acts as overhead resistance, while the Realized Price, currently around $55.8k, defines the lower bound where long-term capital is historically re-engaged.
Live Chart

Mapping the First Demand Zones

With the structural backdrop now reset, attention naturally turns to downside stabilization. As the market transitions deeper into this phase of the cycle, the key question shifts toward identifying zones where a durable bottom may begin to form. While no single metric can define this with certainty, several on-chain tools provide insight into where near-term demand may emerge.

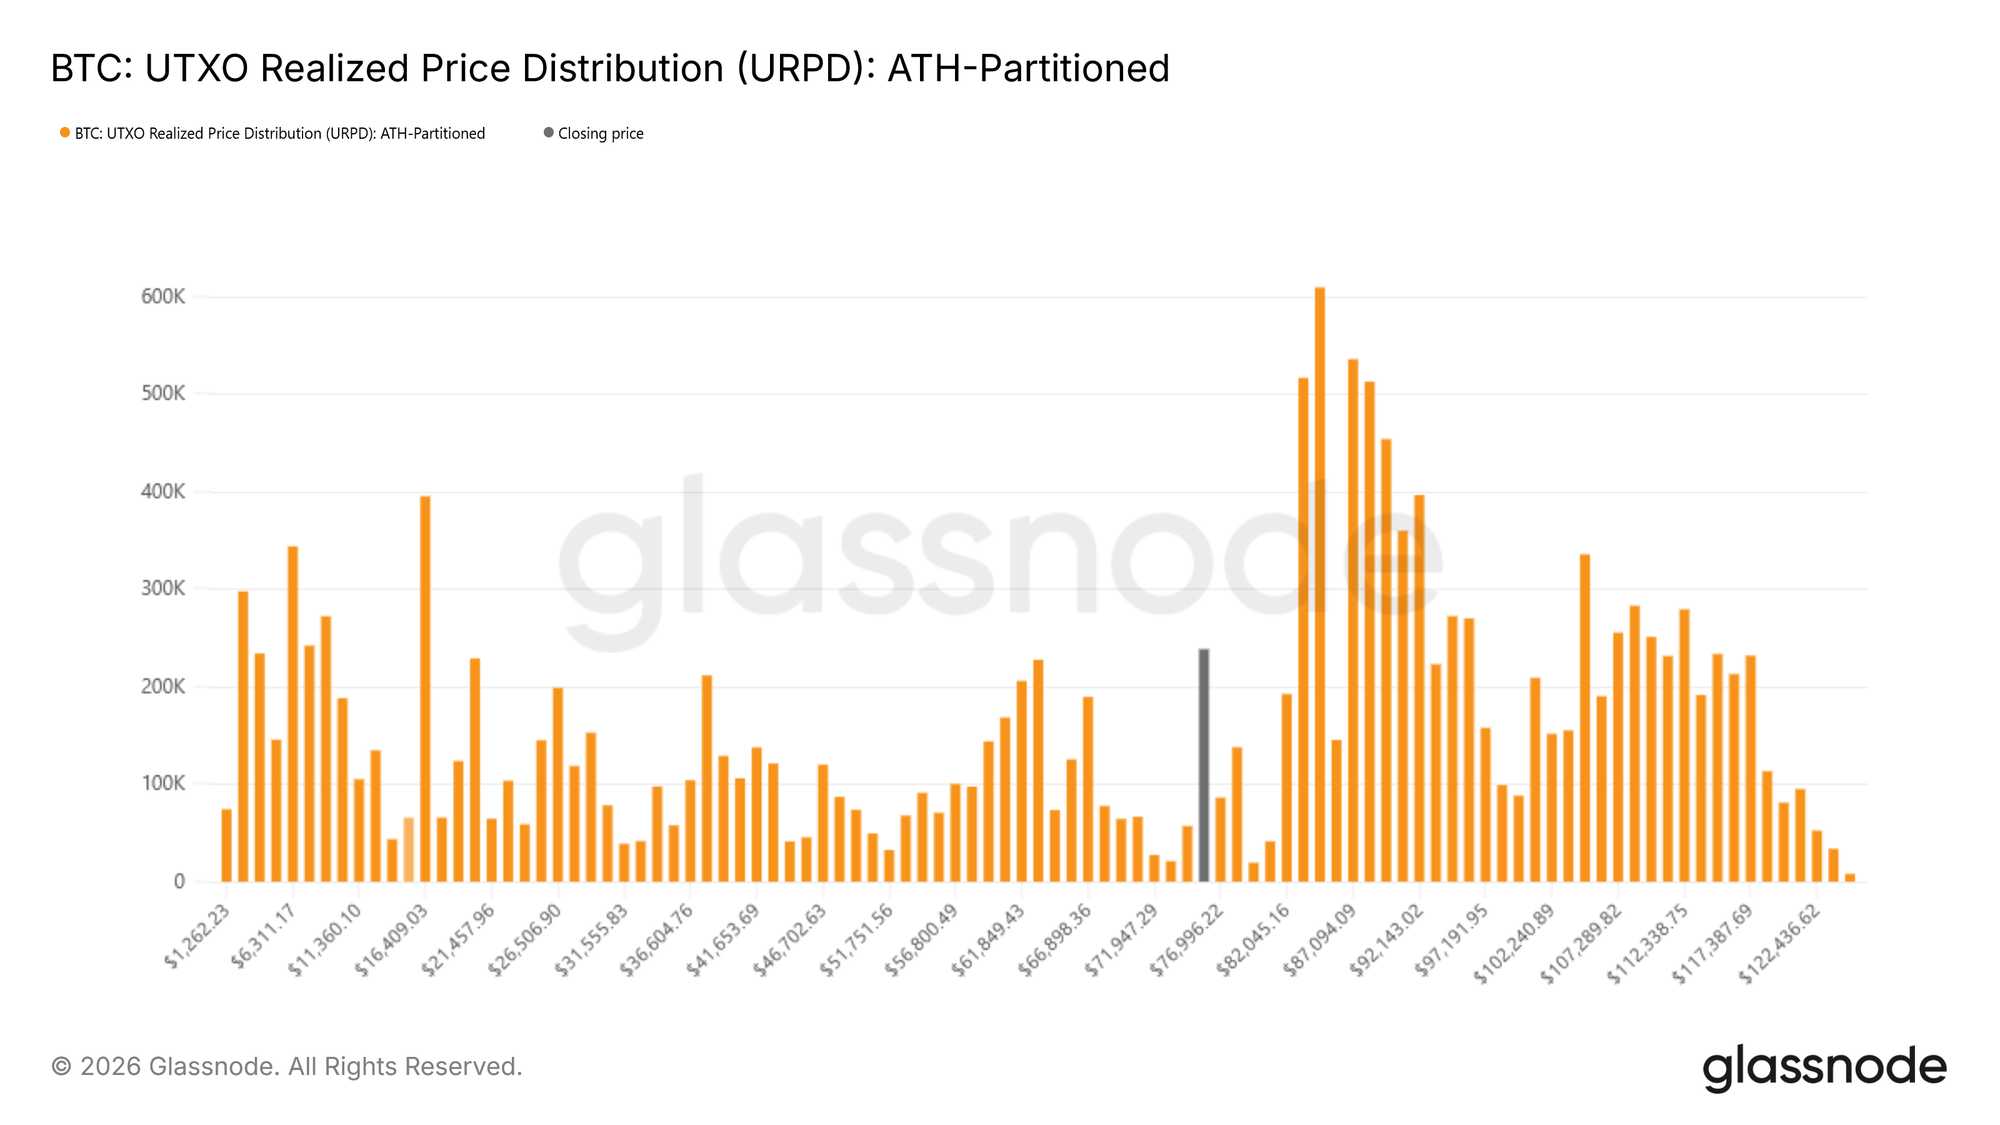
One such lens is the UTXO Realized Price Distribution (URPD), which maps the supply held at different cost bases. Current distributions show notable accumulation by newer participants within the $70k–$80k range, suggesting early positioning by buyers willing to absorb weakness at these levels. Beneath this zone, a dense supply cluster between $66.9k and $70.6k stands out as a particularly high-conviction region. Historically, areas with concentrated cost basis often act as short-term shock absorbers, where sell-side pressure is more readily met by responsive demand.
Live Chart

Stress Beneath the Surface

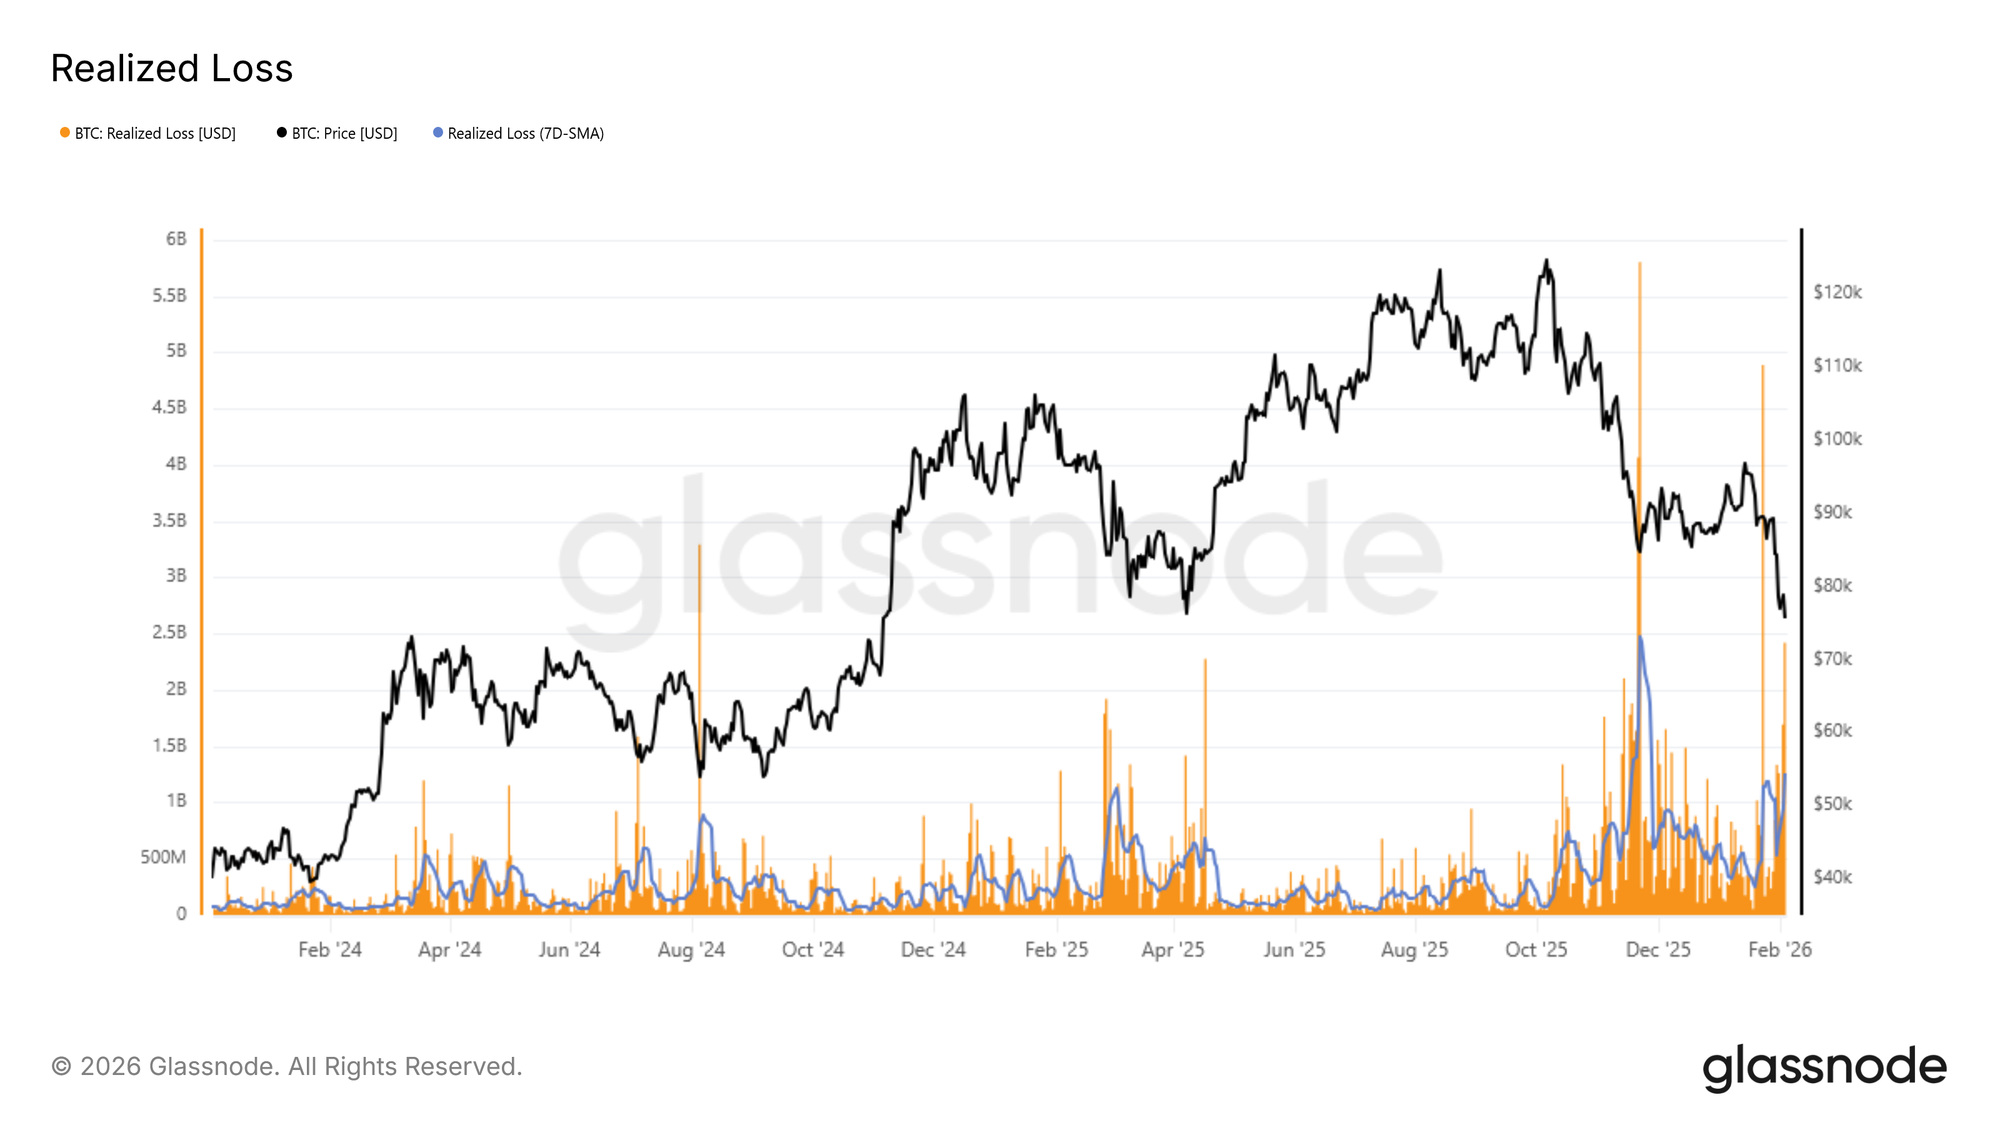
Capitulation dynamics offer another lens into near-term downside risk. Realized Loss provides a direct measure of investor stress by quantifying the volume of coins spent at a loss over a given time window, making it a useful tool for identifying periods of panic-driven selling.

During the current contraction, the 7-day simple moving average of realized losses has risen above $1.26B per day, reflecting a marked increase in fear and frustration following the loss of the True Market Mean. Historically, spikes in realized losses often coincide with moments of acute seller exhaustion, where marginal sell pressure begins to fade.

A recent example can be seen during the rebound from the $72k region, where daily realized losses briefly surged beyond $2.4B, nearly twice the prevailing 7-day average. Such extremes have frequently marked short-term inflection points, where forced selling gives way to temporary price stabilization.
Live Chart

Stress Versus Historical Extremes

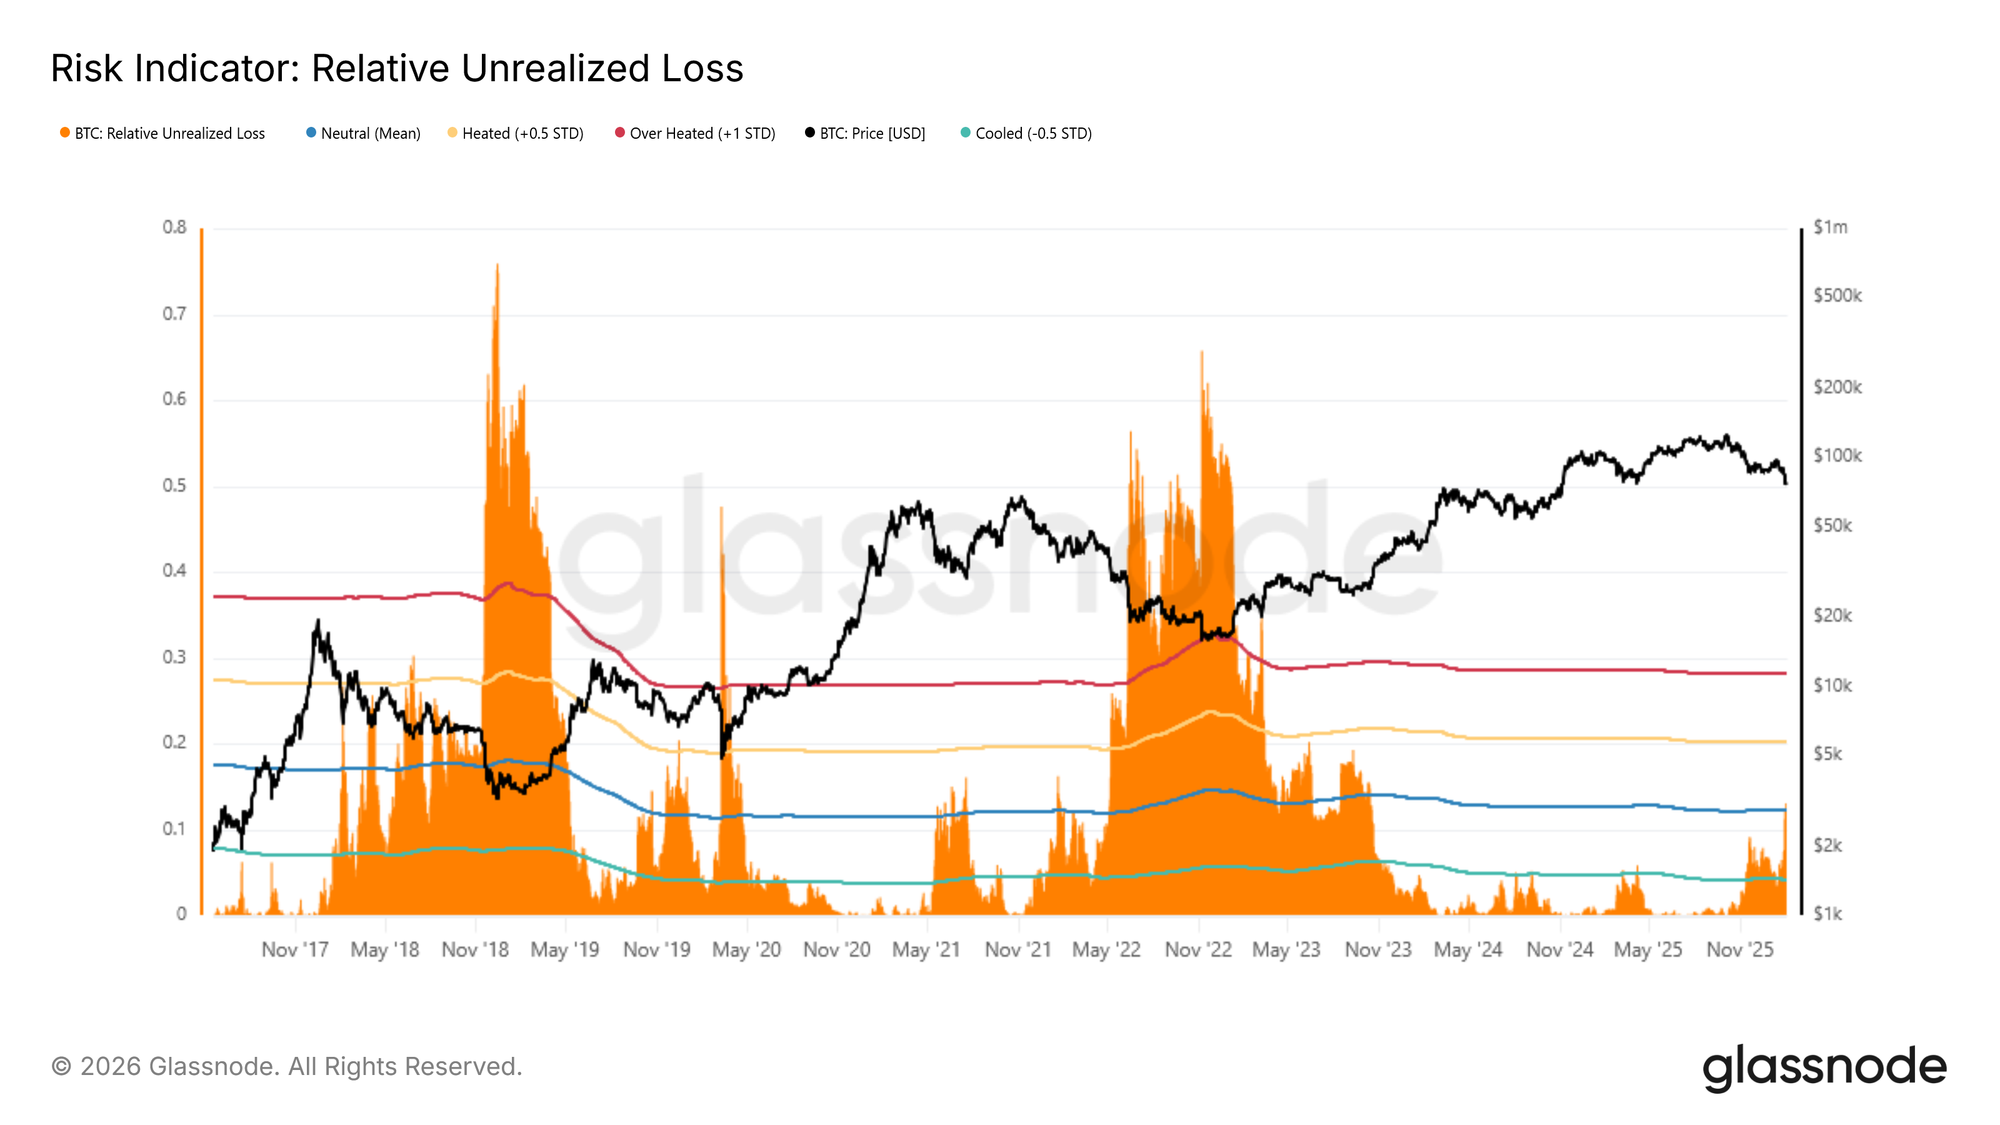
Taking a broader historical view adds important context to current conditions. To better frame the market’s position, Relative Unrealized Loss can be compared against prior bear-market extremes. This metric expresses the USD value of unrealized losses as a share of total market capitalization, allowing stress levels across cycles to be assessed on a normalized basis. Historically, cyclical peaks have exceeded ~30% (around +1 standard deviation), with far more severe readings in the 65%–75% range observed near the 2018 and 2022 cycle lows.

At present, Relative Unrealized Loss has risen above its long-term cyclical mean near 12%, confirming mounting pressure on investors holding coins with cost bases above the current spot price. While stress is clearly elevated, historical precedent suggests that moves toward the upper extremes typically coincide with exceptional dislocation events, such as the LUNA or FTX collapses, where price rapidly converged toward the Realized Price.
Live Chart

Off-Chain Insights

Weakness persists as Spot and Futures volumes are still subdued and the options market remains focused on downside protection.

Institutional Flow Swings to Net Outflow

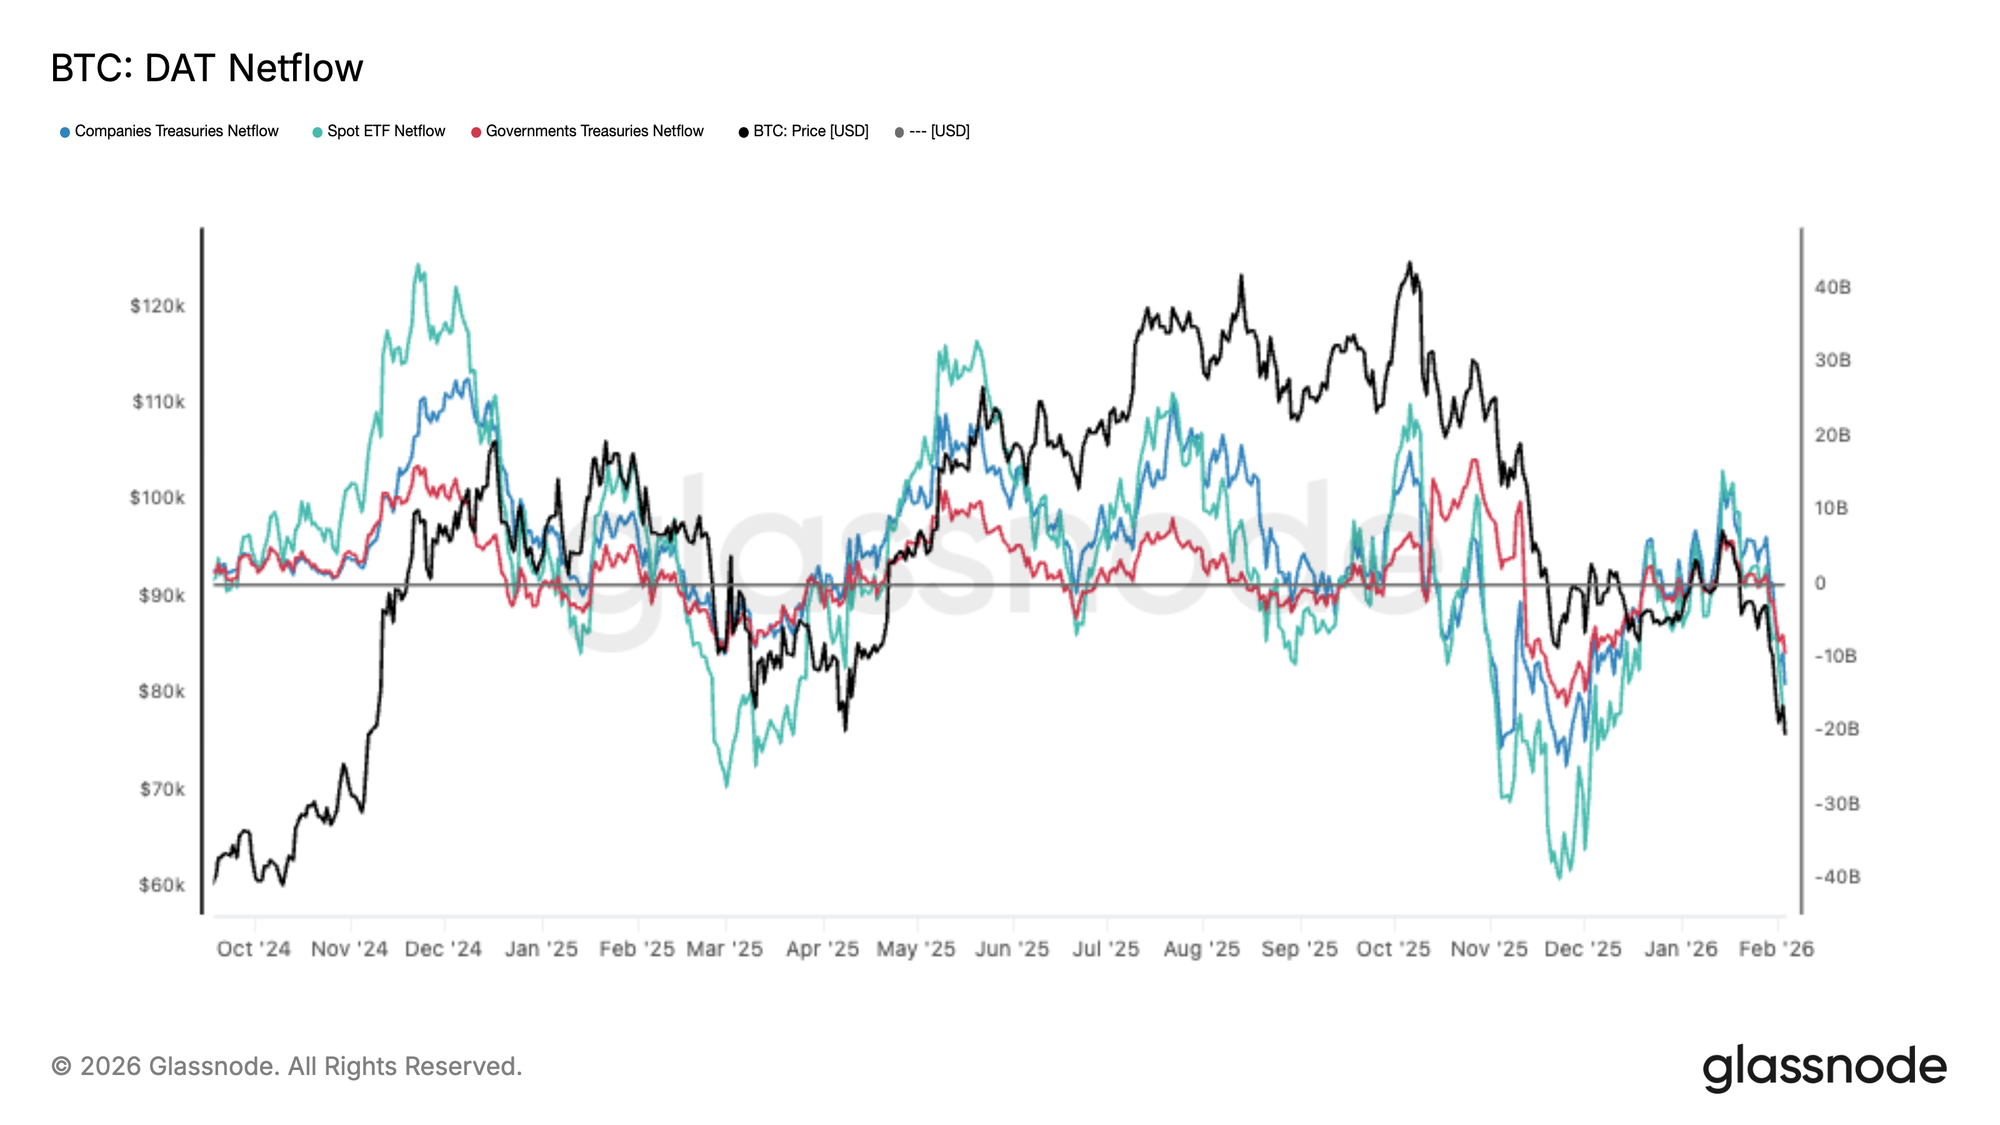
Demand across major allocators has deteriorated materially, with the DAT Netflow basket flipping back into net outflows as BTC breaks down. Spot ETF flows have softened sharply, while both corporate and government treasuries are also fading, signalling a broad-based retrenchment in marginal demand.

This is a key shift from the prior expansion phase, where persistent inflows helped absorb supply and support higher price discovery. Instead, flows are now consistently rotating negative, reinforcing the view that the market is struggling to attract fresh capital at current levels.

With institutional and treasury demand no longer providing a reliable bid, downside risk remains elevated, and any relief rallies are likely to face resistance unless netflows stabilise and re-accelerate back into sustained inflow.
Live Chart

Spot Volume Still Low

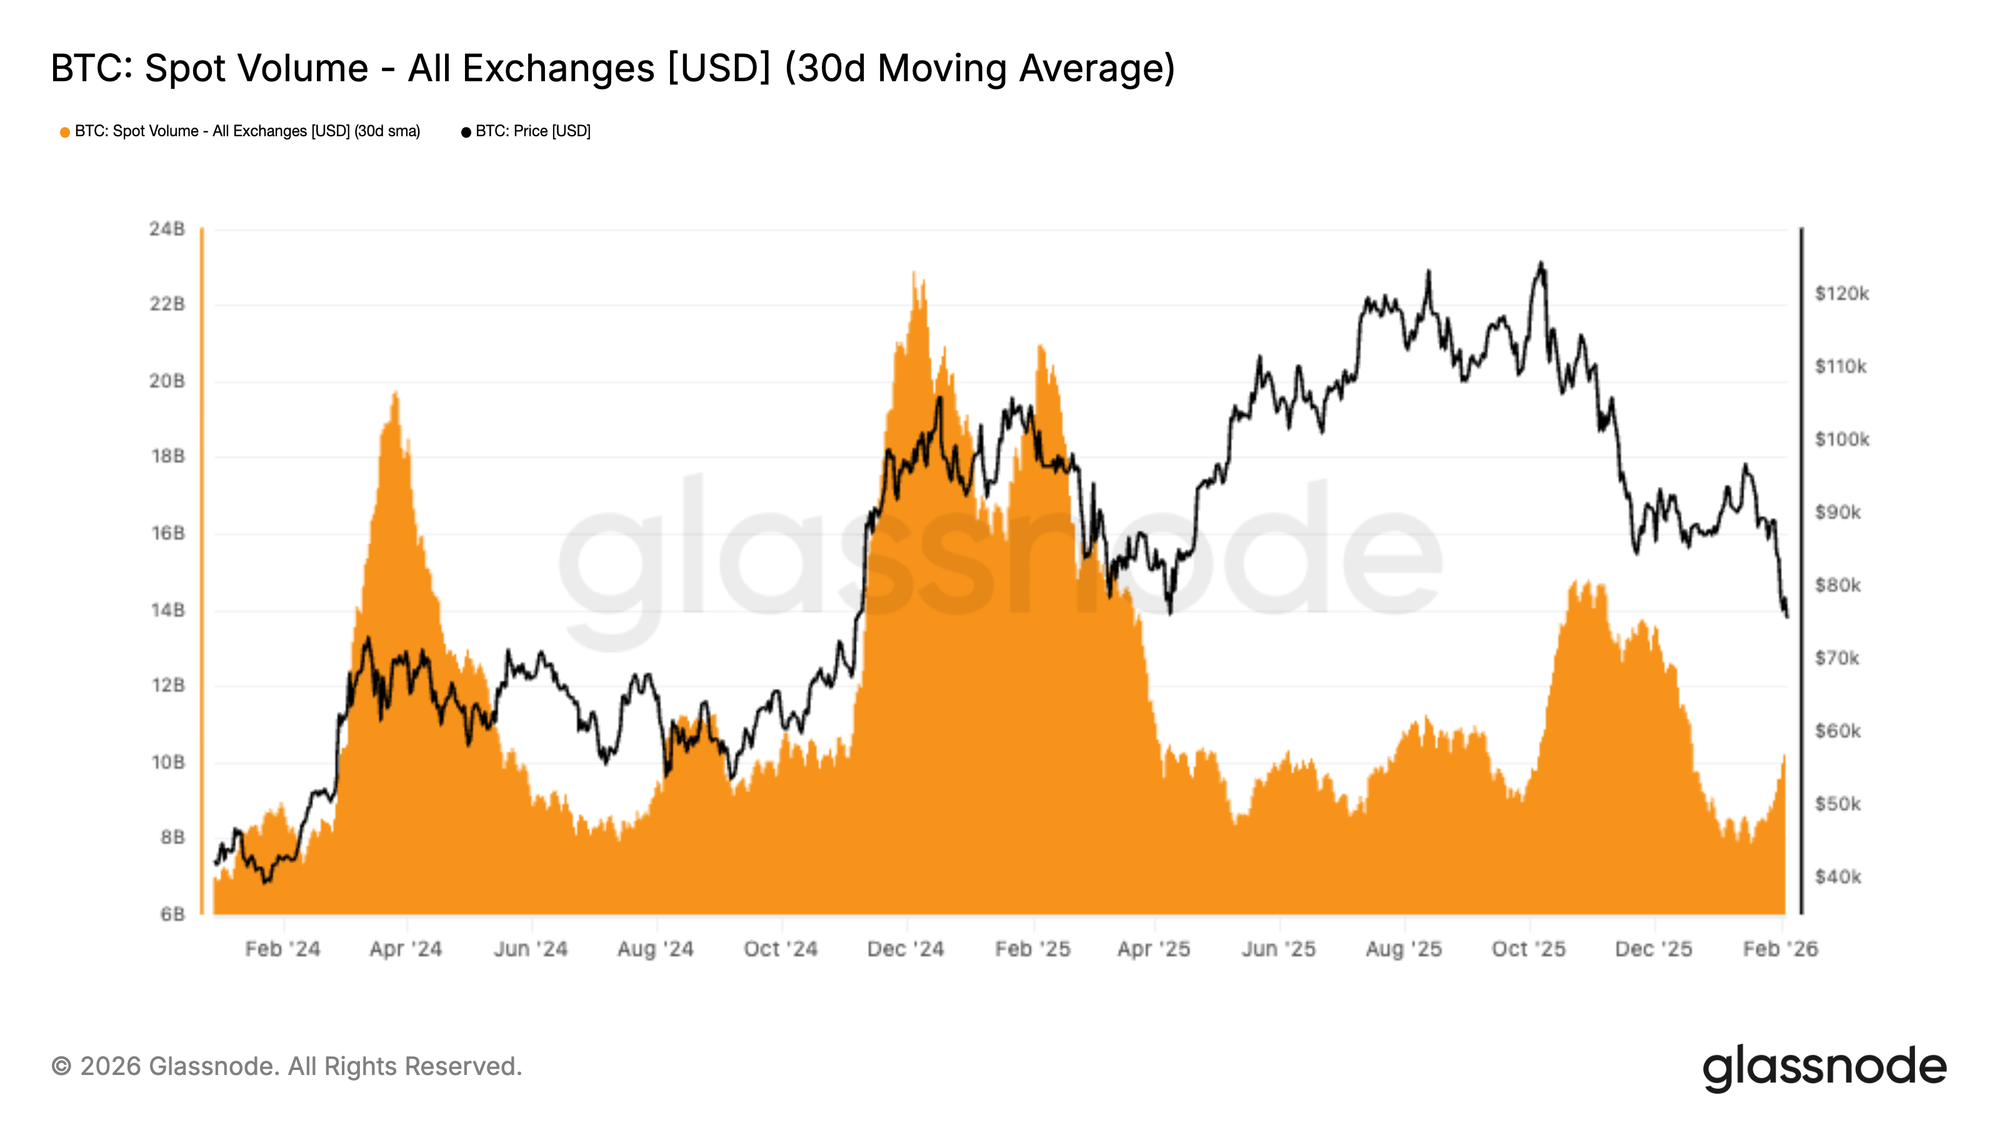
Spot volumes remain structurally weak, with the 30D average still depressed despite BTC rolling over from $98 to the $72k. This is emblematic of a demand vacuum, where sell-side pressure is not being met with meaningful, sustained absorption.

Historically, durable trend reversals have coincided with spot volume expanding aggressively as new demand steps in to take the other side. In this case, volume has only lifted modestly into the decline, suggesting activity is largely reactive and dominated by distribution and de-risking rather than conviction-driven accumulation.

With liquidity still thin, price remains vulnerable to downside continuation, as even moderate sell programs can exert outsized impact in a market lacking consistent spot bid support.
Live Chart

Futures Liquidations

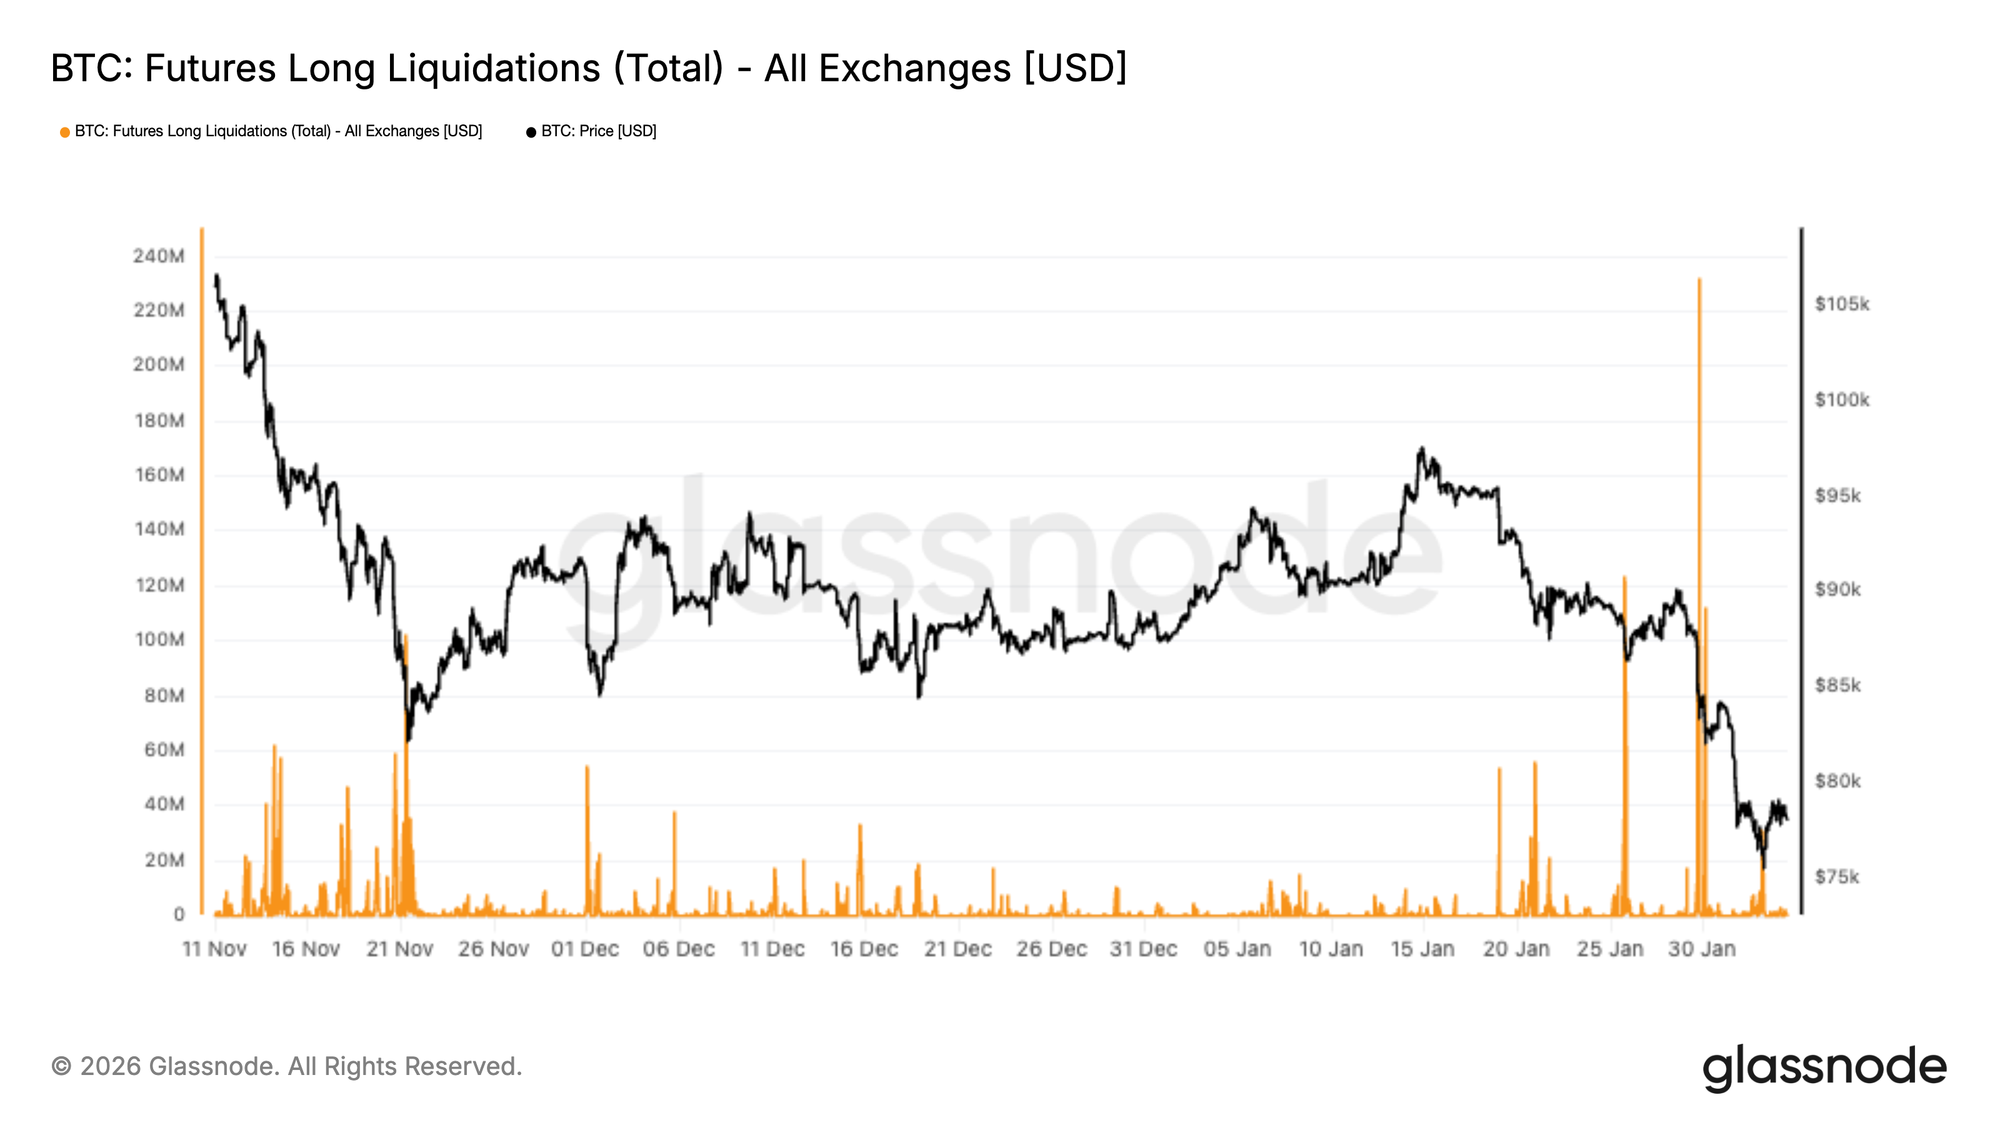
A sharp liquidation cascade has hit BTC derivatives markets, with total long liquidations across exchanges spiking to the largest print of this entire drawdown. This reflects an aggressive flush-out of leveraged long positioning as price broke lower, accelerating downside momentum into the mid-$70Ks.

Notably, liquidation activity had remained relatively muted through most of November and December, suggesting that leverage was progressively rebuilt into a weak spot backdrop. The recent surge marks a decisive regime shift, where forced selling has begun to dominate flows, amplifying volatility and widening intraday ranges.

From here, the ability for price to stabilise will depend on whether this leverage reset is sufficient to clear excess risk, or if further deleveraging is required.
A sustained recovery typically requires spot demand to step in, rather than relying on liquidation-driven positioning clean-outs alone.
Live Chart

Front-End Implied Volatility Stays Bid

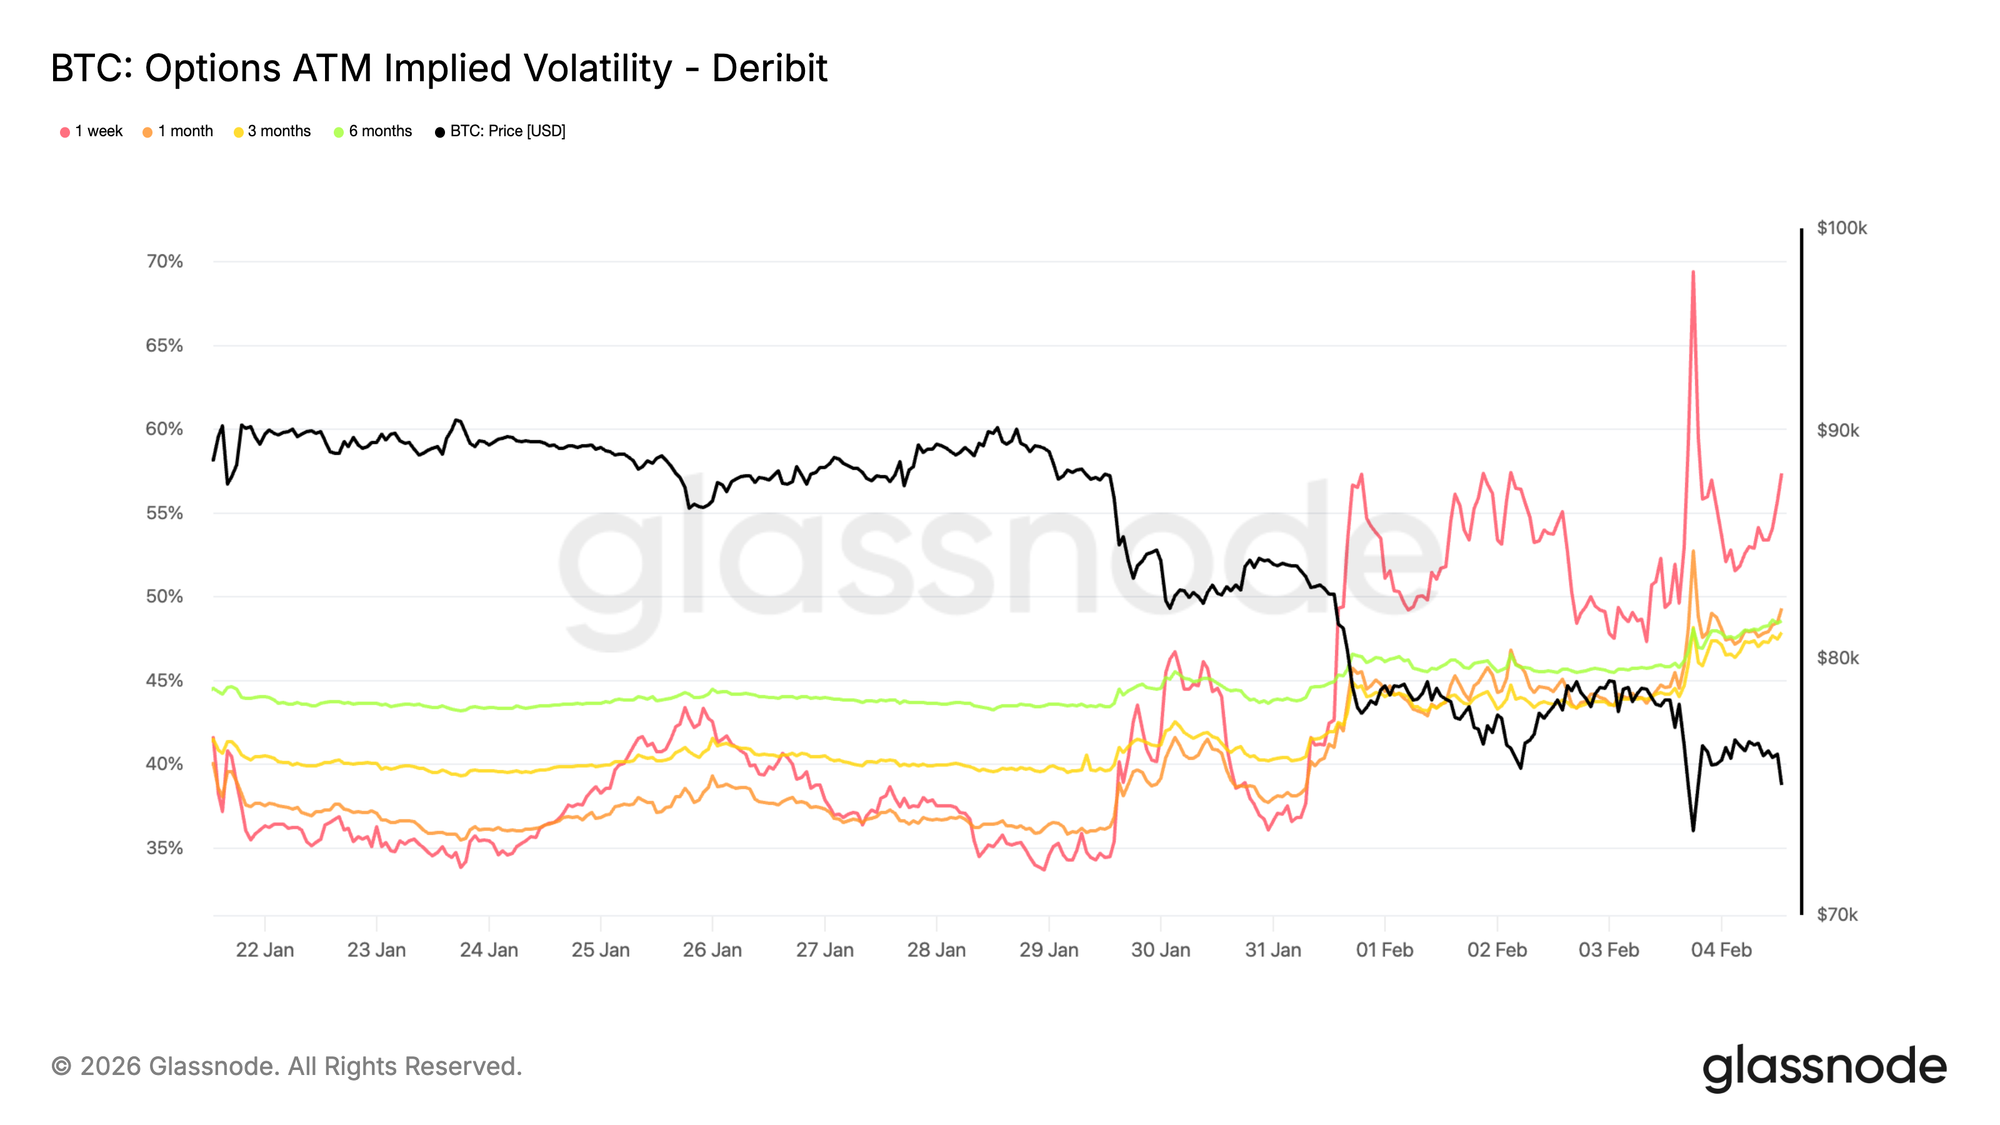
Short-dated implied volatility surged toward 70 percent as price retested the 73k level, a former cycle high now acting as support. Since the weekend, the volatility regime has shifted higher. One-week implied volatility is up roughly 20 vol points compared with two weeks ago, while the rest of the curve has also repriced materially, gaining high single-digit vol points.

When short-dated implied volatility remains elevated relative to recent realized moves, it shows the market continues to pay for near-term risk rather than monetizing volatility decay. The repricing is not isolated to one maturity but is led by the front end, highlighting where risk is being concentrated.

This behavior reflects strong demand for protection against sudden gap moves rather than clear directional conviction. Traders remain reluctant to sell short-dated risk aggressively, keeping downside premium supported and confidence fragile.
Live Chart

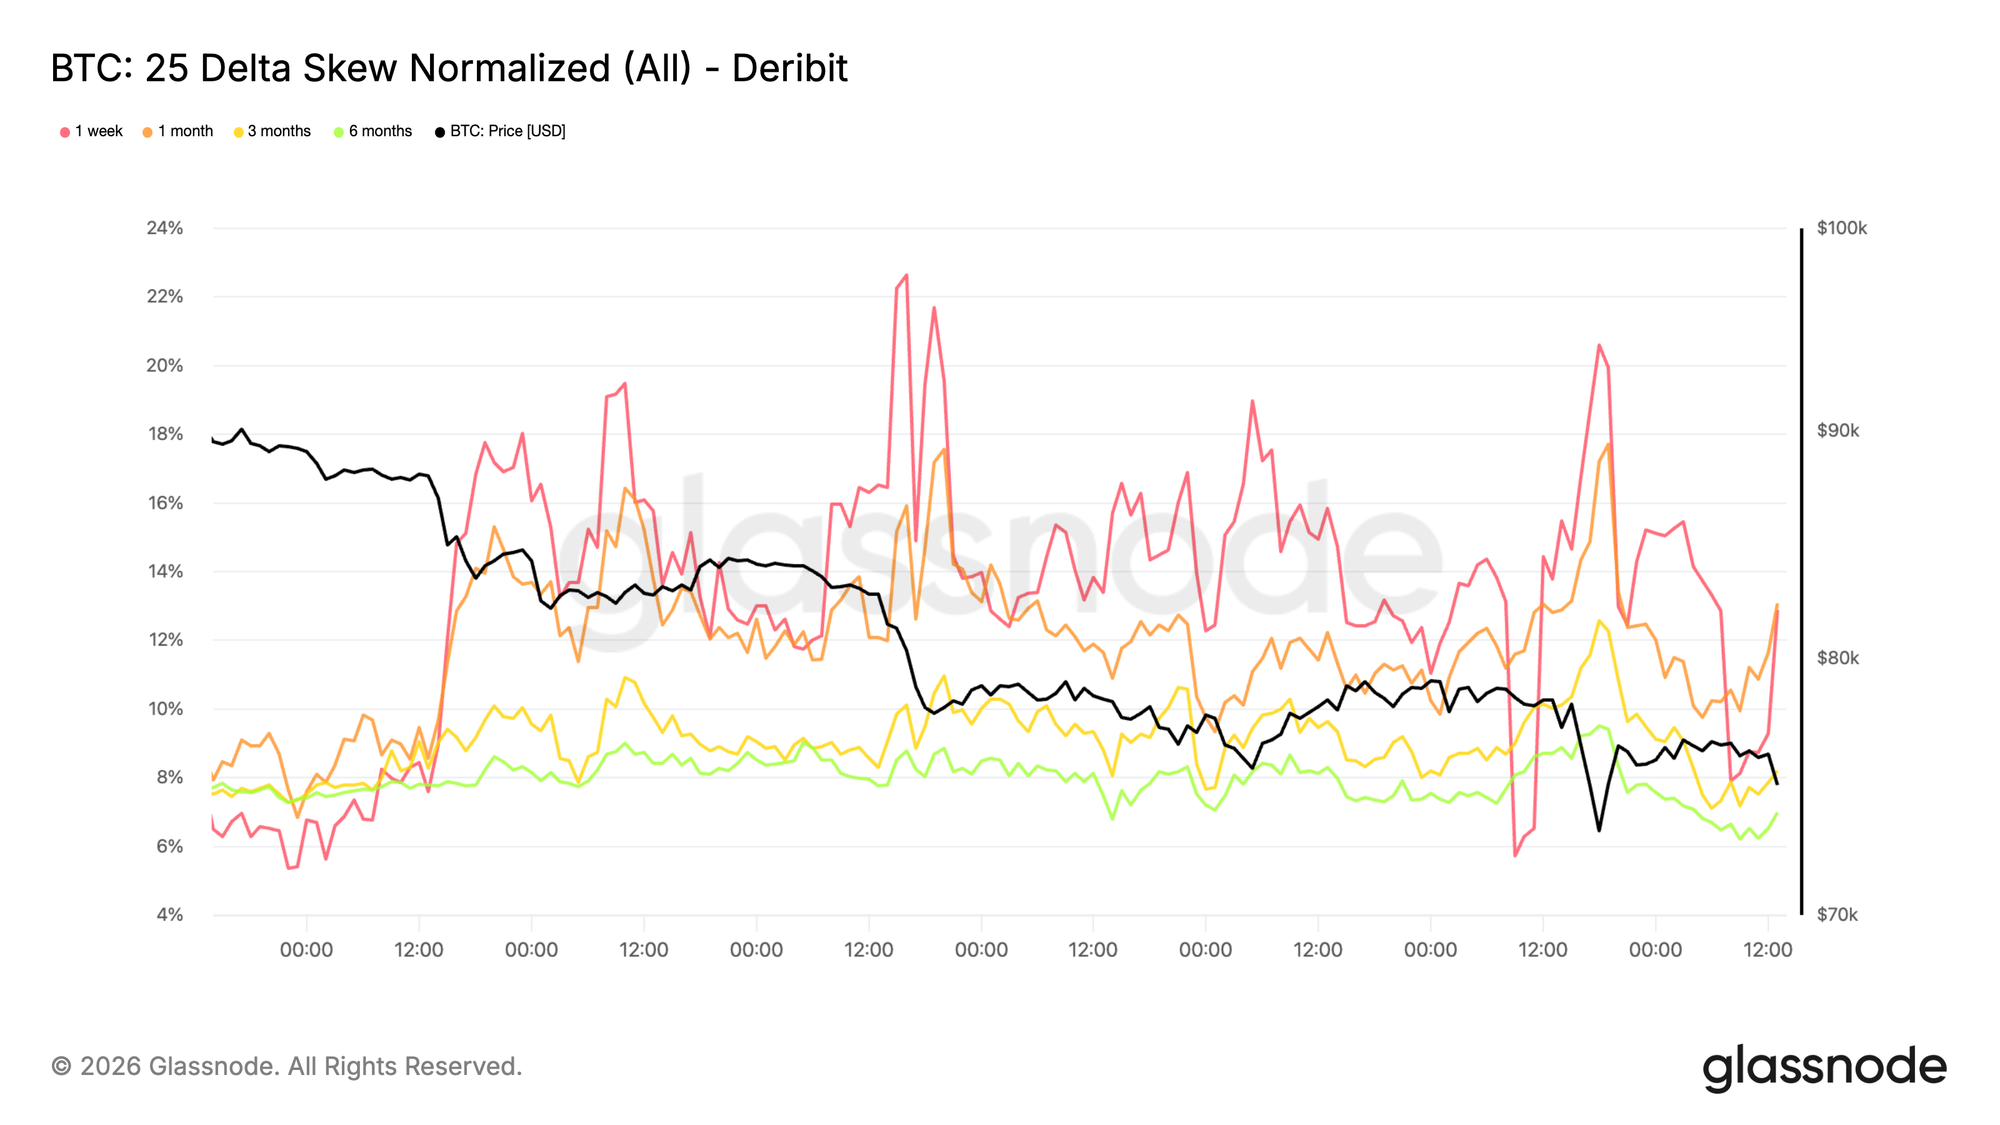
Downside Skew Continues to Steepen

The repricing in volatility is clearly directional. Downside skew has steepened again, showing stronger demand for puts relative to calls. This indicates the market is more focused on downside gap risk than on positioning for a relief rally, even as price continues to hold above the 73k level.

Rather than rotating into call demand, options flows remain concentrated in protection. This keeps the implied distribution tilted toward negative outcomes and reinforces the defensive tone already visible in front-end volatility.

Steep downside skew reflects a market willing to pay for insurance rather than express upside conviction. Positioning remains one-sided, with risk still concentrated around downside scenarios rather than recovery.
Live Chart

1-Week Volatility Risk Premium Turns Negative

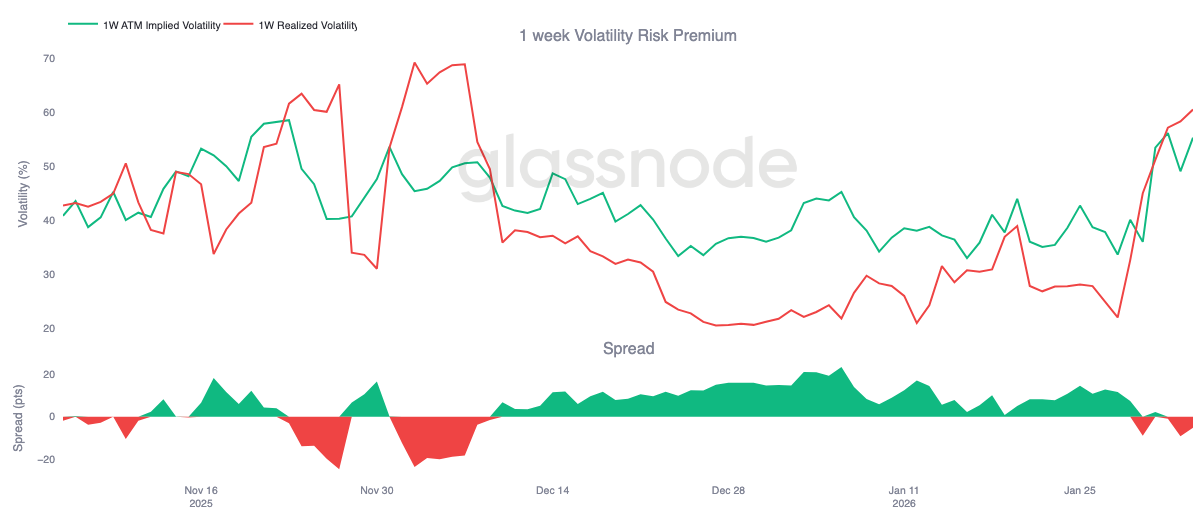
The tension visible in front-end implied volatility and downside skew is now spilling into carry. The 1-week volatility risk premium has turned negative for the first time since early December, dropping to around -5. This is a sharp reversal from roughly +23 one month ago.

A negative volatility risk premium means implied volatility is now trading below realized volatility. For gamma sellers, carry has flipped from supportive to punitive. Positions that previously benefited from time decay are now bleeding, forcing desks to hedge more actively or roll exposure forward. This mechanical response adds to short-term pressure rather than absorbing it.

With carry in the red, volatility is no longer being warehoused. Instead, it is being realized. In this context, options flows stop dampening moves and begin to reinforce them, contributing to the current bearish pressure already visible in skew and front-end pricing.
Live Chart

75k Put Premium Evolution (Short and Mid Term)

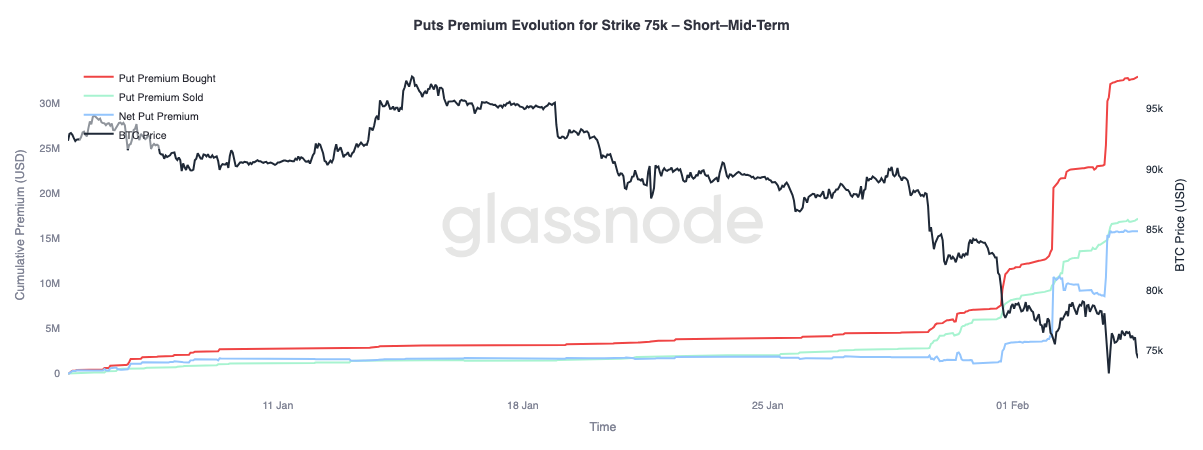
Let’s analyze the behavior of the 75k put premium, a level that is currently being actively contested, sustained, and repeatedly tested. This strike has become a clear focal point for short-term risk positioning.

Put premium bought has increased significantly relative to premium sold, widening the net premium gap. This repricing unfolded in three distinct phases, each coinciding with downside moves where the market failed to show meaningful relief. Each leg lower inflicted pressure on existing positions, forcing traders to hedge and reinforcing demand for protection.

Further out the curve, beyond three months and not shown on this chart, the dynamic is different. Premium sold has recently overtaken premium bought, indicating that traders are willing to monetize elevated volatility at longer maturities while continuing to pay up for short-term downside protection.
Live Chart

Conclusion

Bitcoin has shifted deeper into a defensive regime, with both on-chain and off-chain indicators aligning around a bearish bias. The ongoing compression in profitability metrics highlights that unrealised gains have been heavily eroded, while realised losses continue to mount as investors derisk into weakness. This is compounded by thin spot liquidity, where participation remains muted and rallies struggle to attract sustained demand.

Across derivatives markets, the selling impulse has become increasingly disorderly, with large long liquidation events confirming that leverage is being forcibly reset. While this deleveraging can remove excess speculative froth, it does not by itself establish a durable floor. Options markets reflect this uncertainty, with downside skew steepening and implied volatility remaining elevated, signalling that traders continue to position for further turbulence.

From here, the key variable remains spot demand. Without a clear expansion in spot participation and consistent inflows returning, the market remains vulnerable to downside continuation and sharp, unstable rebounds. Until conditions improve, the balance of risk remains skewed lower, and any recovery is likely to require time, absorption, and a meaningful return of conviction from buyers.


Câu hỏi Liên quan

QWhat is the significance of Bitcoin price breaking below the True Market Mean, and what are the key resistance and support levels mentioned?

AThe break below the True Market Mean, which is the aggregate cost basis of actively circulating supply, confirms a deterioration in market structure and signals a deeper bearish phase. The True Market Mean near $80.2k now acts as overhead resistance, while the Realized Price around $55.8k defines the lower support bound where long-term capital historically re-engages.

QAccording to the UTXO Realized Price Distribution (URPD), where are the potential demand zones that could act as short-term shock absorbers?

AThe URPD shows notable accumulation by newer participants in the $70k–$80k range, with a dense supply cluster between $66.9k and $70.6k identified as a high-conviction region. These zones historically act as short-term shock absorbers where sell-side pressure is met by responsive demand.

QHow does the current level of realized losses compare to historical extremes, and what does it indicate about market stress?

AThe 7-day average of realized losses has risen above $1.26B per day, reflecting increased fear. However, historical cyclical peaks for Relative Unrealized Loss have exceeded ~30% (reaching 65%–75% in 2018 and 2022 lows), suggesting current stress, while elevated, has not yet reached extreme bear market levels seen during events like the LUNA or FTX collapses.

QWhat is the current trend in institutional and ETF flows, and how does it impact downside risk?

AInstitutional demand has deteriorated, with DAT Netflow basket flipping to net outflows, spot ETF flows softening, and corporate/government treasury demand fading. This broad-based retrenchment in marginal demand removes reliable bids, keeping downside risk elevated and making relief rallies likely to face resistance unless netflows stabilize and return to sustained inflows.

QHow are options market dynamics, such as implied volatility and skew, reflecting trader sentiment and risk perception?

AShort-dated implied volatility surged toward 70%, with downside skew steepening, indicating strong demand for puts and protection against downside gap risk rather than upside conviction. The 1-week volatility risk premium turned negative, implying implied volatility is below realized volatility, which reinforces bearish pressure as options flows amplify moves rather than dampening them.

Nội dung Liên quan

Ngày Tươi Sáng Khó Trở Lại, Các Quỹ VC Crypto Đang Trải Qua Điều Gì?

Đầu tư mạo hiểm chuyên sâu vào tiền mã hóa đang trải qua một sự chuyển đổi lớn. Các quỹ chuyên biệt hàng đầu như Paradigm (vừa huy động 1,2 tỷ USD) và Framework Ventures (huy động 400 triệu USD) đang mở rộng danh mục đầu tư sang các lĩnh vực khác như AI, robot, hàng không vũ trụ, thậm chí xóa bỏ các tham chiếu về "tiền mã hóa" khỏi thông điệp của mình. Quý I/2026 chỉ có 8 quỹ VC thuần túy về tiền mã hóa mới được thành lập, mức thấp nhất kể từ năm 2020. Theo lý thuyết chu kỳ công nghệ của Carlota Perez, tiền mã hóa đang chuyển từ giai đoạn "xây dựng" sang "phổ cập". Các gã khổng lồ truyền thống như Stripe, BlackRock, VISA đã hiểu và tích hợp công nghệ blockchain vào hoạt động cốt lõi của họ, làm xói mòn lợi thế thông tin độc quyền trước đây của các quỹ chuyên sâu. Ngành VC đang phân cực thành hình dạng "tạ tạ": một bên là các nền tảng đầu tư tổng hợp khổng lồ (a16z, Sequoia) có thể bao trùm toàn bộ lĩnh vực; bên kia là các quỹ nhỏ, chuyên sâu dựa vào hiểu biết sâu để đầu tư mạo hiểm vào các dự án tiên phong. Các quỹ quy mô trung bình thuần túy về tiền mã hóa đang bị mắc kẹt trong "vùng chết", vì không đủ lớn để cạnh tranh ở các vòng tăng trưởng, cũng không thể chỉ dựa vào các khoản đầu tư hạt giống nhỏ để đạt mức thoái vốn cần thiết (thường gấp 3 lần quỹ). Áp lực từ các nhà đầu tư (LP) cũng thúc đẩy sự thay đổi. Với lợi nhuận thực tế (DPI) thấp từ các quỹ năm 2021 và làn sóng AI hút 70% vốn đầu tư mạo hiểm, các nhà quản lý quỹ buộc phải đa dạng hóa để đáp ứng kỳ vọng của LP. Đối với các startup tiền mã hóa, điều này có nghĩa là việc gọi vốn sẽ khó khăn hơn. Họ phải cạnh tranh với vô số dự án AI để thu hút sự chú ý của các quỹ tổng hợp. Hơn nữa, các quỹ tổng hợp ít có khả năng đầu tư vào cơ sở hạ tầng công cộng hoặc nghiên cứu cơ bản (như MEV, công cụ cross-chain) – vốn rất quan trọng cho sự phát triển của hệ sinh thái nhưng khó có lợi nhuận thương mại trực tiếp. Tóm lại, "nhà đầu tư tiền mã hóa" như một danh mục riêng biệt đang trở nên lỗi thời. Tiền mã hóa đang trở thành cơ sở hạ tầng tài chính cơ bản. Các quỹ chuyên sâu cỡ trung đang thu hẹp hoặc biến mất. Tương lai sẽ là sự phân công: các quỹ tổng hợp lớn nắm giữ các khoản đầu tư tăng trưởng vào cơ sở hạ tầng tài chính dựa trên blockchain, trong khi các quỹ nhỏ, chuyên biệt tiếp tục ươm mầm cho các thí nghiệm tiên phong và ngách mới như mã hóa tài sản (tokenization), chứng khoán trên chuỗi.

Foresight News13 phút trước

Ngày Tươi Sáng Khó Trở Lại, Các Quỹ VC Crypto Đang Trải Qua Điều Gì?

Foresight News13 phút trước

Khi Sự Đồng Thuận Diễn Ra Ngày Càng Nhanh, Các Nhà Đầu Tư Trẻ Đang Đánh Cược Vào Điều Gì?

Khi sự đồng thuận thị trường ngày càng nhanh, các nhà đầu tư trẻ đang tập trung vào đâu? Đầu tư công nghệ hiện nay đang trải qua sự chuyển dịch rõ rệt, với bốn xu hướng chính được các nhà đầu tư trẻ hàng đầu quan tâm. **Xu hướng 1: AI rời màn hình, bước vào thế giới vật lý.** Trọng tâm đầu tư đang chuyển từ mô hình lớn và ứng dụng sinh dữ liệu sang robot, thiết bị AI, xe tự lái và hệ thống công nghiệp. Thách thức lớn không còn là khả năng của mô hình, mà là năng lực triển khai, độ tin cậy và hiệu quả chi phí khi tích hợp vào môi trường vật lý. Ngành giao hàng tự động (ví dụ: Bạch Tê Ngưu với hơn 2000 xe) là minh chứng cho xu hướng này. **Xu hướng 2: Lợi nhuận từ mô hình lớn chưa hết, cạnh tranh chuyển sang "Bánh xe thông minh".** Thay vì chỉ tìm kiếm kiến trúc kế tiếp, các nhà đầu tư tập trung vào các công ty có thể nhúng khả năng AI hiện có vào quy trình làm việc thực tế, tạo ra vòng lặp phản hồi "bánh xe thông minh": dữ liệu người dùng -> cải thiện mô hình -> trải nghiệm tốt hơn -> nhiều người dùng hơn. Sự thành công của Zhipu AI và Kling AI của Kuaishou cho thấy giá trị của việc xây dựng hệ thống tự củng cố này. **Xu hướng 3: Nghẽn dữ liệu thúc đẩy công nghệ nền tảng mới, mô hình cơ bản khoa học trở thành hướng đi không đồng thuận.** Khi dữ liệu chất lượng cao từ internet trở nên khan hiếm, việc đào tạo AI cần các nguồn kiến thức mới. Các phương pháp như học tăng cường, tự đối kháng và đặc biệt là **Mô hình Cơ bản Khoa học** (Scientific Foundation Models) hứa hẹn sử dụng dữ liệu và quy luật từ các lĩnh vực chuyên sâu (sinh học, vật liệu) để mở rộng biên giới của AI, mặc dù đây vẫn là một lĩnh vực đầy thách thức. **Xu hướng 4: Càng tiến vào vùng nước sâu của công nghệ cứng, càng cần vốn kiên nhẫn.** Trong các lĩnh vực như hàng không vũ trụ thương mại, máy tính lượng tử và năng lượng tiên tiến, chu kỳ xác minh dài hơn và con đường thương mại hóa không rõ ràng. Các nhà đầu tư cần xây dựng phán đoán sớm, tập trung vào năng lực nghiên cứu cốt lõi, khả năng kỹ thuật và sự kiên cường của đội ngũ, thay vì kỳ vọng lợi nhuận ngắn hạn. Sự quan tâm đến robot không gian, điện toán không gian và vật liệu năng lượng không gian phản ánh tầm nhìn dài hạn này. Tóm lại, các nhà đầu tư trẻ ngày nay không chỉ theo đuổi các khái niệm nóng, mà đang chuyển sang phân tích sâu sắc con đường tích hợp công nghệ vào ngành công nghiệp, tìm kiếm các hệ thống tạo ra vòng lặp phản hồi bền vững và sẵn sàng đồng hành cùng các dự án công nghệ cứng trong hành trình dài hạn.

marsbit41 phút trước

Khi Sự Đồng Thuận Diễn Ra Ngày Càng Nhanh, Các Nhà Đầu Tư Trẻ Đang Đánh Cược Vào Điều Gì?

marsbit41 phút trước

Giải phóng 100 triệu USD thanh khoản? Chính sách mới của Pump.fun thử nghiệm chiến thuật bơm giá trong 5 phút

Bài viết thảo luận về cơ chế BOOST mới được Pump.fun công bố vào ngày 21/7, trở thành cơ chế phát hành mặc định cho các token mới. Cơ chế này nhắm giải quyết vấn đề "thanh khoản chết" - khoảng 20% vốn bị khóa vĩnh viễn trong nhóm thanh khoản (LP) sau khi token di chuyển từ bonding curve, gây lãng phí ước tính hơn 100 triệu USD mỗi năm. Thay vì khóa số vốn này, BOOST sẽ dùng nó (khoảng 17,6 SOL hoặc 2516 USDC) để mua token ngay trong 5 phút đầu sau khi di chuyển lên PumpSwap, thông qua cơ chế TWAP, và ngay lập tức đốt số token mua được. Điều này tạo áp lực mua tức thời và giảm nguồn cung vĩnh viễn. Mục tiêu của Pump.fun là tạo ra "pháo hoa" trong 5 phút đầu, kích thích giao dịch và cải thiện trải nghiệm cho nhà giao dịch meme - đối tượng thường quan tâm đến đợt "bứt phá" ngay khi token ra mắt. Cách tiếp cận này nhằm tăng tỷ lệ token tạo ra khối lượng giao dịch bền vững, từ đó củng cố doanh thu nền tảng và tính bền vững của việc mua lại token PUMP. Tuy nhiên, bài viết cũng nêu lo ngại: cơ chế có thể khiến các token chất lượng thấp dễ thành công hơn về mặt hình thức và làm tăng rủi ro sau 5 phút, khi áp lực mua biến mất và token có thể lao dốc nhanh hơn nếu gặp bán tháo.

Foresight News52 phút trước

Giải phóng 100 triệu USD thanh khoản? Chính sách mới của Pump.fun thử nghiệm chiến thuật bơm giá trong 5 phút

Foresight News52 phút trước

Đơn vị quản lý tài sản lớn nhất Ấn Độ SBI lên sàn, số liệu giao dịch hé lộ tín hiệu gì?

SBI Funds Management, công ty quản lý quỹ lớn nhất Ấn Độ, đã niêm yết vào ngày 21/7. Đợt IPO trị giá khoảng 10,3 tỷ USD được định giá kỷ lục gấp 42 lần, cho thấy nhu cầu mạnh mẽ từ các nhà đầu tư tổ chức và bán lẻ đối với tài sản tài chính cốt lõi. Tuy nhiên, giá đóng cửa ngày đầu tiên chỉ tăng khoảng 6,3%, thấp hơn nhiều so với kỳ vọng chênh lệch 16% trên thị trường chợ đen, cho thấy vốn sẵn sàng nhưng không chấp nhận trả giá quá cao. Sự thành công thận trọng của SBI đặt ra một cột mốc định giá mới cho thị trường IPO Ấn Độ: cửa sổ IPO vẫn mở, nhưng ưu tiên cho các công ty có thương hiệu mạnh, dòng tiền ổn định và câu chuyện tăng trưởng thâm nhập dài hạn rõ ràng. Một tín hiệu đáng chú ý khác là phí bảo lãnh phát hành cực thấp (khoảng 0,01%), khiến một số ngân hàng quốc tế rút lui. Điều này phản ánh quyền định giá đang nghiêng về phía các tổ chức phát hành mạnh như SBI, những người có thể dựa vào kênh phân phối nội địa và thương hiệu, làm giảm giá trị cận biên mà các ngân hàng đầu tư quốc tế mang lại. Tăng trưởng ổn định của ngành quản lý quỹ Ấn Độ (dự báo CAGR 16-18%) hỗ trợ định giá, nhưng thị trường vẫn cân nhắc các yếu tố chu kỳ. Bài kiểm tra thực sự cho cửa sổ IPO sẽ là các đợt chào bán lớn tiếp theo như Reliance Jio và Sở giao dịch chứng khoán quốc gia (NSE). Thành công của họ ở mức định giá hợp lý sẽ khẳng định xu hướng mới; nếu bị trì hoãn, SBI sẽ chỉ là một thành công đơn lẻ.

marsbit1 giờ trước

Đơn vị quản lý tài sản lớn nhất Ấn Độ SBI lên sàn, số liệu giao dịch hé lộ tín hiệu gì?

marsbit1 giờ trước

Nhật Bản muốn dùng AI để mua tăng trưởng, thị trường trái phiếu có tin không?

Nội các Nhật Bản đã thông qua "Phương hướng cơ bản về vận hành và cải cách tài chính kinh tế 2026", chuyển trọng tâm mục tiêu tài chính từ cân bằng thu chi ngân sách cơ bản sang ổn định và giảm tỷ lệ nợ/GDP. Động thái này nhằm tạo không gian đầu tư vào các lĩnh vực chiến lược như AI, bán dẫn để thúc đẩy tăng trưởng, giải quyết vấn đề lão hóa và thiếu lao động. Tuy nhiên, thị trường trái phiếu tỏ ra hoài nghi. Việc làm suy yếu "mỏ neo" tài chính truyền thống có thể bị coi là nới lỏng kỷ luật ngân sách. Lợi tức trái phiếu chính phủ Nhật kỳ hạn 10 năm đã tăng, phản ánh lo ngại về tính tín nhiệm tài chính. Kế hoạch đầu tư 370 nghìn tỷ Yên đến năm 2040 không phải là ngân sách mới tập trung chỉ cho AI, mà là tổng đầu tư công-tư vào nhiều lĩnh vực. Thành bại của khung chính sách mới phụ thuộc vào việc liệu tốc độ tăng trưởng kinh tế danh nghĩa có vượt quá lãi suất dài hạn hay không, và liệu các khoản đầu tư chiến lược có thực sự cải thiện năng suất và thu ngân sách. Thị trường sẽ tiếp tục định giá dựa trên khả năng chính phủ chứng minh được hiệu quả đầu tư và con đường giảm nợ bền vững.

marsbit1 giờ trước

Nhật Bản muốn dùng AI để mua tăng trưởng, thị trường trái phiếu có tin không?

marsbit1 giờ trước

Giao dịch

Giao ngay
活动图片




